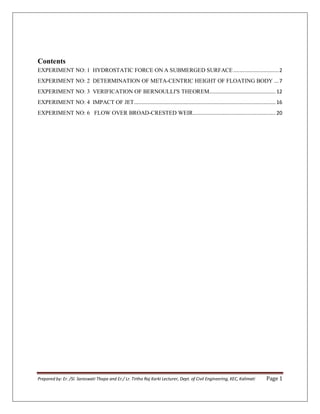
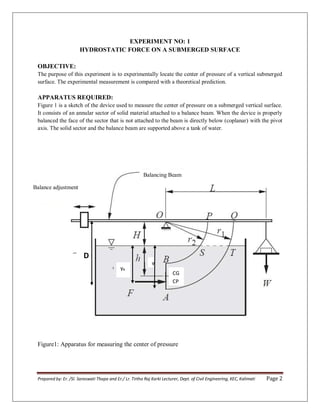
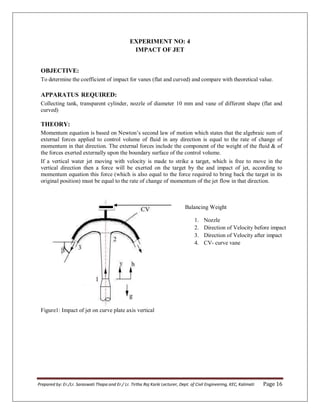
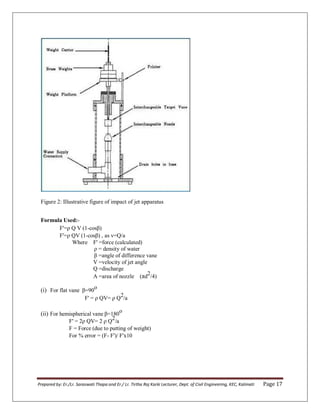
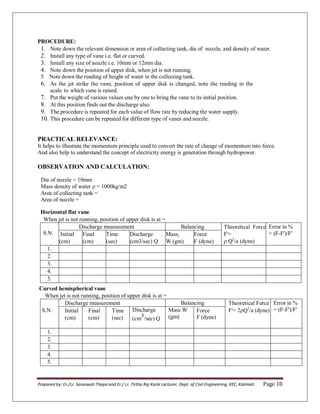
This document contains instructions for 6 experiments on fluid mechanics. Experiment 1 involves measuring the center of pressure on a submerged vertical surface. Experiment 2 determines the metacentric height of a floating body under different loading conditions. Experiment 3 verifies Bernoulli's theorem by measuring pressure and velocity changes in flowing water. Experiment 4 examines the impact of a jet. Experiments 5 and 6 involve flow measurement using Venturi meters and broad-crested weirs, respectively. The experiments provide practical demonstrations of key concepts in fluid mechanics.
EAGES Proceedings - K. V. Rozhdestvenskii 2Stephan Aubin
In 2001 Euroavia Toulouse organized a symposium on ground effect. We invited most of the Russian and German actors, and some experts from Holland, UK or France for a week of science around the subject of ekranoplans / flying boats. This was dedicated to students. A book was issued... and now that all copies have been sold for a while I am sharing this on LinkedIn for everyone.
Enjoy.
Stéphan AUBIN
EAGES Proceedings - K. V. Rozhdestvenskii 1Stephan Aubin
In 2001 Euroavia Toulouse organized a symposium on ground effect. We invited most of the Russian and German actors, and some experts from Holland, UK or France for a week of science around the subject of ekranoplans / flying boats. This was dedicated to students. A book was issued... and now that all copies have been sold for a while I am sharing this on LinkedIn for everyone.
Enjoy.
Stéphan AUBIN
This document discusses the analytical approach to modeling the longitudinal disturbed motion of an ekranoplan (wing-in-ground effect craft). It presents the linearized differential equations describing the craft's horizontal speed, flight altitude, and pitch angle in response to disturbances. Dimensionless forms of the equations are derived using characteristic time scales and coefficients for the aerodynamic forces and moments. Analysis of the characteristic determinant reveals the system responds to disturbances through combinations of the aerodynamic derivatives with respect to pitch angle, altitude, and vertical speed.
Impact of Ground Effect on Circulation Controlled Cylindrical SurfacesCSCJournals
Circulation control technology and motion in close proximity to the ground have both shown aerodynamic benefits in the generation of lift. Recent research efforts at West Virginia University have explored the potential of merging the two phenomena, in an attempt to enhance both technologies. This paper initiates this combined effort by experimentally investigating the impact ground effect has on the separation location of a jet blown tangentially over circulation controlled cylindrical surfaces. Previous experimental research on circulation controlled cylinders found an optimal radius of curvature and volumetric flow rate; whose model and optimal findings are built upon by this work through the addition of ground effect analysis by varying the ground height. The experiment investigates some of the variables that individually influence circulation control and ground effect; the variables are the radius of curvature, velocity of the jet, and the height from the ground. Data analysis revealed that for a constant volumetric flow rate and varying the height to radius (h/r) value, there is a large amount of variability in the data, indicating that the proximity of the ground has significant impact on the separation location and consequently influence on the potential lift characteristics. Furthermore, when this flow rate was analyzed, it was found that at an h/r of approximately 4.8, it appears that an optimal h/r occurs, based on the surface pressure and flow separation from the cylinders when not influenced by the ground. The data also found that at both radii, 0.520 and 0.659 inches, showed benefit when tested in close proximity to the ground. The findings demonstrate that there is further enhancement potential of the lift generating capability by uniting the lift enhancement of circulation control methodology with the ground effect flight regime. This effort is a preliminary study of a larger effort to determine if merging the two phenomena indicates a lift enhancement. This model does not have a free stream velocity, and subsequently does not measure lift, however, the findings depicted in this effort indicate that there is potential for enhancement, which is currently being researched by the authors.
The document discusses equations of motion used in weather forecasting and climate change studies. It begins with an introduction to geophysical fluid dynamics and the distinguishing effects of rotation and stratification. It then outlines the basic equations of motion, including conservation of momentum, mass, energy, and state. It describes how these equations are solved on grids using numerical models. It discusses the challenges of modeling processes at different spatial scales from synoptic to urban. It also addresses challenges in tropical weather prediction and how dynamical prediction of weather over South Asia has improved.
ME 438 Aerodynamics is a course taught by Dr. Bilal Siddiqui at DHA Suffa University. This set of lectures start from the basic and all the way to aerodynamic coefficients and center of pressure variations with angle of attack.
This document provides guidance on conducting reduced level surveys to establish accurate elevation references for groundwater monitoring structures like piezometers and observation wells. It discusses the importance of accuracy in elevation data for interpreting groundwater levels and flow. Methods covered include conventional surveying with leveling instruments, total stations, and GPS. The document recommends an accuracy of 10 mm per km in flat coastal areas and 50 mm per km elsewhere for hydrogeological studies. It also discusses establishing elevations relative to mean sea level using benchmarks from the Great Trigonometric Survey network maintained by Survey of India.
DGPS improves upon standard GPS accuracy by using a fixed reference station to calculate and broadcast differential corrections for errors caused by atmospheric delays of GPS signals. Receivers equipped with DGPS can then apply these corrections to achieve sub-meter accuracy, as low as 10 cm in some cases. It works by having a stationary receiver at a known location calculate differential errors compared to GPS satellites and broadcasting correction signals to enable mobile DGPS receivers to determine their position with much greater precision.
This document discusses the concepts of static equilibrium, stability, and center of buoyancy as they relate to floating bodies. It states that a body is in stable equilibrium if, when displaced and released, it returns to its original position. Neutral equilibrium means a body retains its displaced position, while unstable equilibrium means displacement increases after release. The center of buoyancy is the centroid of the submerged volume, and its interaction with the center of gravity determines a body's attitude in the water.
The slam induced loads on two-dimensional bodies have been studied by applying an explicit
finite element code which is based on a multi-material arbitrary Lagrangian-Eulerian
formulation and penalty coupling method. This work focuses on the assessment of total
vertical slamming force, pressure distributions at different time instances and pressure
histories on the wetted surfaces of typical rigid bodies. Meanwhile, the simulation technique
involved in the two-dimensional slamming problem is discussed through related parameter
study.
This study developed a stage-discharge rating curve for Beaver Creek in Springfield, Ohio using field measurements and modeling. Twelve discharge measurements were taken between June and November 2011 using acoustic Doppler velocity meters. A stable cross-section 65 feet wide was used. Step-backwater modeling extrapolated the rating curve to 5000 cubic feet per second and produced water surface and velocity profiles. The rating curve allows future changes in land use and climate to be modeled more accurately.
EAGES Proceedings - S. AUBIN & J. MONCHAUXStephan Aubin
1) The document discusses easy experimental methods for studying ground effects, including using a moving belt wind tunnel system to simulate the movement of the ground.
2) It presents a case study on the Mercedes CLK-GTR race car where a 1:10 scale model was tested in wind tunnel to understand flow under the car and ground clearances.
3) Key findings included that downforce increases with lower ground clearance up to a point where the boundary layer blocks the underbody flow, and that side skirts and rear wings help increase downforce by preventing crossflows and increasing underbody velocity.
The document summarizes a study on hydraulic modeling of a side-channel spillway at Iven Dam in Mongolia. The goals were to determine flow regimes using physical and numerical modeling, study hydraulic modeling methodology, and identify ways to improve standard design methods. Hydraulic modeling methods used included analytical fluid dynamics, experimental fluid dynamics with a physical model, and computational fluid dynamics. Results from physical and CFD models showed significant differences from the standard design method, indicating the need to update standard methods. The study concluded the spillway capacity should be increased and validated all hydraulic structures with physical and numerical models before construction.
This document discusses the generation and propagation of underwater pressure waves from the water entry of wedge-shaped bodies. It uses a modified 2D acoustic wave equation to model the propagation of pressure waves initiated by the impact pressure during water entry. The impact pressure regions on the wedge are treated as acoustic sources, and the finite difference method is used to numerically solve the wave equation. Results are compared for symmetric and asymmetric wedge entries, and reflections from boundaries are considered for shallow water entries. Understanding the propagation of underwater pressure waves is important for applications like hydrodynamic evaluation of marine vehicles.
Chapter 3 static forces on surfaces [compatibility mode]imshahbaz
1) The document discusses forces on submerged surfaces due to static fluids, including calculating hydrostatic pressures and determining the resultant force and center of pressure.
2) It provides methods for calculating the resultant force on plane and curved surfaces, including using pressure diagrams which graphically represent pressure changes with depth.
3) Examples are given for determining pressures, resultant forces, and centers of pressure on surfaces like vertical walls and combinations of liquids in tanks.
This document describes a three-tiered process used by the California Department of Water Resources to qualitatively assess erosion risk on urban levee waterside slopes. Tier 1 assesses levee geometry, fetch length, and historical performance. Tier 2 evaluates the levee's resistance to velocity and wave shear stress through field analysis. Tier 3 further analyzes risk factors to categorize sites as high, medium, or low risk. The process compares levee geometry to standards, considers historical erosion data, and estimates flow velocities and wave shear stresses to determine if the levee material can withstand erosive forces. Sites that fail tests in early tiers proceed to more detailed analysis in later tiers to determine their erosion risk potential.
The document discusses fluid mechanics concepts covered in lecture 4 of MET 212. It covers pressure variation in fluids at rest, including how pressure remains constant along a line and is affected by height. Pressure measurement using gauges and absolute pressure is explained. Mechanical pressure measuring devices are also introduced. Finally, the document discusses hydrostatic force on plane surfaces, including the pressure on tank bottoms and sides and how to calculate the resultant force and centroid of irregular shapes.
The document summarizes research analyzing the geomorphology and landscape evolution of the western Pontides region in northern Turkey using quantitative morphometric analysis. The study aims to better understand the neotectonic activity and structural development of the region. Morphometric parameters were calculated from DEM data to analyze drainage basins, stream networks, terrain profiles, and identify potential tectonic features. Preliminary results show differentiation of drainage basin evolution across the study area and will be refined through additional morphometric analysis and ASTER data interpretation.
FIELD AND THEORETICAL ANALYSIS OF ACCELERATED SETTLEMENT USING VERTICAL DRAINS ijiert bestjournal
This document discusses accelerated settlement of soft soils using vertical drains. It provides background on consolidation theories proposed by Terzaghi and Biot. It also reviews literature on three-dimensional consolidation analysis and the use of vertical drains to reduce drainage paths and accelerate settlement. Case studies evaluating methods to determine field-to-laboratory coefficients of consolidation are presented. The ratio of field to lab coefficients of consolidation has been found to range widely from 15 to 55 depending on site-specific soil properties and drainage conditions.
Floodplain Mapping for Design Professionals_RIFMA2016RI_FMA
This document provides an overview of floodplain mapping processes for riverine and coastal studies. It discusses how FEMA identifies and funds mapping studies, the typical study timeline and products. For riverine studies, it describes the level of detail for different flood zones and the methodology for approximate zone A mapping using hydrology, cross sections and HEC-RAS modeling. For coastal studies, it reviews the history of guidelines and methodology, components of a flood insurance study, and how to interpret risk-based and wave-inclusive special flood hazard areas on flood maps. Contact information is also provided.
1. The document discusses hydrostatic forces on submerged surfaces including horizontal, vertical, and inclined planes as well as curved surfaces.
2. Key concepts include calculating hydrostatic force based on pressure, depth, and surface area. The center of pressure is also introduced, which is where the total hydrostatic force acts rather than at the geometric centroid.
3. Example problems are provided to calculate hydrostatic forces, center of pressure locations, and buoyancy forces on various submerged objects.
Diversion Systems and Spillways (22 Nov 2013)Todd Lewis
The document discusses water management and design concepts for diversion systems and spillways. It covers key probability terms used to quantify flood risk such as annual exceedance probability (AEP), average recurrence interval (ARI), and risk. It also outlines the modular application of hydrology and hydraulics in conveyance design. For hydrology, it describes methods to estimate runoff such as peak flow equations and routing models. For hydraulics, it discusses designing typical diversions and modeling more advanced systems using software. The document concludes by outlining spillway design considerations including inlet hydraulics, chute conveyance, and outlet energy dissipation.
Khosla's theory improved upon Bligh's theory of seepage under hydraulic structures in several ways. Khosla recognized that seepage follows elliptical streamlines rather than the bottom contour as Bligh assumed. Khosla also introduced the important concept of exit gradient and specified that the exit gradient must be less than the critical value to prevent soil particles from being dislodged. While more complex, Khosla's theory provides a more accurate representation of seepage flow compared to Bligh's assumption of linear head loss.
Forces acting on submerged surfaces include hydrostatic forces. Hydrostatic forces form a pressure prism on plane surfaces with a base equal to the surface area and a length equal to the varying pressure. The hydrostatic force passes through the centroid of this pressure prism. For curved surfaces like circles, the hydrostatic force always passes through the center. Hydrostatic forces can be determined on multilayered fluids by considering each fluid-surface interface separately. Examples are given for forces on submerged rectangular and circular plates.
Dr. Douglas Smith presents an overview of his program, Flow Interactions and Control, at the AFOSR 2013 Spring Review. At this review, Program Officers from AFOSR Technical Divisions will present briefings that highlight basic research programs beneficial to the Air Force.
This experiment aims to determine the hydrostatic force and center of pressure on a partially submerged vertical surface. The student measures the dimensions of a quadrant apparatus and records water heights as it is filled. As water is added, equilibrium is reached when the hydrostatic force balances a hanging weight, locating the center of pressure. Calculations using the measured dimensions and recorded water heights are then made to theoretically determine the hydrostatic force and center of pressure, and compared to the experimental results.
This document reports on an experiment conducted to determine hydrostatic force and center of pressure. The objectives were to determine the hydrostatic force on a partially or fully submerged surface and to determine experimentally and theoretically the center of pressure. The method involved increasing water depth in a tank and reaching equilibrium between moments on a balance arm, with forces from a weight and hydrostatic force on a vertical surface. Results from increasing water depth in 5 increments are presented in a table.
This document discusses fluid static forces and hydrostatic pressure. It begins by explaining that in a fluid at rest, pressure acts equally in all directions and where a fluid contacts a surface, the pressure gives rise to a force perpendicular to the surface. It also discusses how pressure increases with depth according to ρgh. The document then examines hydrostatic forces on various plane and curved surfaces, explaining how to calculate the magnitude and direction of forces on surfaces like inclined planes, vertical walls, and curved boundaries. It provides equations for calculating forces and locating centers of pressure on submerged objects.
This document provides a 3-paragraph summary of a course on hydraulics:
The course is titled "Hydraulics II" with course number CEng2152. It is a 5 ECTS credit degree program course focusing on open channel flow. Open channel flow occurs when water flows with a free surface exposed to the atmosphere, such as in rivers, culverts and spillways. Engineering structures for open channel flow are designed and analyzed using open channel hydraulics.
The document covers different types of open channel flow including steady and unsteady, uniform and non-uniform flow. It also discusses the geometric elements of open channel cross-sections including depth, width, area and hydraulic radius. Uniform flow
1) The document discusses fluid static forces including hydrostatic forces on plane, inclined, vertical, and curved surfaces. It provides equations to calculate the magnitude and direction of forces.
2) The direction of force is not always through the center of gravity. On inclined surfaces, the center of pressure lies below the centroid. On curved surfaces, the resultant force passes through the center of curvature.
3) Examples are given for calculating hydrostatic forces on dams, walls, gates, and other structures exposed to fluid pressures. Diagrams illustrate free body diagrams and problem setups.
1) The document discusses fluid static forces on plane and curved surfaces including the magnitude and direction of forces, and the location of the center of pressure.
2) Hydrostatic forces are calculated based on pressure distributions and properties of the surface area and fluid properties like density.
3) The center of pressure is found by calculating the first moment of area of the pressure distribution and does not necessarily coincide with the geometric center.
This presentation discusses the center of pressure in hydrostatic systems. It is introduced by Sumaiya Tabassum from the Department of Civil Engineering at Stamford University Bangladesh. The presentation is supervised by six individuals and presented by two others. The document defines the center of pressure as the point where the total sum of a pressure field acts on a body, causing an equivalent force. It then describes the experimental apparatus and procedures for determining the center of pressure of partially and fully submerged surfaces. Major equations are provided relating the center of pressure to factors like density, depth, and mass. Practical applications are mentioned in aircraft aerodynamics and stability.
ER Publication,
IJETR, IJMCTR,
Journals,
International Journals,
High Impact Journals,
Monthly Journal,
Good quality Journals,
Research,
Research Papers,
Research Article,
Free Journals, Open access Journals,
erpublication.org,
Engineering Journal,
Science Journals,
This document describes an experiment conducted to determine the center of pressure of a partially or fully submerged rectangular surface. A group of 10 students performed the experiment using an apparatus that measures the forces when water is added or removed. The procedure involves finding the equilibrium point by adjusting a movable weight with the surface at varying angles and water levels. Calculations are shown to relate the center of pressure location to the measured dimensions and forces. Practical applications of center of pressure in aircraft and missile aerodynamics are briefly mentioned.
This document describes an experiment measuring center of pressure and hydrostatic force using a hydrostatic pressure system. Known masses were added to one end of the apparatus and water was added until the arm balanced, recording the water height. This process was repeated for partially and fully submerged surfaces. For partially submerged surfaces, center of pressure decreased linearly with water height while hydrostatic force increased as a power function. For fully submerged surfaces, center of pressure decreased as a power function of water height and hydrostatic force increased linearly. The experiment confirmed theoretical relationships between these variables and the water height.
This document discusses the forces acting on gravity dams and their environmental impacts. It outlines various forces like water pressure, weight of the dam, uplift pressure, earthquake pressure, and wave pressure. It also explains how these forces are calculated. Regarding failure, it notes dams can fail through overturning, sliding, compression, or tension. The document concludes by covering environmental impacts of dam construction like pollution, and impacts of reservoirs like habitat destruction and sedimentation.
Buoyancy and flotation _ forces on immersed bodyR A Shah
Buoyancy
Buoyancy and Hydro static Forces on immersed bodies
Stability of Floating and Submerged Bodies
Meta-centre
Meta-centric height
Forces on Areas –Horizontal, Inclined and Vertical,
Centre of Pressure, Forces on Curved Surfaces,
Examples
This document provides a training package on hydrostatic forces on plane surfaces for students in the Environmental Engineering Department. It includes an overview of the topic, objectives, examples, and pre-test and post-test questions. The key ideas covered are how hydrostatic forces form a system of parallel forces on submerged surfaces, how to calculate the magnitude and location of these forces on vertical, inclined, and curved surfaces, and examples demonstrating these calculations.
The document discusses hydrostatic forces on submerged plane surfaces. It provides analytical and graphical (prism) methods to calculate the total hydrostatic force and location of the center of pressure. As an example, it applies both methods to calculate the force on a submerged car door located 8 meters below the water surface. The analytical method yields a force of 101.24 kN and center of pressure at 0.144 meters above the bottom of the door. The prism method gives a force of 176.94 kN and center of pressure at 2.1 meters above the bottom.
Design analysis & comparsion of intze type water tank for different wind ...eSAT Journals
Abstract Any design of Water Tanks is subjected to Dead Load + Live Load and Wind Load or Seismic Load as per IS codes of Practices. Most of the times tanks are designed for Wind Forces and not even checked for Earthquake Load assuming that the tanks will be safe under seismic forces once designed for wind forces. In this study Wind Forces and Seismic Forces acting on an Intze Type Water tank for Indian conditions are studied. The effect of wind on the elevated structures is of prime importance as Wind flows relative to the surface of ground and generates loads on the structures standing on ground. Most of the designers consider the wind effect and neglect the seismic effect on the structure. The Indian Standard Code IS 875(Part-3) 2003 and IS 1893-2000 for Wind & Seismic effect is used in this study. The Elevated Structure is designed for various Wind forces i.e. 39 m/s, 44 m/s, 47 m/s & 50 m/s and the same is cross checked with different Seismic Zones i.e. Zone-II, Zone-III, Zone-IV, & Zone-V by ‘Response Spectrum Method’ and the maximum governing condition from both the forces is further used for design & analysis of staging. It is found from the analysis that the Total load, Total moments and Reinforcement in staging i.e. Columns, Braces & also for Raft foundation varies for Case-1, Case-2, Case-3 & Case-4. Key Words: Wind Load, Seismic Load, Intze Tank, and I.S.Codes etc…
1. The document discusses hydrostatic pressure, including how pressure increases linearly with depth in static fluids and how to calculate hydrostatic pressure.
2. An experiment is described to determine the center of pressure on a submerged plane using a balance and measuring water levels and weights. Theoretical calculations of center of pressure are shown for total and partial immersion.
3. Procedures are provided for conducting the experiment, collecting data on water levels and weights, and comparing results to theoretical values to analyze differences.
This document discusses the hydraulic design of the main diversion structure of a barrage. It covers sub-surface flow considerations like seepage pressure, exit gradient, and uplift forces. It also discusses surface flow conditions during floods when barrage gates are open. Analytical solutions and graphs are provided to calculate seepage pressures and exit gradient. Corrections are also described to account for factors like floor thickness, slope, and interference between sheet piles. Surface flow hydraulics involve operating barrage gates to pass floods while maintaining the pool water level.
This document provides an overview of forces acting on concrete gravity dams and how to compute them. The key forces discussed are:
1. Weight of the dam which provides stability. Other forces include water pressure, uplift pressure, silt pressure, wave pressure, and earthquake forces.
2. Water pressure acts both vertically and horizontally on dam faces based on reservoir level and geometry. Uplift pressure acts upwards through pores and needs to be estimated.
3. Earthquake forces cause random vibrations that impart accelerations and stresses in the dam. The document provides guidelines for computing seismic forces based on dam height and location.
Similar to Fluid_Mechanics_Lab_Manual_Acc_TU_Syllab (1).pdf (20)
Guia Diseño Desarenadorres y Sedimentadores OPS.pdfHectorMayolNovoa
Este documento presenta lineamientos para el diseño de desarenadores y sedimentadores en sistemas de abastecimiento de agua rural. Explica consideraciones generales como el pretratamiento, variables que afectan la sedimentación, información necesaria para el diseño e incluye alternativas de pretratamiento. También cubre el diseño de desarenadores y sedimentadores convencionales y laminares, incluyendo sus componentes y criterios de diseño. Finalmente, presenta ejemplos aplicativos para el diseño de ambas unidades.
Este documento presenta el cálculo y diseño estructural de un desarenador para un acueducto en el municipio de Sabanalarga, Casanare. Incluye la introducción, materiales, secciones, cargas, análisis y diseño estructural usando el programa SAP2000. Los resultados muestran la cuantía de refuerzo requerida para los muros y placas.
Este documento presenta los cálculos hidráulicos para diseñar un sistema de riego que incluye un desarenador. Calcula la velocidad de sedimentación, la velocidad de flujo, la profundidad, el ancho y la longitud del desarenador. También calcula la longitud de transición, la longitud del vertedero, las dimensiones de la compuerta de lavado y las dimensiones finales del desarenador.
El documento presenta el diseño de una bocatoma y un desarenador para el sector Ichiqiuato. Se calculan los parámetros hidráulicos del canal de entrada y salida al desarenador. Luego se dimensiona la sección del desarenador con un ancho de 2.16m y área de 4.23m2. La longitud requerida es de 10.8m. Finalmente, se diseña un vertedero con una cota de 1095.82msnm para descargar el caudal de 0.601m3/seg después de sedimentación.
Yunus A. Cengel, Robert H. Turner, John M. Cimbala - Solution manual to Funda...HectorMayolNovoa
This document describes a new type of battery that uses lithium metal and a solid electrolyte. It has higher energy density than traditional lithium-ion batteries, meaning it can store more energy in a smaller space. The solid electrolyte is key as it prevents the growth of dendrites, needle-like structures that can cause shorts, while also being non-flammable. Initial tests show the battery maintaining over 95% capacity after 500 charge-discharge cycles. This new design could enable longer battery life in various devices.
66.-Merle C. Potter, David C. Wiggert, Bassem H. Ramadan - Mechanics of Fluid...HectorMayolNovoa
This document contains solutions to problems in a textbook on mechanics of fluids. It has 14 chapters that cover topics like fluid statics, fluids in motion, integral and differential forms of fundamental laws, dimensional analysis, internal and external flows, compressible flow, open channel flow, piping systems, and turbomachinery. Each chapter contains problems and their step-by-step solutions to aid instructors and students.
Este documento presenta los resultados del Balance Hídrico Integrado y Dinámico realizado en El Salvador en 2005. Incluye información sobre el marco conceptual del balance hídrico, la metodología utilizada, y los resultados del análisis de precipitación, evapotranspiración, escorrentía y calidad del agua. Los resultados muestran la evaluación de los recursos hídricos por región hidrográfica y a nivel nacional, además de un análisis de la calidad del agua en seis regiones principales
La cuenca hidrográfica es un área que captura el agua de precipitación y hace que se unan los escurrimientos hacia un único punto de salida, como un río o lago. Las cuencas contienen divisoria de aguas, ríos principales, afluentes y varios tipos de relieve, y cumplen funciones importantes como el almacenamiento de agua. Algunas de las cuencas más grandes del mundo incluyen las cuencas del Congo, Nilo, Misisipi, Río de la Plata y Orinoco.
Este documento presenta un libro sobre recursos hidráulicos escrito por Arturo Rocha Felices. El libro consta de siete capítulos que abordan temas como la oferta y demanda de agua, proyectos hidráulicos, avenidas e inundaciones, y recursos hídricos compartidos internacionalmente. El autor tiene amplia experiencia en proyectos hidráulicos y ha sido profesor universitario. El documento incluye prólogos del autor y del presidente del Capítulo de Ingeniería Civil que publica el libro.
Este documento presenta un curso sobre cómo realizar metrados de obras en edificaciones utilizando Microsoft Excel. Explica que el metrado es un documento importante en el expediente técnico de una obra y consiste en medir los materiales y trabajos requeridos. Detalla conceptos teóricos como la finalidad del metrado, que es calcular los costos de la obra. También presenta la metodología, incluyendo dividir la obra en etapas y medir con exactitud utilizando fórmulas y planos.
El documento presenta un temario sobre metrados en edificaciones. Se divide en 4 temas principales: metrado de estructuras, metrado de arquitectura, metrado de instalaciones sanitarias y definiciones y recomendaciones generales para metrados. Cada tema incluye información sobre la creación de partidas, memoria de cálculo de partidas y planilla de metrados.
Este documento presenta los conceptos básicos sobre metrados en edificaciones. Explica que el metrado es parte importante del expediente técnico y sirve para calcular con precisión los insumos necesarios como materiales, herramientas y mano de obra. Luego detalla las unidades de medida y conceptos comunes que se metran como cimientos, vigas, losas, columnas, entre otros. El objetivo es establecer criterios actualizados para cuantificar partidas en presupuestos de obras de edificación.
El documento presenta información sobre metrados en edificaciones. Explica que los metrados son el proceso de medición de longitudes, áreas y volúmenes de las estructuras de un proyecto para cuantificar las cantidades de obra a ejecutar. Los metrados buscan establecer el costo y determinar los insumos necesarios para la ejecución. Pueden realizarse en obra o en planos y deben seguir un proceso ordenado y sistemático.
El documento describe los pasos para realizar un análisis de consistencia de información hidrológica. Estos incluyen: 1) Análisis visual gráfico de las series de tiempo para identificar posibles saltos o tendencias; 2) Análisis doble masa para determinar períodos confiables y dudosos; 3) Análisis estadístico de saltos en la media y desviación estándar entre períodos, y corrección de datos si es necesario. El objetivo es identificar y eliminar errores sistemáticos para obtener series
Este documento presenta una guía actualizada para el desarrollo de pequeñas centrales hidroeléctricas. Explica que la guía cubre todos los aspectos necesarios para el desarrollo de un proyecto hidroeléctrico, desde la evaluación del recurso hídrico hasta los procedimientos de obtención de permisos. Además, reconoce las contribuciones de varios organismos e individuos en la actualización de la guía original publicada en 1998. Finalmente, el documento introduce brevemente el contenido de los nueve capí
Este documento trata sobre el diseño de canales abiertos. Explica las ecuaciones fundamentales del flujo uniforme y no uniforme en canales, así como los métodos para determinar el calado normal, diseñar canales de contorno rígido y erosionable, y analizar diferentes formas de la superficie libre. Incluye secciones sobre flujo uniforme, flujo no uniforme, problemas de aplicación y referencias bibliográficas. El autor busca compartir sus conocimientos sobre diseño de obras hidráulicas para el transporte de agua
ACEP Magazine edition 4th launched on 05.06.2024Rahul
This document provides information about the third edition of the magazine "Sthapatya" published by the Association of Civil Engineers (Practicing) Aurangabad. It includes messages from current and past presidents of ACEP, memories and photos from past ACEP events, information on life time achievement awards given by ACEP, and a technical article on concrete maintenance, repairs and strengthening. The document highlights activities of ACEP and provides a technical educational article for members.
DEEP LEARNING FOR SMART GRID INTRUSION DETECTION: A HYBRID CNN-LSTM-BASED MODELgerogepatton
As digital technology becomes more deeply embedded in power systems, protecting the communication
networks of Smart Grids (SG) has emerged as a critical concern. Distributed Network Protocol 3 (DNP3)
represents a multi-tiered application layer protocol extensively utilized in Supervisory Control and Data
Acquisition (SCADA)-based smart grids to facilitate real-time data gathering and control functionalities.
Robust Intrusion Detection Systems (IDS) are necessary for early threat detection and mitigation because
of the interconnection of these networks, which makes them vulnerable to a variety of cyberattacks. To
solve this issue, this paper develops a hybrid Deep Learning (DL) model specifically designed for intrusion
detection in smart grids. The proposed approach is a combination of the Convolutional Neural Network
(CNN) and the Long-Short-Term Memory algorithms (LSTM). We employed a recent intrusion detection
dataset (DNP3), which focuses on unauthorized commands and Denial of Service (DoS) cyberattacks, to
train and test our model. The results of our experiments show that our CNN-LSTM method is much better
at finding smart grid intrusions than other deep learning algorithms used for classification. In addition,
our proposed approach improves accuracy, precision, recall, and F1 score, achieving a high detection
accuracy rate of 99.50%.
CHINA’S GEO-ECONOMIC OUTREACH IN CENTRAL ASIAN COUNTRIES AND FUTURE PROSPECTjpsjournal1
The rivalry between prominent international actors for dominance over Central Asia's hydrocarbon
reserves and the ancient silk trade route, along with China's diplomatic endeavours in the area, has been
referred to as the "New Great Game." This research centres on the power struggle, considering
geopolitical, geostrategic, and geoeconomic variables. Topics including trade, political hegemony, oil
politics, and conventional and nontraditional security are all explored and explained by the researcher.
Using Mackinder's Heartland, Spykman Rimland, and Hegemonic Stability theories, examines China's role
in Central Asia. This study adheres to the empirical epistemological method and has taken care of
objectivity. This study analyze primary and secondary research documents critically to elaborate role of
china’s geo economic outreach in central Asian countries and its future prospect. China is thriving in trade,
pipeline politics, and winning states, according to this study, thanks to important instruments like the
Shanghai Cooperation Organisation and the Belt and Road Economic Initiative. According to this study,
China is seeing significant success in commerce, pipeline politics, and gaining influence on other
governments. This success may be attributed to the effective utilisation of key tools such as the Shanghai
Cooperation Organisation and the Belt and Road Economic Initiative.
TIME DIVISION MULTIPLEXING TECHNIQUE FOR COMMUNICATION SYSTEMHODECEDSIET
Time Division Multiplexing (TDM) is a method of transmitting multiple signals over a single communication channel by dividing the signal into many segments, each having a very short duration of time. These time slots are then allocated to different data streams, allowing multiple signals to share the same transmission medium efficiently. TDM is widely used in telecommunications and data communication systems.
### How TDM Works
1. **Time Slots Allocation**: The core principle of TDM is to assign distinct time slots to each signal. During each time slot, the respective signal is transmitted, and then the process repeats cyclically. For example, if there are four signals to be transmitted, the TDM cycle will divide time into four slots, each assigned to one signal.
2. **Synchronization**: Synchronization is crucial in TDM systems to ensure that the signals are correctly aligned with their respective time slots. Both the transmitter and receiver must be synchronized to avoid any overlap or loss of data. This synchronization is typically maintained by a clock signal that ensures time slots are accurately aligned.
3. **Frame Structure**: TDM data is organized into frames, where each frame consists of a set of time slots. Each frame is repeated at regular intervals, ensuring continuous transmission of data streams. The frame structure helps in managing the data streams and maintaining the synchronization between the transmitter and receiver.
4. **Multiplexer and Demultiplexer**: At the transmitting end, a multiplexer combines multiple input signals into a single composite signal by assigning each signal to a specific time slot. At the receiving end, a demultiplexer separates the composite signal back into individual signals based on their respective time slots.
### Types of TDM
1. **Synchronous TDM**: In synchronous TDM, time slots are pre-assigned to each signal, regardless of whether the signal has data to transmit or not. This can lead to inefficiencies if some time slots remain empty due to the absence of data.
2. **Asynchronous TDM (or Statistical TDM)**: Asynchronous TDM addresses the inefficiencies of synchronous TDM by allocating time slots dynamically based on the presence of data. Time slots are assigned only when there is data to transmit, which optimizes the use of the communication channel.
### Applications of TDM
- **Telecommunications**: TDM is extensively used in telecommunication systems, such as in T1 and E1 lines, where multiple telephone calls are transmitted over a single line by assigning each call to a specific time slot.
- **Digital Audio and Video Broadcasting**: TDM is used in broadcasting systems to transmit multiple audio or video streams over a single channel, ensuring efficient use of bandwidth.
- **Computer Networks**: TDM is used in network protocols and systems to manage the transmission of data from multiple sources over a single network medium.
### Advantages of TDM
- **Efficient Use of Bandwidth**: TDM all
Optimizing Gradle Builds - Gradle DPE Tour Berlin 2024Sinan KOZAK
Sinan from the Delivery Hero mobile infrastructure engineering team shares a deep dive into performance acceleration with Gradle build cache optimizations. Sinan shares their journey into solving complex build-cache problems that affect Gradle builds. By understanding the challenges and solutions found in our journey, we aim to demonstrate the possibilities for faster builds. The case study reveals how overlapping outputs and cache misconfigurations led to significant increases in build times, especially as the project scaled up with numerous modules using Paparazzi tests. The journey from diagnosing to defeating cache issues offers invaluable lessons on maintaining cache integrity without sacrificing functionality.
Advanced control scheme of doubly fed induction generator for wind turbine us...IJECEIAES
This paper describes a speed control device for generating electrical energy on an electricity network based on the doubly fed induction generator (DFIG) used for wind power conversion systems. At first, a double-fed induction generator model was constructed. A control law is formulated to govern the flow of energy between the stator of a DFIG and the energy network using three types of controllers: proportional integral (PI), sliding mode controller (SMC) and second order sliding mode controller (SOSMC). Their different results in terms of power reference tracking, reaction to unexpected speed fluctuations, sensitivity to perturbations, and resilience against machine parameter alterations are compared. MATLAB/Simulink was used to conduct the simulations for the preceding study. Multiple simulations have shown very satisfying results, and the investigations demonstrate the efficacy and power-enhancing capabilities of the suggested control system.
2. Kathmandu Engineering Collage
(Affiliated to Tribhuvan University)
Department of Civil Engineering
Kalimati, Kathmandu,Nepal
Lab on Fluid Mechanics
CIVIL - II/I
Prepared By:
Senior Lr./Er. Saraswati Thapa
Lr. /Er. Tirtha Raj Karki
January 27, 2016
3. Prepared by: Er. /Sl. Saraswati Thapa and Er./ Lr. Tirtha Raj Karki Lecturer, Dept. of Civil Engineering, KEC, Kalimati Page 1
Contents
EXPERIMENT NO: 1 HYDROSTATIC FORCE ON A SUBMERGED SURFACE ..............................2
EXPERIMENT NO: 2 DETERMINATION OF META-CENTRIC HEIGHT OF FLOATING BODY ...7
EXPERIMENT NO: 3 VERIFICATION OF BERNOULLI'S THEOREM............................................12
EXPERIMENT NO: 4 IMPACT OF JET..............................................................................................16
EXPERIMENT NO: 6 FLOW OVER BROAD-CRESTED WEIR.......................................................20
4. Prepared by: Er. /Sl. Saraswati Thapa and Er./ Lr. Tirtha Raj Karki Lecturer, Dept. of Civil Engineering, KEC, Kalimati Page 2
EXPERIMENT NO: 1
HYDROSTATIC FORCE ON A SUBMERGED SURFACE
OBJECTIVE:
The purpose of this experiment is to experimentally locate the center of pressure of a vertical submerged
surface. The experimental measurement is compared with a theoretical prediction.
APPARATUS REQUIRED:
Figure 1 is a sketch of the device used to measure the center of pressure on a submerged vertical surface.
It consists of an annular sector of solid material attached to a balance beam. When the device is properly
balanced the face of the sector that is not attached to the beam is directly below (coplanar) with the pivot
axis. The solid sector and the balance beam are supported above a tank of water.
Figure1: Apparatus for measuring the center of pressure
y
yR
D
CG
CP
Balancing Beam
Balance adjustment
5. Prepared by: Er. /Sl. Saraswati Thapa and Er./ Lr. Tirtha Raj Karki Lecturer, Dept. of Civil Engineering, KEC, Kalimati Page 3
THEORY:
Hydrostatic Pressure on Partially submerged body (P) = ƿgh, where, h = y/β and hydrostatic force acting
on the vertical face of the annular sector is
F = P x A = ƿgh x yb
Center of pressure, yR of the hydrostatic force is
Figure: 2 Diagram of partially submerged vertical face Figure: 3 Diagram of fully submerged
vertical face of annular sector
Figure 3 shows the submerged surface viewed from the left side of the tank in Figure 1. The
depth of the centroid below the surface of the water is h. Center of pressure, yR, is
yR h…………(i)
= ………… (ii)
From equation (i) and (ii)
yR = + h
yR = + h
where, Ixc is the moment of inertia of the surface about the x-axis, and A is the surface area.
The location of the center of pressure can be measured using the apparatus sketched in Figure 1. The
counterweight is adjusted so that the beam is horizontal when there is no water in the tank and no weight
in the pan. When the tank is filled with water the unbalanced hydrostatic force causes the beam to tilt.
Adding weight W to the pan at a distance L from the pivot O exerts a moment WL that counterbalances
the resultant moment due to the hydrostatic forces on the quarter-annulus-shaped body ABPQ. When the
water level is as shown in the figure, there are hydrostatic forces on surfaces AB, BS and AT. Since BS
and AT are concentric cylindrical surfaces with the common axis passing through O, the hydrostatic
forces on BS and AT do not exert any moment about O. As a result WL is equal to the moment due to the
hydrostatic force F acting on the vertical plane surface AB. In this experiment the force F is not measured.
Instead the theoretical value F = ghA is assumed, where h is the depth of the centroid of the surface of
water. The moment due to F is measured and the theoretical value of F is used to compute the location of
the center of pressure.
Balancing the moments about O gives
6. Prepared by: Er. /Sl. Saraswati Thapa and Er./ Lr. Tirtha Raj Karki Lecturer, Dept. of Civil Engineering, KEC, Kalimati Page 4
WL = F (H + yR), where H = (D – y)
Substituting F =ρghA, where A = bd and solving for yR yields
yR = - H
PRACTICAL RELEVANCE:
We can clear about the hydrostatic force acting on the water retaining structure, like: dam, gate,
submerged structure etc.
PROCEDURE:
1. Arrangement of the apparatus is placed on the level surface or table.
2. Measure the dimension of the vertical face (Breadth, b and Depth, d) of annular sector. Similarly
measured vertical height of that object from pivot level to the bottom edge (D) and also measure the
moment arm (L) from pivot to the loaded point.
3. With the apparatus empty, the plane face was made vertical and a preliminary balance was made by
using the empty mass banger and the adjustable screw at the end. In the balanced condition, the
beam has placed in the horizontal position.
4. Now, water is poured into the tank due to the rise of water level which acts hydrostatic force on the
vertical face of the object and the beam was tilted.
5. At this stage, masses were added in the mass arm until balance was restored y and m were
measured.
6. Additional masses were put on the mass arm and water was carefully added or removed to restore
balance.
7. This procedure was repeated for 10 more readings.
OBSERVATION AND CALCULATION:
Moment arm, L =
Breadth of plane face, b =
Depth of plane face, d =
Vertical height of annular sector from pivot to the bottom edge of the vertical plane, D =
Distance between bottom edge of plane below water surface, y
No. of observations Depth of water (y) cm Mass (m) grams
1
2
3
4
5
6
7
8
9
10
11
7. Prepared by: Er. /Sl. Saraswati Thapa and Er./ Lr. Tirtha Raj Karki Lecturer, Dept. of Civil Engineering, KEC, Kalimati Page 5
12
13
14
15
16
17
18
19
20
S.N
Mass
(m)
kg
Depth of
Immersion
(y) from
Waterline
m
Depth
of
water
level to
the
CG(h)
m
Hydro
static
pressu
re(P)
Pa
Hydro
static
Force
(F)
N
C of
P(Z)
From
Water
line
(m)
Th.
Distance
form pivot
to water
surface (H)
m
Moment
(M),
Nm
C of
P(Z)
From
Water
line
(m)
Exp.
Error
% of
C of
P(Z),
Th.&
Exp.
1
2
3
4
5
6
7
8
9
10
11
12
13
14
15
16
17
18
19
20
8. Prepared by: Er./Lr. Saraswati Thapa and Er./ Lr. Tirtha Raj Karki Lecturer, Dept. of Civil Engineering, KEC, Kalimati Page 6
Hydrostatic Pressure on Partially submerged body (P) = ƿgh, since, h = y/β
Hydrostatic Pressure on Fully submerged body (P) = ƿgh, since, h = (y - d/2)
Hydrostatic Force or Pressure force on partially submerged body (F) = ƿgy2
b/2
Hydrostatic Force or Pressure force on Submerged body (F) = ƿgh*bd
Centre of pressure in partially submerged body (Z) = , theoretically.
Centre of pressure in submerged body (Z) = + h, theoretically.
Where, y- Depth of free level water to the bottom edge of vertical plane
h- Depth of free level water to the CG of vertical plane (For Fully Submerged)
h = (y - d/2)
Distance from the pivot to the free water level, (H) = D-y
Moment due to load added to balance the beam with respect to pivot (hinge), (M) = WL= (mg) L
Centre of pressure from water level (Z) = - H, experimentally
RESULT:
CONCLUSION AND DISCUSSION:
9. Prepared by: Er./Lr. Saraswati Thapa and Er./ Lr. Tirtha Raj Karki Lecturer, Dept. of Civil Engineering, KEC, Kalimati Page 7
EXPERIMENT NO: 2
DETERMINATION OF META-CENTRIC HEIGHT OF FLOATING BODY
OBJECTIVE:
To experimentally determine the metacentric heights of Floating body with different conditions of
loadings and compare them with the values computed by theoretical (Analytical methods) formulas.
APPARATUS REQUIRED:
The experimental setup consists of a water tank for floating the experimental boat. The boat is provided
with a weight on a central mast. The position of C.G. can be located by means of a knife edge assembly.
The size of boat can be measured by a ruler.
Figure:Boat Figure:Water Tank with Boat
Figure: Boat L-Section (Dimension in cm)
10. Prepared by: Er./Lr. Saraswati Thapa and Er./ Lr. Tirtha Raj Karki Lecturer, Dept. of Civil Engineering, KEC, Kalimati Page 8
THEORY:
The determination of metacentric height is important while investigating the stability of the floating
bodies such as ships, during the design phase by theoretical computations and after the ship have been
built by inclining experiments.
(a). Analytical method
An object with water line AC, B as the Centre of
Buoyancy(CB) and G as the Centre of Gravity in
original position. When the vessel is tilted
through a small angle θ, the CB changes from B
to B’, the position of water line changes to ED
and two wedges AOE and COD are formed. M
is the metacenter, W is the weight of object and
FB is the buoyant force.
Where, I- Moment of inertia of plan of object
=
L-Length of boat
B-Width of boat
V- Immersed volume of object OR
Displaced volume of water
Where, w1- weight of boat
w- Weight of applied load
Then, GM = BM – BG
– BG
Where, GM- Metacentric height
M
(b).Experimental method
The metacentric height GM
of a floating object is
determined by equating the
moment due to the shifting of
a small lateral weight and the
moment created due to the
shifting of the position of the
combined center of gravity of
the pontoon and the lateral
weight.
M X
P
a) Equilibrium condition b) Tilted condition
GM = ……………………. (i)
Where, GM = Metacentric Height
w = lateral weight
θ
G
G � G’
θ
FB =W
G
B B’
O
C
D
A
E
11. Prepared by: Er./Lr. Saraswati Thapa and Er./ Lr. Tirtha Raj Karki Lecturer, Dept. of Civil Engineering, KEC, Kalimati Page 9
X = lateral displacement
W = combined weight of pontoon plus lateral weight
= angle of tilt for displacement x
L= length of boat
B= Width of boat
PRACTICAL RELEVANCE:
This experiment clears that the metacentre of floating body always lies above the centre of gravity to
regain in the original position. And the inclination of floating body in water surface should be limited
angle for its stability.
PROCEDURE:
1. Record the exact dimensions (width, length, and height) of the boat with the help of ruler.
2. Fill the tank 2/3 with clean water and ensure that no foreign particles are there.
3. Weight the boat model to find w1 .
4. Float the ship model in water and ensure that it is stable equilibrium.
5. Apply the known weight (w) at the centre of model.
6. Give the model a small angular displacement in clockwise or anti-clockwise direction by moving
the applied weight small distance away from centre either right or left side.
7. Measure the distance moved by the weight applied with the help of scale.
8. Repeat the experiment for different weights.
OBSERVATIONS & CALCULATIOS:
OBSERVATIONS:
Weight of boat, w1 = ……….. gm
S. No. Lateral weight, w(gm)
Left or Right
X(cm)
1
2
3
4
5
6
7
8
9
10
11
12
13
14
15
16
12. Prepared by: Er./Lr. Saraswati Thapa and Er./ Lr. Tirtha Raj Karki Lecturer, Dept. of Civil Engineering, KEC, Kalimati Page 10
CALCULATION:
Weight of boat (w1) =
Moment of Inertia of plan of object, (I) =
Distance between centre of Gravity and Buoyancy of boat (BG) =
Density of water (ρwater) =
Specific weight of water ( water) =
Combined Weight, (W) = (w1 + w) =
Experimental Method Analytical Method
S.
No.
Lateral
weight,
w(kg)
Combined
Weight,
W(kg)
Distance X
(cm)
Average
Tilt()
degree
Meta-centric
Height
(GM),(cm)
Immersed
Volume
(V),(cm3
)
Meta-
centric
Height
(GM),(cm)
1
2
3
4
5
6
7
8
9
10
and
so
on
13. Prepared by: Er./Lr. Saraswati Thapa and Er./ Lr. Tirtha Raj Karki Lecturer, Dept. of Civil Engineering, KEC, Kalimati Page 11
RESULT:
CONCLUSION AND DISCUSSION:
14. Prepared by: Er./Lr. Saraswati Thapa and Er./ Lr. Tirtha Raj Karki Lecturer, Dept. of Civil Engineering, KEC, Kalimati Page 12
EXPERIMENT NO: 3
VERIFICATION OF BERNOULLI'S THEOREM
OBJECTIVE:
To verify the Bernoulli’s theorem.
APPARATUS REQUIRED:
A supply tank of water, a set of different diameters pipe fitted with manometer tube at two points,
discharge measuring tank, scale, and stop watch.
THEORY:
Bernoulli’s theorem states that when there is a continues connection between the particle of
flowing mass liquid, the total energy of any sector of flow will remain same provided there is no
reduction or addition at any point.
Formula Used:-
H1 = Z1 + p1/ɤ + V1
2/2g
H2 = Z2 + p2/ɤ + V2
2/2g
Where, H1= H2 = total energy head
Z1 + p1/ɤ + V1
2/2g = Z2 + p2/ɤ + V2
2/2g + HL
Where, HL= Total Head Loss (=hf)
hf=frictional head loss neglecting minor losses
For Given Instrument set up
Z1=Z2
V1
2
/2g = V2
2
/2g, (If flow through constant diameter pipe)
p1/ɤ -p2/ɤ = HL
PROCEDURE:
1. Open the inlet valve slowly and allow the water to flow from the supply tank.
2. Now adjust the flow to get a constant head in the supply tank to make flow in and out flow equal.
3. Note down the quantity of water collected in the measuring tank for a given interval of time.
4. Compute the area of cross-section connected to the manometer.
5. Change the inlet and outlet supply and note the reading.
6. Take at least three readings as described in the above steps.
15. Prepared by: Er./Lr. Saraswati Thapa and Er./ Lr. Tirtha Raj Karki Lecturer, Dept. of Civil Engineering, KEC, Kalimati Page 13
PRACTICAL RELEVANCE:
It helps to illustrate the importance and usefulness of Bernoulli’s equation for real fluids including energy
losses. The validity of total of energy losses proposed and the expanded Bernoulli’s equation.
OBSERVATION AND CALCULATION:
Discharge calculation
Width of tank, B=
Length of Tank, L=
Area of Tank, A =B*L=………… (cm2
)
For First Pipe of Diameter, D1=
Initial
Heighth,H1(cm)
Final
Height,H2(cm)
Time Interval
(T)sec
Height
Difference
H=H2-H1(cm)
Volume=
A*H (cm3
)
Discharge
Q=
V/T(cm3
/sec)
Manometer Reading (p1/ɤ -p2/ɤ)
Pipe Diameter ,D1= (p1/ɤ -p2/ɤ)= HL Remarks
Q1=
Q2=
Q3=
Q4=
Q5=
For Second Pipe of Diameter, D2=
Initial
Heighth,H1(cm)
Final
Height,H2(cm)
Time Interval
(T)sec
Height
Difference
H=H2-H1(cm)
Volume=
A*H (cm3
)
Discharge
Q=
V/T(cm3
/sec)
Manometer Reading (p1/ɤ -p2/ɤ)
Pipe Diameter ,D2= (p1/ɤ -p2/ɤ)= HL Remarks
Q1=
Q2=
16. Prepared by: Er./Lr. Saraswati Thapa and Er./ Lr. Tirtha Raj Karki Lecturer, Dept. of Civil Engineering, KEC, Kalimati Page 14
Q3=
Q4=
Q5=
For Third Pipe of Diameter, D3=
Initial
Heighth,H1(cm)
Final
Height,H2(cm)
Time Interval
(T)sec
Height
Difference
H=H2-H1(cm)
Volume=
A*H (cm3
)
Discharge
Q=
V/T(cm3
/sec)
Manometer Reading (p1/ɤ -p2/ɤ)
Pipe Diameter ,D3 = (p1/ɤ -p2/ɤ)= HL Remarks
Q1=
Q2=
Q3=
Q4=
Q5=
17. Prepared by: Er./Lr. Saraswati Thapa and Er./ Lr. Tirtha Raj Karki Lecturer, Dept. of Civil Engineering, KEC, Kalimati Page 15
RESULT:
CONCLUSION AND DISCUSSION:
18. Prepared by: Er./Lr. Saraswati Thapa and Er./ Lr. Tirtha Raj Karki Lecturer, Dept. of Civil Engineering, KEC, Kalimati Page 16
EXPERIMENT NO: 4
IMPACT OF JET
OBJECTIVE:
To determine the coefficient of impact for vanes (flat and curved) and compare with theoretical value.
APPARATUS REQUIRED:
Collecting tank, transparent cylinder, nozzle of diameter 10 mm and vane of different shape (flat and
curved)
THEORY:
Momentum equation is based on Newton’s second law of motion which states that the algebraic sum of
external forces applied to control volume of fluid in any direction is equal to the rate of change of
momentum in that direction. The external forces include the component of the weight of the fluid & of
the forces exerted externally upon the boundary surface of the control volume.
If a vertical water jet moving with velocity is made to strike a target, which is free to move in the
vertical direction then a force will be exerted on the target by the and impact of jet, according to
momentum equation this force (which is also equal to the force required to bring back the target in its
original position) must be equal to the rate of change of momentum of the jet flow in that direction.
Figure1: Impact of jet on curve plate axis vertical
Balancing Weight
1. Nozzle
2. Direction of Velocity before impact
3. Direction of Velocity after impact
4. CV- curve vane
19. Prepared by: Er./Lr. Saraswati Thapa and Er./ Lr. Tirtha Raj Karki Lecturer, Dept. of Civil Engineering, KEC, Kalimati Page 17
Figure 2: Illustrative figure of impact of jet apparatus
Formula Used:-
F'=ρ Q V (1-cos )
F'=ρ QV (1-cos ) , as v=Q/a
Where F' =force (calculated)
ρ = density of water
=angle of difference vane
V =velocity of jet angle
Q =discharge
A =area of nozzle (πd2/4)
(i) For flat vane =90o
F' = ρ QV= ρ Q2/a
(ii) For hemispherical vane =180o
F' = βρ QV= 2 ρ Q2/a
F = Force (due to putting of weight)
For % error = (F- F')/ F'x10
20. Prepared by: Er./Lr. Saraswati Thapa and Er./ Lr. Tirtha Raj Karki Lecturer, Dept. of Civil Engineering, KEC, Kalimati Page 18
PROCEDURE:
1. Note down the relevant dimension or area of collecting tank, dia of nozzle, and density of water.
2. Install any type of vane i.e. flat or curved.
3. Install any size of nozzle i.e. 10mm or 12mm dia.
4. Note down the position of upper disk, when jet is not running.
5 Note down the reading of height of water in the collecting tank.
6. As the jet strike the vane, position of upper disk is changed, note the reading in the
scale to which vane is raised.
7. Put the weight of various values one by one to bring the vane to its initial position.
8. At this position finds out the discharge also.
9. The procedure is repeated for each value of flow rate by reducing the water supply.
10. This procedure can be repeated for different type of vanes and nozzle.
PRACTICAL RELEVANCE:
It helps to illustrate the momentum principle used to convert the rate of change of momentum into force.
And also help to understand the concept of electricity energy is generation through hydropower.
OBSERVATION AND CALCULATION:
Dia of nozzle = 10mm
Mass density of water ρ = 1000kg/mβ
Area of collecting tank =
Area of nozzle =
Horizontal flat vane
When jet is not running, position of upper disk is at =
S.N.
Discharge measurement Balancing Theoretical Force
F'=
ρ Q2
/a (dyne)
Error in %
= (F-F')/F'
Initial
(cm)
Final
(cm)
Time
(sec)
Discharge
(cm3/sec) Q
Mass,
W (gm)
Force
F (dyne)
1.
2.
3.
4.
5.
Curved hemispherical vane
When jet is not running, position of upper disk is at =
S.N.
Discharge measurement Balancing Theoretical Force
F'= βρQ2
/a (dyne)
Error in %
= (F-F')/F'
Initial
(cm)
Final
(cm)
Time
(sec)
Discharge
(cm3/sec) Q
Mass W
(gm)
Force
F (dyne)
1.
2.
3.
4.
5.
21. Prepared by: Er./Lr. Saraswati Thapa and Er./ Lr. Tirtha Raj Karki Lecturer, Dept. of Civil Engineering, KEC, Kalimati Page 19
RESULT:
CONCLUSION AND DISCUSSION:
22. Prepared by: Er./Lr. Saraswati Thapa and Er./ Lr. Tirtha Raj Karki Lecturer, Dept. of Civil Engineering, KEC, Kalimati Page 20
EXPERIMENT NO: 6
FLOW OVER BROAD-CRESTED WEIR
OBJECTIVE:
To determine the coefficient of discharge of broad- crested weir
APPARATUS REQUIRED:
Arrangement for finding the coefficient of discharge inclusive of supply tank, collecting tank, pointer
gauge, scale & different type of notches
THEORY:
A broad-crested weir is a weir with a crest, which is sufficiently wide to prevent the jet from
springing clear at the upstream corner. There are many different profiles in use; in the present case
we consider a simple rectangular block with a rounded upstream corner, placed in a horizontal
channel with unrestricted flow downstream. The acceleration of the water as it flows on to the weir
crest causes a reduction in surface level. Along the crest, the fall in level continues (to an extent
determined by the weir height and breadth in relation to the water depth in the channel) until it drops
over the downstream corner. There is a region of re circulating flow behind the drop, as indicated in
Figure (a), before the flow settles down to more or less uniform conditions some distance
downstream of the weir.
Flow over the broad-crested weir is shown in Figure (a). For the purpose of a simple analysis, the
conditions illustrated in Figure (b) are assumed. The motion is taken to have uniform velocity Vi
in the approaching stream, and to flow at uniform depth y and uniform velocity V along the crest.
(a) General characteristics of flow
(b) Idealized conditions assumed in analysis
23. Prepared by: Er./Lr. Saraswati Thapa and Er./ Lr. Tirtha Raj Karki Lecturer, Dept. of Civil Engineering, KEC, Kalimati Page 21
(c) Flow over the broad-crested weir
Let H = height of water above crest, L = Length of crest, h =height of water at the middle of weir which is
constant, v = velocity of flow over weir
Applying Bernoulli’s equation to the still water surface on the upstream side and running water at the end
of the weir
Z1 = Z2, V1 = 0, , V2 = v Substituting these values
then √
Discharge over weir = Cd x Area of flow x velocity
√ √
Finding maximum discharge
Q will be maximum if is maximum
It gives
Substituting the value of h,
Formula Used: For Broad crested weir
Where,
Q = Discharge
H =Height above crest level
L = Width of weir
v
h
H
24. Prepared by: Er./Lr. Saraswati Thapa and Er./ Lr. Tirtha Raj Karki Lecturer, Dept. of Civil Engineering, KEC, Kalimati Page 22
PRACTICAL RELEVANCE:
The weir can be used for flow measurement using a single measurement of upstream water height the
from the weir crest level (H).
PROCEDURE:
1. Set the channel slope to horizontal.
2. Measure and record the height of the weir using calipers.
3. Set the broad-crested weir carefully in position such that center of the weir will be at a station
approximately 2 m from upstream of the channel.
4. Before starting the experiment observe the general characteristics of the water surface profile,
which may be produced in the flume by steadily changing the discharge using the control valve.
5. Measure and record the discharge by using gravimetric tank.
6. Measure and record the upstream depth yc at 20 cm from the middle of the broad crested weir.
7. Measure and record the critical depth yc at the center of the broad crested weir.
8. Change the discharge and repeat the steps 5-7 for seven more times for different discharges.
OBSERVATIONS AND CALCULATION:
For Discharge computation
Breath of tank, B t = 0. 6 m
Length of tank, L t = 0.6 m
Area of tank A = L t*B t= 0.36 m2
Height of water above the broad crested weir is, H
Width of Rectangular weir, L = 0.33m
Weir height, d = 0.115 m
S.N.
For Discharge Computation
Q=V/t
(m3/se
c)
Static
head
above
weir ,h
Total
Head
above
crest
level, H
(2/3)H
Initial
height of
tank, a
(cm)
Final
height of
tank, b
(cm)
Differenc
e In
height=b-
a (cm)
Volume
V= A*(b-
a) *10-4
m3
Time of
flow, t
Cd = H/d h/d
1.
2.
3.
4.
5.
25. Prepared by: Er./Lr. Saraswati Thapa and Er./ Lr. Tirtha Raj Karki Lecturer, Dept. of Civil Engineering, KEC, Kalimati Page 23
RESULT:
Plot the graph
a) H and h vs Q,
b) H/d and h/d vs Cd
CONCLUSION AND DISCUSSION:
(Discussion: How the discharge coefficient changes with increasing upstream depth and flow discharge.
Based on head to weir depth ratio vs. discharge coefficient plot how does the importance of the velocity
head on discharge coefficient calculation changes as the ratio of head to weir height h/d increases.
The value of the coefficient of discharge, Cd, which relates discharge Q to static head, h has been found
to exceed unity.)
View publication stats