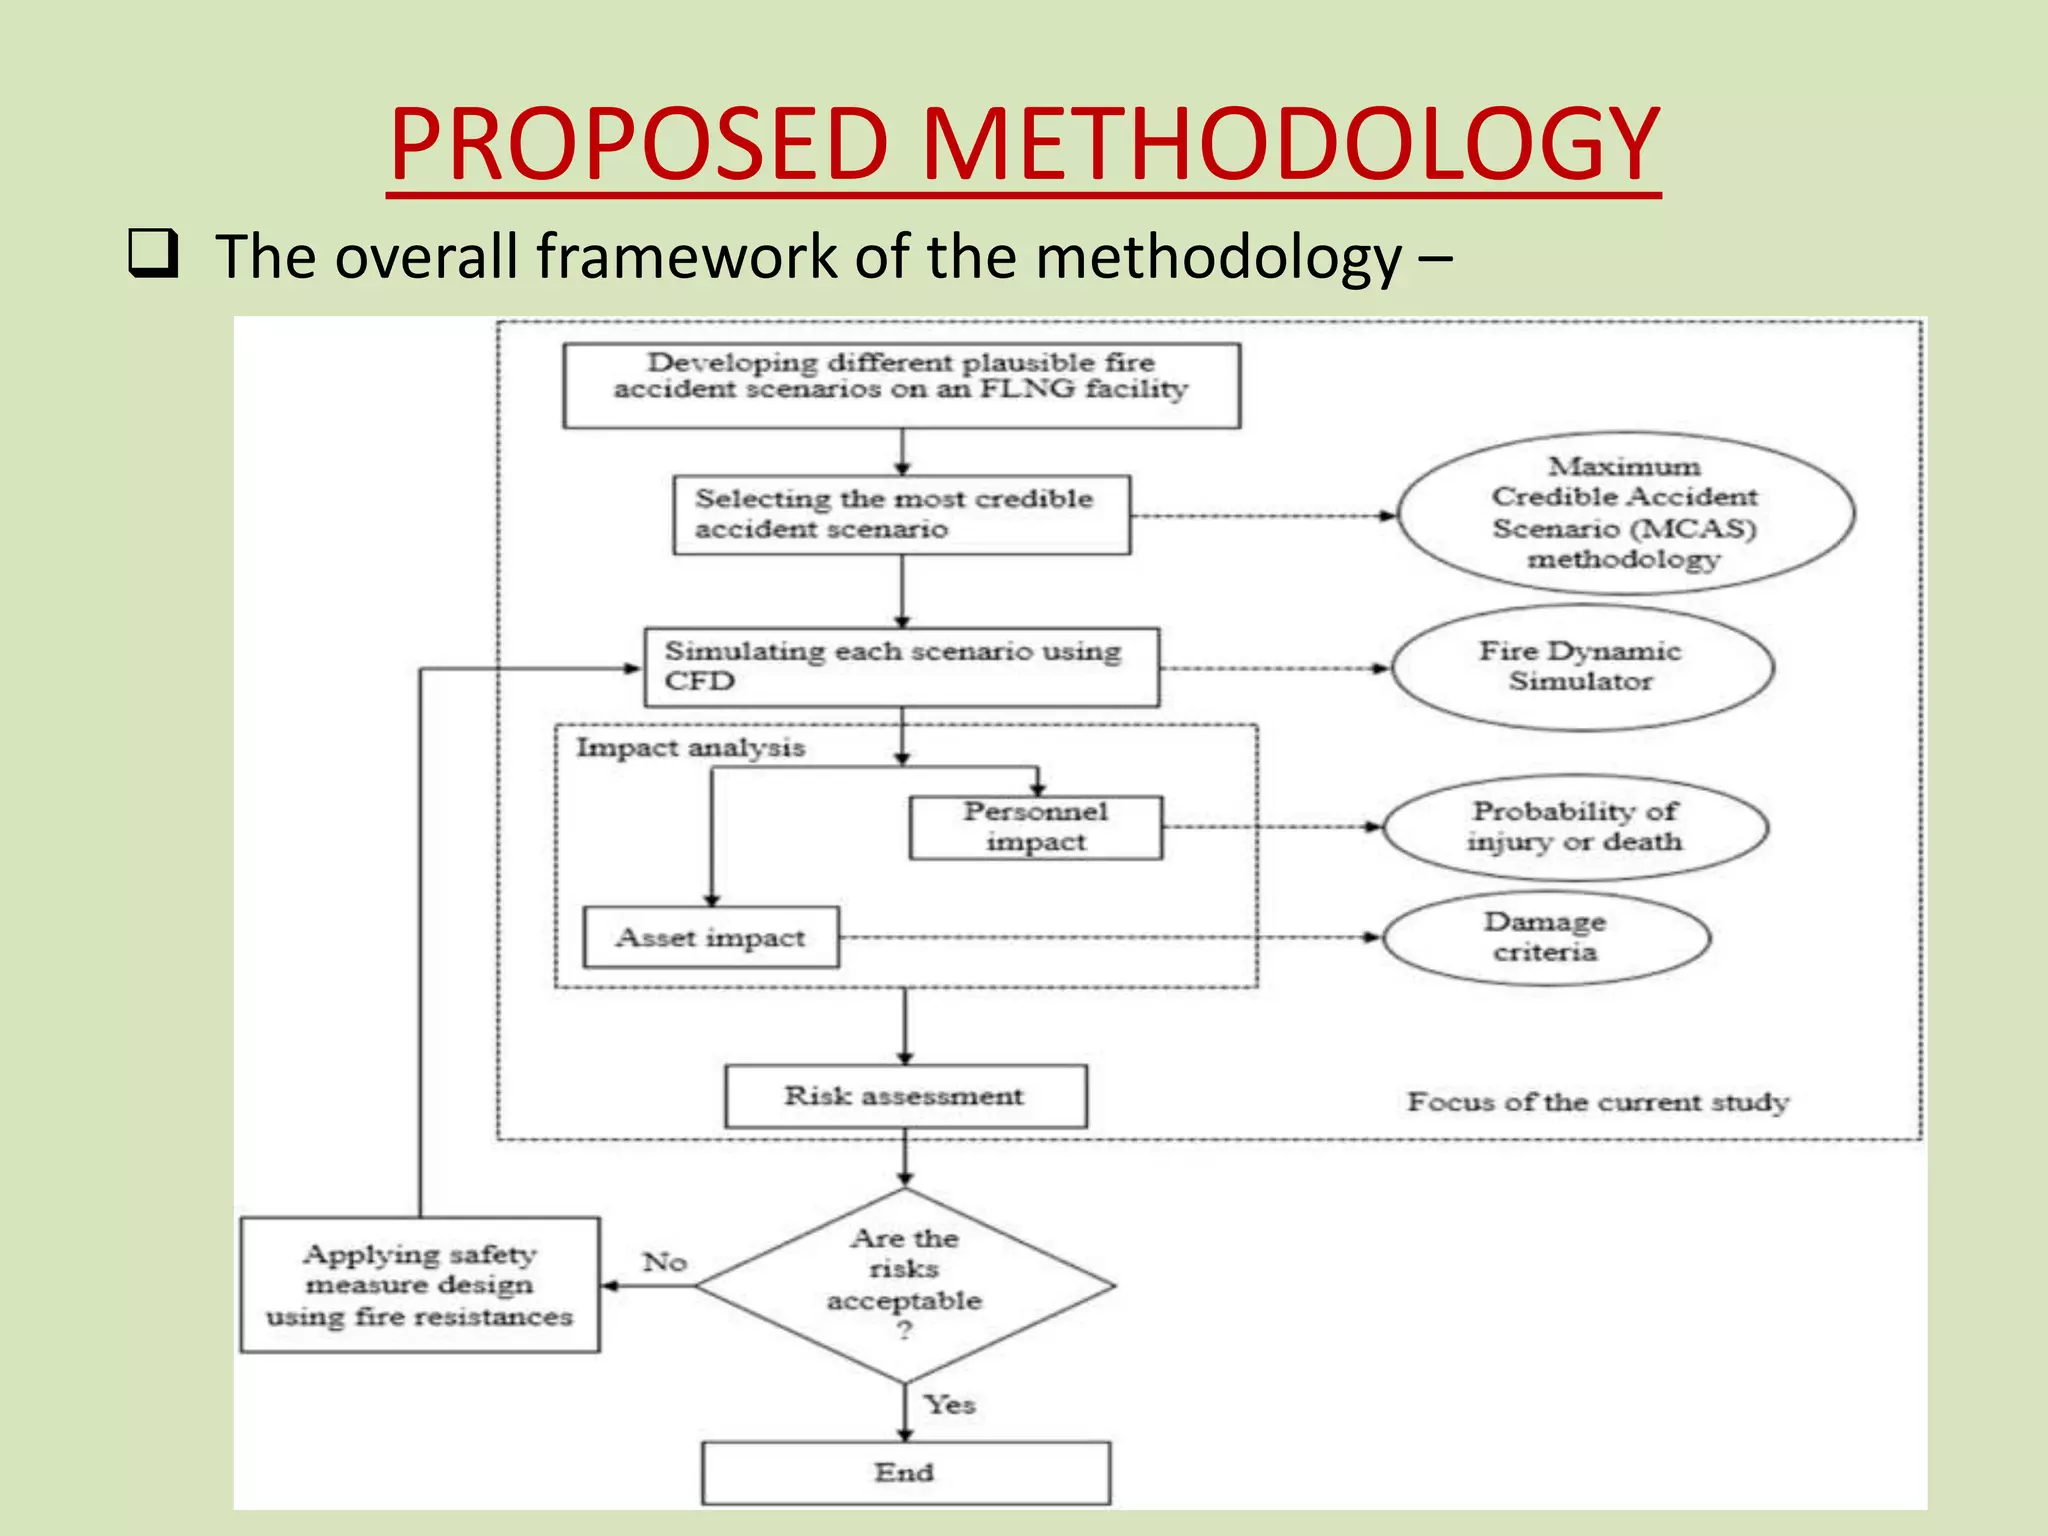
SEMINAR
Fire Impact Assessment in FLNG
Processing Facilities using
Computational
Fluid Dynamics (CFD)
Presented By-
ADITYA PRAKASH
1
CONTENTS
 INTRODUCTION
 PROPOSED METHODOLOGY
 APPLICATION OF THE METHODOLOGY
 RESULTS AND DISCUSSION
 RISK ASSESSMENT
 CONCLUSION
2
INTRODUCTION
 Process facilities are usually equipped with diverse
equipment, control systems and operating procedures.
 Any process deviations from normal operating conditions,
due to:
 errors in the interaction of equipment,
 human factor,
 management and organizational issues make process plants
susceptible to process failures and or accidents.
 After analysing previous major accidents, many lessons were
learnt and safety regulations and designs have been
upgraded.
3
Continue…
 Fires account for 59.5% of the accidents in process industries.
 Need for an efficient means for combating potential fire
accidents.
 Accident modelling relates the causes and effects of events
that lead to accidents is required.
 Accident modelling supports:
a) gathering relevant data
b) creating realistic scenarios of the accident sequence
c) summarizing the gathered data into meaningful information
4
Continue..
 Various models are available, namely :
 Semi-empirical models
 Integral models
 Zone models
 CFD models.
 Analytical models do not represent real condition.
 CFD model is recognized as one of the most powerful tools.
 CFD also helps to visualize effects of the system under various
conditions at different time intervals.
5
6
What is FLNG?
 Floating Liquefied Natural Gas
 Emerging technology which is foreseen to be one of the most
promising technologies for exploiting remote and stranded
offshore gas fields.
 FLNG concept is obtained from a mixture of
• land-based LNG
• offshore oil and gas
• marine transport industries.
Function:-
 In FLNG processing facilities, natural gas is treated, processed,
liquefied, stored and offloaded to LNG carriers in the form of
LNG.
7
ADVANTAGE:-
 Economic
 Environmental advantage due to its distant offshore location
 Better security
DISADVANTAGE:-
 Compact layouts leads to difficulty in:
 emergency evacuation & rescue,
 potential risks to assets and on-board personnel
 Hazardous properties of LNG adds more risk due to its:
cryogenic temperature, flammability and vapour dispersion
 Lack of past experiences or references.
8
PROPOSED METHODOLOGY
 The overall framework of the methodology –
9
Steps in Proposed Methodology:
Step 1:
 Developing various credible fire accident scenarios in an FLNG
facility.
 In an offshore processing facility such as an LNG FPSO,
unfavourable events that may escalate to loss of containment
are:
 Gas leak from feed gas & LNG tank rollover
 Vapour, liquid leak from LNG cold box area & jetty line failure
 Gas or liquid leak from refrigeration circuits
 External fire in refrigeration circuits
 Leak from LNG tank & loading arm connection failure
 Liquid spill from LNG tank
10
 Risks involved are:
 Flash fire, pool fire or jet fire
 VCE or BLEVE
Step 2:
 Identify More credible fire accident scenarios considering
inherent hazards existing in each scenario.
 Various methodologies available for hazard index calculation:
 Dow fire and explosion index.
 Mond fire, explosion and toxicity index.
 Mortality index.
 Hazard Identification and Ranking System (HIRA).
11
 The MCAS methodology incorporates two studies:
i. Probable damage caused by an accident
ii. Probability of occurrence.
 A more damaging and frequently occurring accident will have
higher credibility.
Step 3:
 CFD simulation of the most credible accident scenarios is
performed.
 CFD model is effective to analyse complicated accident scenarios.
 FDS uses Navier-Stokes equations.
 Effects of thermal loads and temperature on surrounding is
analysed.
12
 FDS has the capability of simulating :
 Fire and smoke development
 Thermal flow predictions and
 Concentrations of toxic substances released during the fire
Step 4:
 The effects of the fire event are assessed on:
1. Fire impact on humans:
• At different locations, probabilities of having first degree burn,
second degree burn and death are calculated using Equations
where, D= thermal dose
c₁ and c₂ are probit coefficients
13
14
2. Fire impact on assets:
• Based on thermal loads and adiabatic surface temperature.
• Heat load transfer takes place by the combination of
radiation and convection.
• Fires cause structural failure mainly by reducing strength due to
heat and thermal stresses.
• Equipment damage occurs at the heat flux of 37.5 kW/m2 and
the minimum heat intensity for ignition and melting of plastic is
12.5 kW/m2.
• At higher temperatures, the yield strength and the modulus of
elasticity of the steel decrease and the rate of creep increases
significantly. 15
• The maximum yield strength and the modulus of elasticity at any
elevated temperatures are:
16
• Materials used in the process industries lose their 40% of their
strength at temperatures higher than 670 K (396.85 C)
• Lose 80-90% of their strength at temperatures higher than 850 K
(576.85 C).
17
Step 5:
 In order to estimate the severity of risk, the probabilities of first
degree burn, second degree burn and death are assigned with risk
scores (Si)
18
APPLICATION OF THE METHODOLOGY
 Scenario Development:
• Scenarios are developed on the basis of inherent hazards.
19
 Selection of the MCAS:
 Credibility values greater than 0.5 are considered as the MCAS.
 The three most credible fire accident scenarios in decreasing
order of their credibility are as follows;
1. LNG spill due to overfilling or leakage of the tank and forms a
pool with immediate ignition.
2. LNG liquid leak under pressure from a pipe in Mixed Refrigerant
(MR) Module of the liquefaction process, forms a pool and
ignites immediately.
3. Treated two phase hydrocarbon is released under pressure
from a valve and immediate ignition occurs with a pool fire. This
occurs in the PMR module 1.
20
RESULTS AND DISCUSSION
 Asset Impact:
• Heat flux contour of 37.6 KW/m² in scenarios 1, 2 and 3.
21
• Adiabatic surface temperature contour higher than 538 C in
scenarios 1, 2 and 3.
• Storage Area 1 contains LNG is more likely to undergo BLEVE.
22
 Personnel impact:
• Probabilities of human impacts against distance of receptor from
the flame surface in the three scenarios.
23
• Comparison of fire risk to personnel in (a) scenario 1, (b) scenario 2
and (c) scenario 3.
24
• This suggests that the scenario 2 may cause more severe
consequences to both assets and personnel than other considered
scenarios.
25
RISK ASSESSMENT
• Thermal radiation contours are converted into corresponding
risk contours using risk scores.
• Range of these values varies from 1 at the furthest distance
from the fire location to the maximum value of 10 at the flame
surface.
• It is evident that higher risk is available in scenario 2.
• Contrary to the result of MCAS methodology, scenario 2 has
higher impact and risk level than that of scenario 1.
• Credibility assessment , BLEVE is considered.
• In CFD simulation BLEVE is Not considered.
26
CONCLUSION
 The above methodology can be applied for better
• safety measure design
• fire suppression systems
in order to mitigate or avoid the potential impact of
fire events.
27
28

Flng processing facility

  • 1.
    SEMINAR Fire Impact Assessmentin FLNG Processing Facilities using Computational Fluid Dynamics (CFD) Presented By- ADITYA PRAKASH 1
  • 2.
    CONTENTS  INTRODUCTION  PROPOSEDMETHODOLOGY  APPLICATION OF THE METHODOLOGY  RESULTS AND DISCUSSION  RISK ASSESSMENT  CONCLUSION 2
  • 3.
    INTRODUCTION  Process facilitiesare usually equipped with diverse equipment, control systems and operating procedures.  Any process deviations from normal operating conditions, due to:  errors in the interaction of equipment,  human factor,  management and organizational issues make process plants susceptible to process failures and or accidents.  After analysing previous major accidents, many lessons were learnt and safety regulations and designs have been upgraded. 3
  • 4.
    Continue…  Fires accountfor 59.5% of the accidents in process industries.  Need for an efficient means for combating potential fire accidents.  Accident modelling relates the causes and effects of events that lead to accidents is required.  Accident modelling supports: a) gathering relevant data b) creating realistic scenarios of the accident sequence c) summarizing the gathered data into meaningful information 4
  • 5.
    Continue..  Various modelsare available, namely :  Semi-empirical models  Integral models  Zone models  CFD models.  Analytical models do not represent real condition.  CFD model is recognized as one of the most powerful tools.  CFD also helps to visualize effects of the system under various conditions at different time intervals. 5
  • 6.
  • 7.
    What is FLNG? Floating Liquefied Natural Gas  Emerging technology which is foreseen to be one of the most promising technologies for exploiting remote and stranded offshore gas fields.  FLNG concept is obtained from a mixture of • land-based LNG • offshore oil and gas • marine transport industries. Function:-  In FLNG processing facilities, natural gas is treated, processed, liquefied, stored and offloaded to LNG carriers in the form of LNG. 7
  • 8.
    ADVANTAGE:-  Economic  Environmentaladvantage due to its distant offshore location  Better security DISADVANTAGE:-  Compact layouts leads to difficulty in:  emergency evacuation & rescue,  potential risks to assets and on-board personnel  Hazardous properties of LNG adds more risk due to its: cryogenic temperature, flammability and vapour dispersion  Lack of past experiences or references. 8
  • 9.
    PROPOSED METHODOLOGY  Theoverall framework of the methodology – 9
  • 10.
    Steps in ProposedMethodology: Step 1:  Developing various credible fire accident scenarios in an FLNG facility.  In an offshore processing facility such as an LNG FPSO, unfavourable events that may escalate to loss of containment are:  Gas leak from feed gas & LNG tank rollover  Vapour, liquid leak from LNG cold box area & jetty line failure  Gas or liquid leak from refrigeration circuits  External fire in refrigeration circuits  Leak from LNG tank & loading arm connection failure  Liquid spill from LNG tank 10
  • 11.
     Risks involvedare:  Flash fire, pool fire or jet fire  VCE or BLEVE Step 2:  Identify More credible fire accident scenarios considering inherent hazards existing in each scenario.  Various methodologies available for hazard index calculation:  Dow fire and explosion index.  Mond fire, explosion and toxicity index.  Mortality index.  Hazard Identification and Ranking System (HIRA). 11
  • 12.
     The MCASmethodology incorporates two studies: i. Probable damage caused by an accident ii. Probability of occurrence.  A more damaging and frequently occurring accident will have higher credibility. Step 3:  CFD simulation of the most credible accident scenarios is performed.  CFD model is effective to analyse complicated accident scenarios.  FDS uses Navier-Stokes equations.  Effects of thermal loads and temperature on surrounding is analysed. 12
  • 13.
     FDS hasthe capability of simulating :  Fire and smoke development  Thermal flow predictions and  Concentrations of toxic substances released during the fire Step 4:  The effects of the fire event are assessed on: 1. Fire impact on humans: • At different locations, probabilities of having first degree burn, second degree burn and death are calculated using Equations where, D= thermal dose c₁ and c₂ are probit coefficients 13
  • 14.
  • 15.
    2. Fire impacton assets: • Based on thermal loads and adiabatic surface temperature. • Heat load transfer takes place by the combination of radiation and convection. • Fires cause structural failure mainly by reducing strength due to heat and thermal stresses. • Equipment damage occurs at the heat flux of 37.5 kW/m2 and the minimum heat intensity for ignition and melting of plastic is 12.5 kW/m2. • At higher temperatures, the yield strength and the modulus of elasticity of the steel decrease and the rate of creep increases significantly. 15
  • 16.
    • The maximumyield strength and the modulus of elasticity at any elevated temperatures are: 16
  • 17.
    • Materials usedin the process industries lose their 40% of their strength at temperatures higher than 670 K (396.85 C) • Lose 80-90% of their strength at temperatures higher than 850 K (576.85 C). 17
  • 18.
    Step 5:  Inorder to estimate the severity of risk, the probabilities of first degree burn, second degree burn and death are assigned with risk scores (Si) 18
  • 19.
    APPLICATION OF THEMETHODOLOGY  Scenario Development: • Scenarios are developed on the basis of inherent hazards. 19
  • 20.
     Selection ofthe MCAS:  Credibility values greater than 0.5 are considered as the MCAS.  The three most credible fire accident scenarios in decreasing order of their credibility are as follows; 1. LNG spill due to overfilling or leakage of the tank and forms a pool with immediate ignition. 2. LNG liquid leak under pressure from a pipe in Mixed Refrigerant (MR) Module of the liquefaction process, forms a pool and ignites immediately. 3. Treated two phase hydrocarbon is released under pressure from a valve and immediate ignition occurs with a pool fire. This occurs in the PMR module 1. 20
  • 21.
    RESULTS AND DISCUSSION Asset Impact: • Heat flux contour of 37.6 KW/m² in scenarios 1, 2 and 3. 21
  • 22.
    • Adiabatic surfacetemperature contour higher than 538 C in scenarios 1, 2 and 3. • Storage Area 1 contains LNG is more likely to undergo BLEVE. 22
  • 23.
     Personnel impact: •Probabilities of human impacts against distance of receptor from the flame surface in the three scenarios. 23
  • 24.
    • Comparison offire risk to personnel in (a) scenario 1, (b) scenario 2 and (c) scenario 3. 24
  • 25.
    • This suggeststhat the scenario 2 may cause more severe consequences to both assets and personnel than other considered scenarios. 25
  • 26.
    RISK ASSESSMENT • Thermalradiation contours are converted into corresponding risk contours using risk scores. • Range of these values varies from 1 at the furthest distance from the fire location to the maximum value of 10 at the flame surface. • It is evident that higher risk is available in scenario 2. • Contrary to the result of MCAS methodology, scenario 2 has higher impact and risk level than that of scenario 1. • Credibility assessment , BLEVE is considered. • In CFD simulation BLEVE is Not considered. 26
  • 27.
    CONCLUSION  The abovemethodology can be applied for better • safety measure design • fire suppression systems in order to mitigate or avoid the potential impact of fire events. 27
  • 28.