Download to read offline


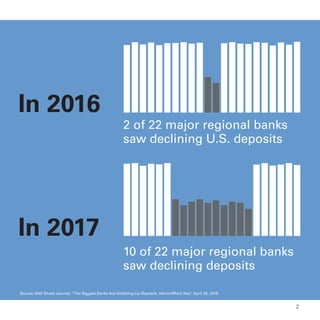
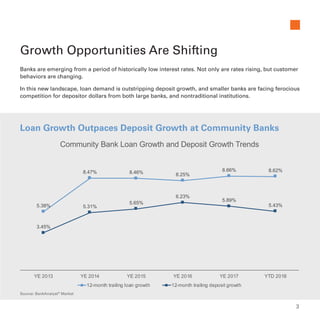
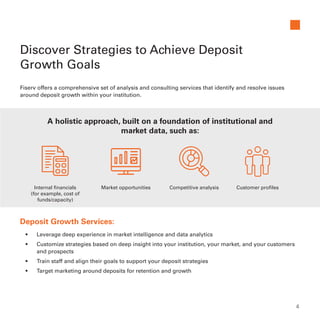


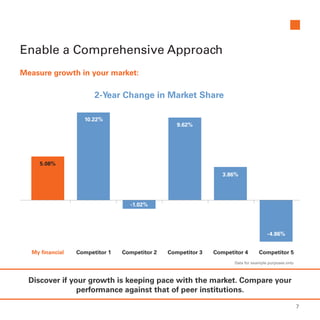


The document discusses the challenges regional banks face in deposit growth amidst rising loan demands and intense competition from larger banks and non-traditional institutions. It emphasizes the need for a comprehensive, data-driven approach to develop tailored deposit growth strategies that consider market conditions, customer insights, and competitive analysis. Additionally, it highlights the potential for banks to improve financial performance through better understanding of costs and targeted marketing efforts.


