State of the States: An Analysis of the 2015 Governors’ AddressesALEC
State of the States is an in-depth study of governors’ tax, budget and pension reform proposals. The report gives insight into which states proposed economic reform to protect taxpayers and which states took steps toward increasing state revenue. This report also features graphics that reveal regional trends in proposed reforms while also highlighting which states have a newly elected governor.
Progressive conservatives vs Liberal Government for Ontariopaul young cpa, cga
This presentation will look at 13+ years of governments led by Mike Harris (PC) as well as Liberals (Kathleen Wynne and Dalton McGuinty)
Ontario debt has double since 2003 and yet we have seen a deterioration in terms of the quality of services as well as the economy.
Federal Transfers to Provinces and Territories| Canada| Analysis and Commentarypaul young cpa, cga
- Equalization payments have long been a contentious issue between the federal government and provinces. Quebec is expected to receive over $13 billion in equalization payments for 2018-2019, an increase of almost $1.4 billion, while some provinces like Ontario pay more in taxes than they receive back in federal spending.
- Newfoundland and Labrador's finance minister has said the province's equalization deal from the federal government should be improved, as other provinces with smaller populations receive more. Quebec had a $2.2 billion surplus in 2015-2016 while receiving $10 billion in equalization that year.
- The old equalization formula will remain in place until 2024, frustrating provinces like New Brunswick who want changes
2019 Election| Equalization Payments| Canada| August 2019paul young cpa, cga
- The document provides facts about equalization payments in Canada. It notes that Quebec will receive $14 billion in equalization payments for 2018-2019, an increase of $1.4 billion, while Ontario will no longer receive payments. Alberta and other "have" provinces have criticized the unequal treatment and burden on their taxpayers to fund payments to other provinces. The bottom line is that the equalization agreement needs reform to bring more balance and fairness to revenue sharing across Canada.
The document summarizes the June 2019 Fiscal Monitor report published by the Government of Canada. It provides an overview and analysis of the government's fiscal performance for the period. It also discusses the Liberal government's spending increases in the lead up to the 2019 election campaign and analyzes budget commitments from the major political parties. The author concludes by encouraging readers to review additional government financial reports to better understand fiscal management in Canada.
Allot will be said about GDP as part of the election build in June 2018. The problem is major areas will not be discussed by Wynne as it would paint a picture that shows Wynne was poor steward of the Ontario Economy.
Economies are driven by many factors including capital investment and consumer spending. Government only role is to set policies. Wynne and McGuinty policies have led to implementation of carbon pricing, labor reforms, hikes to hydro rates, longer regulatory approval process for natural resources, killing of the east-west pipelines, etc.
Both McGuinty and Wynne continue to spend beyond their means in terms of their fiscal management cycle. The reality is businesses get scared when faced with more taxes and/or more regulations.
All party leaders are making promises as part of getting elected. The problem is that both Horwath and Wynne are being less than truthful as Ontario has a structural deficit of $11B.
Structural deficits do not go away overnight as decision have to be made including gap action plans.
It would be nice if Wynne and Horwath would discuss how they will restructured government instead pointing the finger at Ford.
Testimony: Mississippi Tax Policy: Options for ReformTax Foundation
This presentation accompanied testimony to the Mississippi Tax Policy Council about the state of Mississippi's tax code and the best options for reforming it.
Topics covered include an overview of Mississippi's tax system, tax rates and collections, state-local tax burdens, state business tax climate, previous state success stories, and suggestions for reform.
The presentation was given on September 1, 2016.
The document summarizes options for offsetting the costs of a carbon tax on low-income households. It finds that a carbon tax would disproportionately burden low-income households. It analyzes options like reducing income tax rates, providing rebates, increasing benefits like EITC, LIHEAP and SNAP. Each option targets low-income households to varying degrees and involves trade-offs between costs, ease of administration and economic impacts. A combination of approaches may be needed to minimize costs and protect the most vulnerable.
2019 Election| Federal Transfers to Province| Canada | August 2019paul young cpa, cga
This presentation provides the facts on federal transfers. The information in the presentation will help you make an informed decision when it comes the path forward when it comes to federal government transfers.
County Executive Budget Presentation on the FY 2019 Advertised Budget PlanFairfax County
The document discusses Fairfax County's proposed FY 2019 budget. It focuses on priorities like expanding county-school cooperation and incorporating strategic planning. It recommends a 2.5 cent real estate tax rate increase to 4.38% overall budget growth. This would fully fund school and county employee compensation increases. The budget forecasts continued economic and job growth for the county and region.
This document compares individual income taxes, corporate income taxes, sales taxes, and property taxes between Pennsylvania and Mississippi. For individual income taxes, Pennsylvania has a flat 3.07% rate while Mississippi has a graduated rate of 3-5%. Both states exempt certain items from sales tax, with Pennsylvania's rate at 6% and Mississippi's at 7%. Pennsylvania collects higher average property taxes than Mississippi. The document also notes certain tax laws and loopholes in each state and poses questions for discussion.
Fiscal councils and communications: the UK experience - Chris Giles, Financia...OECD Governance
The document discusses the establishment and impact of the UK's Office for Budget Responsibility (OBR), an independent fiscal watchdog. It notes that budget information was previously opaque, limited, and over-optimistic, but the OBR has removed known biases, increased trust in forecasts, and aided public understanding through examining forecast errors without shying from bad news. The OBR eased austerity measures and indirectly brought down a minister through its work. It has expanded the volume of fiscal outlook material but also led to more explanatory articles in the media on budgets and few damaging institutional stories.
This document provides an overview and analysis of Ontario's fiscal situation from an accounting perspective. It discusses the province's growing deficit and debt levels, issues with the healthcare, education and skills/training budgets, and criticisms of the Liberal government's management of finances and transparency. Specific areas of overspending and poor outcomes are highlighted, with links provided to auditor general reports, news articles, and other analyses supporting the arguments made.
The document analyzes the revenue and spending proposals of Ontario's three main political parties. It finds that the Progressive Conservatives plan to stimulate investment through corporate tax cuts and generate transit funding through interest income. The NDP aims to increase revenue from tax loopholes and higher corporate taxes to fund jobs credits and transit. The Liberals propose a new pension plan tax, gas tax, and corporate taxes to fund transit while limiting expense growth through public sector wage freezes.
Position paper domestic revenue mobilizationSalia Adamu
This paper is targets the Government revenue authorities and finding innovative ways of raising revenue through the informal sector workers. All the revenue agencies are intensifying more revenue collection through old tax collection methods. This is done usually through the easy ways of PAYE, VAT and corporate taxes collection. The informal sector worker which account for 70% of the workforce are the least targeted for taxation. In view of growing public expenditure and reduction in annual budgetary support from development partners, there is the need to intensify domestic revenue generation through innovative strategies and capturing more informal sector workers.
The document summarizes the 2014-2015 annual operating budget for Naperville, Illinois. It discusses how the city has been impacted by the economic recession but has improved its budget since 2008-2009. The budget was developed by the Finance Department to meet the fiscal needs of the city government. Key points of the budget include a decline in property values and taxes, issues with funding the electric utility, and a $9 million reduction due to pension contributions. The largest sources of general fund revenue are sales tax, property tax, and state income tax.
- The document discusses issues related to Ontario's upcoming 2018 election, focusing on economic factors. It notes that GDP growth will be a talking point but current policies on carbon pricing, hydro rates, taxes have negatively impacted industries like manufacturing. Both McGuinty and Wynne governments are seen as spending beyond their means.
- Specific industries discussed include automotive, mining, food processing, and steel production. Issues faced by these sectors include high energy costs, taxes, and regulatory burdens.
- Ontario's deficit and debt levels are also addressed, with the province's financial watchdog projecting continued deficits despite promises to balance the budget. The legacy of McGuinty and Wynne is seen as weakening Ontario's economic competit
From 2010—the first full year after the official end of the Great Recession—to 2018, Vermont’s economy, as measured by gross state product, grew at less than one-third the rate of the country’s overall. Vermont’s annual growth rate, after adjusting for inflation, averaged 0.7 percent per year, compared with 2.3 percent for the U.S. That was also slower than Vermont’s own annual growth rate during the previous recovery (2002-07), which was 1.8 percent. From 2017 to 2018 Vermont’s real GSP grew by 1.2 percent.
This document proposes a new tax model with a single flat tax rate for all income levels, limited deductions, and taxable government transfers. It summarizes the current US tax system and compares the proposed model to flat and progressive systems. The proposed model aims to eliminate poverty through government assistance while maintaining a strong economy and middle class through tax deductions and subsidies to different groups.
The document is a memorandum analyzing Franklin County's proposed 2016/2017 budget. It finds issues with lack of transparency and accountability in the budget process. Specifically, it calls out increases in the Sheriff's budget, largely due to raises for higher-level employees, and an unsubstantiated increase for EMS services. It recommends the commissioners pursue the rollback tax rate and curb excess spending to address the budget issues.
All you need to know about equalization and government transfers to the provi...paul young cpa, cga
- Equalization payments are a contentious issue between the federal government and provinces. Quebec receives over $10 billion per year in equalization payments, while provinces like Alberta and Newfoundland pay more in taxes than they receive back in federal spending and transfers.
- Newfoundland's finance minister argues the province should receive better treatment under the equalization formula given its small population and high costs. Quebec has asked Ottawa not to extend loan guarantees to Newfoundland's Muskrat Falls project.
- The equalization formula will remain unchanged until 2024, frustrating Western provinces. Ontario is no longer eligible for payments as its economy has grown, but still receives nearly $1 billion annually through the phase-out process.
- Critics
Budget Proposal For Miami-Dade County For Fiscal Year 201819I.docxcurwenmichaela
Budget Proposal For Miami-Dade County For Fiscal Year 2018/19
Introduction
This paper reviews the budget proposal for Miami-Dade County for fiscal year 2018/19, the budget process, sources of revenue and expenditure.
Overview And Budget Process.
Miami-Dade County is one of the counties in the USA and contains 13 districts. Miami-Dade County has a population of 2.71M people with a median age of 39.9 and a median household income of $45,935. Between 2015 and 2016 the population of Miami-Dade County grew from 2.69M to 2.71M, a 0.74% increase, and its median household income grew from $43,786 to $45,935, a 4.91% increase. The legislative and the governing body of the county is the Board of commission elected into office by the registered voters in a non-partisan election. One county commissioner is elected from each county for the term of four years each; the county chatter normally sets the salaries for each commissioner. The Commissioners elect a Chairperson, who then appoints the Chairperson, Vice-Chairperson, and members of all committees.
The Miami-Dade County commissioners normally plays a lot of roles which includes; reviews and adopts comprehensive development land use plans for the County, licenses and regulates taxis, transportation network entities, sets policy regarding public transportation systems, regulates utilities, adopts and enforces building codes, establishes zoning controls and establishes policy relating to public health, safety services and facilities, recreational and cultural facilities, housing and social services programs, and other services.
The BCC normally sets the tax rates and approve the county budget every financial year. Each year, the commission sets the property tax millage rates and approves the County’s budget, which determines
The expenditures and revenues are necessary to operate all County services, and enacts the County's strategic plan. The County Commission Board may override a Mayoral veto at its next regularly scheduled meeting by a two-thirds vote of those present. The Miami-Date county citizens do not directly play a role in the budget process, but the BCC normally represents them by making policies and advocate them at all levels of government. The Miami-Dade FY 2018/2019 annual budget began on 1st August 2018 and ended 30th June 2019. The budget process takes place in several stages which are a formulation, approval implementation, and audit. Documents essential to the budget process include the budget circular, the budget review, outlook paper, the county fiscal strategy paper, and the county budget estimates. The county has a budget performance analysis which is conducted by each department of the county, and it’s done through the analysis of the outcomes and results. The budget does not include the forecast for future years or prior years. The budget document gives detailed information on sources of revenue and expenditures. The budget report posted in the county’s websites gives inform.
The document discusses several topics related to education finance and budgets, including:
1) A lawsuit filed by 600 school districts in Texas arguing that the current school funding system violates the state constitution.
2) Reasons for shortfalls in Texas education funding, including declining property tax revenues and cuts to education funding.
3) Details of the Texas state budget for 2016-2017, including a $1.2 billion tax break for homeowners and reduced school district property taxes.
Ehrnrooth Final Report Budgets & Finances Course FSU 2008mcehrnrooth
The document analyzes the effects of Sandy Springs' incorporation in 2005 on the City of Atlanta's budget from 2004-2009. It finds that while revenues and expenditures decreased substantially in 2006 due to a change in fiscal year, they increased in subsequent years. Higher property tax rates and service fees adopted after 2005 may have been influenced by the loss of Sandy Springs revenues, though the budget impacts are unclear. Budgeting errors also contributed to deficits.
This document provides a summary of the City of Baltimore's budget and accomplishments for fiscal year 2016. It discusses how the budget focuses on seven priority outcomes like better schools, safer streets, and a growing economy. It also highlights some key investments for 2016, such as expanding youth programs, opening recreation centers, and supporting small businesses. Financial data is presented on revenues, expenditures, services funded, and progress on long-term fiscal sustainability goals.
The document provides an overview of fiscal and economic factors related to the City of Albany, New York. It discusses that Albany is the capital of New York State and home to many state government offices and properties that are tax exempt. This reduces the city's tax base. The document also notes that Albany has higher than average poverty rates that increase demand for social services. It summarizes population trends, economic indicators like income and unemployment, the city's tax base, revenues, and expenditures.
The document provides an analysis of the fiscal health of the 75 most populous U.S. cities based on their fiscal year 2018 financial reports. It finds that 63 cities had more debt than money to pay all bills, with a total unfunded debt of $323.2 billion. Unfunded retirement benefits, including $176.2 billion in pension debt and $149.8 billion in other post-employment benefits, were major contributors to the debt. The report ranks the cities based on their "Taxpayer Burden" or "Taxpayer Surplus" and assigns grades based on their financial condition. No cities received an A, 12 received a B, 27 a C, 32 a D, and 4 an F.
The document provides the State of the Village report from the Village President, Linda Jackson. It summarizes the accomplishments of 2014 and plans for 2015 across various departments. Key points include maintaining a balanced budget and high credit rating. The finance, community development, police, and public works departments all saw improvements and continued growth in 2014 such as new businesses, increased permits, and infrastructure upgrades. The report outlines the vision to ensure Glendale Heights remains a progressive community.
Texas Tomorrow: The Future of Texas by Raul Torres CPARaul Torres, CPA
“Texas Tomorrow: An Economic Plan for Texas in the 21st Century,” presents a blueprint for growing the Texas economy resulting in a higher quality of life for its citizens. It promotes innovative and creative ideas to prioritize state spending, stabilizing the state’s taxing and regulatory programs, incentivizing the job creators and calls for true public school reform. The blueprint also shows us that there are alternatives to higher taxes and deeper spending cuts that rob our citizens of their ability to live, work and prosper. And finally it calls for the legislature to take bold steps to rein in spending, encourage economic development and for it to take a real leadership role as Texas transforms itself into a 21st century state.”
Global Urban Development Program Round Two
South Stockton Revitalization
Deliverable 2: Final Research
Submitted December 22, 2014
Report: http://www.slideshare.net/GUDP/stockton-deliverable-2-final-research-report
Project site: http://gudp.stanford.edu/index.php/round-two
January 20 Sales Tax Proposal Question and Answeradonicaduggan
The document provides information from a school board presentation on a proposed sales tax increase. It includes details on submitting questions during the presentation, expected revenue amounts from various sales tax rates, how the tax rate could be adjusted annually if passed, and how funds are currently allocated. It also addresses questions from attendees on topics like property taxes, the district's budget and surplus, unfunded mandates, and declining revenues.
Municipalities across Eastern Ontario must develop a strategy to address the pressing business challenges they face. An aging workforce, a population shift from mid-sized cities and small towns to urban centers and the disruption of the digital economy will force local governments to make important choices. Will we embrace the new entrepreneurial solutions, create novel services while explore partnerships or simply maintain the status quo? Can we along the St. Lawrence Corridor keep pace with the new economy? These choices will define how we view the role of local government and will determine our shared prosperity.
City of Mesa 2017-18 Proposed Budget OverviewRAILmesa
The City of Mesa has begun its budgeting process for next Fiscal Year. Now is the time to pay attention and advocate for the areas of the budget you want to see increased or decreased. Currently, the budget proposed $408.2 million in revenue and $417.1 million in expenses, made up with $8.9 million being drawn from City Reserve accounts.
The document discusses the Housing Opportunities for Persons with AIDS (HOPWA) Program, which was established in 1990 to provide housing assistance and support services for low-income persons living with HIV/AIDS. The program aims to improve health outcomes by providing stable housing. Grantees are required to submit annual performance reports on program accomplishments and client data to the Department of Housing and Urban Development. Performance measurement helps ensure federal requirements are met and that programs are working effectively to address needs.
Edelman Canada shares highlights from Alberta Finance Minister Joe Ceci’s 2017 Budget. To learn more about Edelman Canada, please visit www.edelman.ca.
Comprehensive Annual Financial Report City of Middle.docxdonnajames55
This document is the Comprehensive Annual Financial Report (CAFR) of the City of Middletown, Connecticut for the fiscal year ending June 30, 2015. It includes introductory information about Middletown's government and officials, the independent auditor's report, financial statements, notes to the financial statements, required supplementary information, and supplementary financial schedules and statistics. The CAFR provides a comprehensive overview of the City of Middletown's financial position and activities for fiscal year 2015.
The City of Alamo Heights presents its Comprehensive Annual Financial Report for fiscal year 2019, which received an unmodified audit opinion. The report shows that the City's net position increased by $1.2 million over the previous year to $18.5 million total. An independent auditor found that the City's financial statements were prepared in accordance with accounting standards.
COMPREHENSIVEANNUAL FINANCIALREPORTfor the year ended .docxmaxinesmith73660
COMPREHENSIVE
ANNUAL FINANCIAL
REPORT
for the year ended December 31, 2014
ULHHU
Michael E. Lamb, City Controller
CITY OF PITTSBURGH PENNSYLVANIA
i
Front and back cover photos credits are from Thinkstock.com by Getty Images.
CITY OF PITTSBURGH, PENNSYLVANIA
COMPREHENSIVE ANNUAL FINANCIAL REPORT
YEAR ENDED DECEMBER 31,2014
TART.F. OF CONTENTS
INTRODUCTORY SECTION
Letter of Transmittal
GFOA Certificate of Achievement
Organizational Chart
Elected City Officials
FINANCIAL SECTION
Independent Auditor's Report
Management's Discussion and Analysis
Basic Financial Statements:
Government-wide Financial Statements:
Statement of Net Position
Statement of Activities
Fund Financial Statements:
Balance Sheet - Governmental Funds
Reconciliation of the Balance Sheet of Governmental Funds to the
Statement of Net Position
Statement of Revenues, Expenditures, and Changes in Fund Balance -
Governmental Funds
Reconciliation of the Statement of Revenues, Expenditures, and
Changes in Fund Balance of Governmental Funds to the Statement of
Activities
Statement of Revenues, Expenditures, and Changes in Fund Balance -
Budget and Actual (Non-GAAP Budgetary Basis) - General Fund
Statement of Revenues, Expenditures, and Changes in Fund Balance -
Budget and Actual (Non-GAAP Budgetary Basis) - Community
Development Fund
Page No.
I-l
1-8
1-9
I-IO
14
CITY OF PITTSBURGH, PENNSYLVANIA
COMPREHENSIVE ANNUAL FINANCIAL REPORT
YEAR ENDED DECEMBER 31,2014
TABLE OF CONTENTS fContinuedl
Fiduciary Fund Statements:
Statement of Net Position - Fiduciary Funds
Statement of Ciianges in Net Position - Fiduciary Funds
Combining Statements of Discrete Component Units:
Combining Statement of Net Position - Component Units
Statement of Activities - Component Units
Notes to Financial Statements
Page No.
Required Supplementary Information:
Pension Trust Fund Disclosures - GASB Statement No. 67:
Schedule of Changes in the City's Net Pension Liability and Related Ratios -
Pension Plan
Schedule of the City's Contributions and Investment Returns
Notes to Required Supplementary Information - Pension Plan
Employer Pension Plans and OPEB Disclosures:
Schedules of Funding Progress - Pensions
Schedules of Contributions from Employers and Other Contributing
Entities
Note to Required Supplementary Pension Schedules
Schedule of Funding Progress - Other Postemployment Benefit Plans
Supplementary Information:
Combining and Individual Other Fund Statements and
Schedules:
Combining Balance Sheet - Nonmajor Governmental Funds
Combining Statement of Revenues, Expenditures, and Changes in Fund
Balance - Nonmajor Governmental Funds
Combining Statement of Net Position - Pension Trust Funds
16
17
18
20
21
95
96
97
98
99
100
101
102
103
104
CITY OF PITTSBURGH, PENNSYLVANIA
COMPREHENSIVE ANNUAL FINANCIAL REPORT
YEAR ENDED DECEMBER 31, 2014
TABLE OF CONTENTS rContinucd)
Combining Statement of Changes inNet Position - Pension Trust Fun.
For more classes visit
www.snaptutorial.com
ACC 548 Assignment Balancing the Budget
What are the relevant facts?
Who is affected?
Who are the major parties in this case?
What are the ethical conflicts in this case?
This document provides contact information for various city services and departments in Cupertino, California. It also includes a brief summary of key facts about the city, such as its population, median age, and rankings. Additionally, it introduces the city's fiscal year 2014-2015 budget, including revenues, expenditures, staffing levels over time, and the breakdown of funds and departments.
www.charlottesville.orgCity of Charlottesville, Virginia.docxericbrooks84875
www.charlottesville.org
City of Charlottesville, Virginia
Comprehensive Annual Financial Report
Fiscal Year Ended June 30, 2010
CITY OF CHARLOTTESVILLE, VIRGINIA
Comprehensive Annual Financial Report
Fiscal Year Ended June 30, 2010
Prepared by
Department of Finance
DEPARTMENT OF FINANCE
Monica L. Brumfield
John A. Chisholm
Barbara Eyrse
Elnora L. Grooms
Kathy W. Hall
Khristina S. Hammill
Linda D. Harding
Gail E. Hassmer
Michael Heny
Teresa A. Kirkdoffer
Sharon O’Hare
Michaela Roberts
Beatrice M. Segal
Peggy J. Sprouse
Bernard Wray
CITY OF CHARLOTTESVILLE, VIRGINIA
COMPREHENSIVE ANNUAL FINANCIAL REPORT
FOR THE YEAR ENDED JUNE 30, 2010
TABLE OF CONTENTS
Exhibit or
Schedule Page
INTRODUCTORY SECTION
Letter of Transmittal 1
GFOA Certificate of Achievement for Excellence in Financial Reporting 10
City Organizational Chart 11
List of Elected and Appointed Officials 12
FINANCIAL SECTION
Independent Auditors' Report 13
Management's Discussion and Analysis 15
Basic Financial Statements:
Government-wide Financial Statements:
Statement of Net Assets A 30
Statement of Activities B 31
Fund Financial Statements:
Balance Sheet - Governmental Funds C 32
Statement of Revenues, Expenditures and Changes in Fund Balances - Governmental Funds D 34
Statement of Net Assets - Proprietary Funds E-1 36
Reconciliation of the Proprietary Funds Statement of Net Assets to the Statement
of Net Assets for Business-Type Activities E-2 37
Statement of Revenues, Expenses and Changes in Fund Net Assets - Proprietary
Funds E-3 38
Reconciliation of the Proprietary Funds Statement of Revenues, Expenses and
Changes in Fund Net Assets to the Statement of Activities E-4 39
Statement of Cash Flows - Proprietary Funds E-5 40
Statement of Fiduciary Net Assets - Fiduciary Funds F-1 41
Statement of Changes in Fiduciary Net Assets - Fiduciary Funds F-2 42
Notes to the Financial Statements 43
Required Supplementary Information:
Schedule of Revenues, Expenditures and Changes in Fund Balance - Budget and Actual -
Budget Basis - General Fund G 76
Schedule of Revenues, Expenditures and Changes in Fund Balance - Budget and Actual -
Budget Basis - Social Services Fund H 81
Schedule of Funding Progress and Employer Retirement
Contributions - Employee Retirement and Post-Employment Benefit Plans I 82
Note to Required Supplementary Information .
Similar to Fiscal Transparency in Arlington, Massachusetts (20)
Lourdes Germán Director of International & Institute-Wide Initiatives at the Lincoln Institute of Land Policy, shares examples of land value capture, a policy approach by which communities recover and reinvest the land value generated by public investment and other government action.
This document discusses alternatives to property tax incentives for businesses. It outlines some of the pitfalls of using property tax incentives, such as granting incentives when they do not affect location decisions or when the costs exceed the benefits. It then presents some alternatives, such as lowering overall tax rates, cooperating across municipalities rather than competing for businesses, and focusing on making the regulatory environment more business-friendly without emphasizing tax breaks. Specific examples of places that have used these alternative strategies are also provided.
Adam Langley of the Lincoln Institute of Land Policy surveys the landscape payments in lieu of taxes (PILOTs), payments made voluntarily by tax-exempt nonprofits as a substitute for property taxes, in New England.
Experiences from the Working Cities Challenge, including case studies of Lawrence, Massachusetts, which established a school-based hiring initiative and Fitchburg, Massachusetts, which sought to transform a struggling neighborhood with investment and the involvement of Fitchburg State College.
Yolanda Kodrzycki, emeritus director of the New England Public Policy Center, summarizes her research on resurgent cities including the importance of cross-sectoral and regional cooperation.
Adam Langley, senior research analyst at the Lincoln Institute of Land Policy, explores a potential role for nonprofit payments in lieu of taxes (PILOTs) in addressing fiscal stress and suggested that localities approach PILOTs in a collaborative way marked by respectful dialogue, careful use of terminology, and justification for PILOT requests.
Catherine Collins, associate director and senior research associate of the George Washington Institute of Public Policy, discusses property tax issues including tax base erosion and green property tax incentives.
Mary Murphy, manager of state and local fiscal health for the Pew Charitable Trusts, shares her latest research, which found that that only 22 states monitor local fiscal health.
Susanne Greschner, chief of the Rhode Island Department of Revenue Division of Municipal Finance, describes her state’s Fiscal Stability Act and innovative fiscal transparency portal.
Robert Triest, vice president and director of the New England Public Policy Center, compares the economies of the New England states, reporting that Massachusetts had the region’s most robust increase in state revenue and healthiest employment growth since the Great Recession.
Cities around the world are facing a crisis of investment. An integral part of solving this challenge requires building local government capacities and providing practitioners, academics, and advisors who work with cities with leading strategies that have the potential to advance infrastructure investment in ways that contribute to sound municipal fiscal systems. This presentation was originally delivered as a webinar on November 9, 2016 as part of a series of webinars on Municipal Fiscal Health. The webinar featured Dr. Julie Kim, a global infrastructure finance expert at Stanford University's Global Projects Center with over 30 years of public-private partnerships and infrastructure consulting experience in the U.S. and Asia; and Nicole DuPuis from the the National League of Cities, the nation's leading advocacy organization devoted to strengthening and promoting cities as centers of opportunity, leadership and governance.
This document discusses the importance of managing technology risks for municipal governments. It identifies six categories of technology risk: cybersecurity, financial, operational, legal, reputational, and societal. Cybersecurity risks like data breaches and network intrusions are discussed in depth. The document emphasizes that developing technological proficiency requires strong governance, planning, cyber hygiene practices, and technical competency. It provides a five-stage model for assessing an organization's maturity in managing technology risks and recommends that all organizations start prioritizing technological proficiency.
Richard England, visiting fellow at the Lincoln Institute, argues that the preferential tax assessment of rural land isn’t as effective for encouraging small farms as its enactors had hoped, and that reform is necessary to prevent misuse of this policy tool.
The document discusses Boston's reliance on property taxes for revenue and its fiscal challenges arising from a large portion of properties being tax exempt. It summarizes four initiatives to address this: 1) obtaining Payment in Lieu of Taxes (PILOT) from non-profits, 2) using an Infrastructure Investment Initiative (I Cubed) to fund development, 3) improving personal property tax audits, and 4) reducing tax abatements and appeals. It provides details and results for each initiative that has increased revenues without raising tax rates.
Peder Schaefer, associate director of the Rhode Island League of Cities and Towns, presents a case study of the city of Woonsocket, whose use of the Budget Commission Act helped the city reach fiscal solvency, and looks at other distressed cities.
Michael Lawson, a researcher for the George Mason University Fiscal Sustainability Project, provides a fiscal comparison of Baltimore and San Bernardino
AHMR is an interdisciplinary peer-reviewed online journal created to encourage and facilitate the study of all aspects (socio-economic, political, legislative and developmental) of Human Mobility in Africa. Through the publication of original research, policy discussions and evidence research papers AHMR provides a comprehensive forum devoted exclusively to the analysis of contemporaneous trends, migration patterns and some of the most important migration-related issues.
UN WOD 2024 will take us on a journey of discovery through the ocean's vastness, tapping into the wisdom and expertise of global policy-makers, scientists, managers, thought leaders, and artists to awaken new depths of understanding, compassion, collaboration and commitment for the ocean and all it sustains. The program will expand our perspectives and appreciation for our blue planet, build new foundations for our relationship to the ocean, and ignite a wave of action toward necessary change.
Jennifer Schaus and Associates hosts a complimentary webinar series on The FAR in 2024. Join the webinars on Wednesdays and Fridays at noon, eastern.
Recordings are on YouTube and the company website.
https://www.youtube.com/@jenniferschaus/videos
United Nations World Oceans Day 2024; June 8th " Awaken new dephts".Christina Parmionova
The program will expand our perspectives and appreciation for our blue planet, build new foundations for our relationship to the ocean, and ignite a wave of action toward necessary change.
Combined Illegal, Unregulated and Unreported (IUU) Vessel List.Christina Parmionova
The best available, up-to-date information on all fishing and related vessels that appear on the illegal, unregulated, and unreported (IUU) fishing vessel lists published by Regional Fisheries Management Organisations (RFMOs) and related organisations. The aim of the site is to improve the effectiveness of the original IUU lists as a tool for a wide variety of stakeholders to better understand and combat illegal fishing and broader fisheries crime.
To date, the following regional organisations maintain or share lists of vessels that have been found to carry out or support IUU fishing within their own or adjacent convention areas and/or species of competence:
Commission for the Conservation of Antarctic Marine Living Resources (CCAMLR)
Commission for the Conservation of Southern Bluefin Tuna (CCSBT)
General Fisheries Commission for the Mediterranean (GFCM)
Inter-American Tropical Tuna Commission (IATTC)
International Commission for the Conservation of Atlantic Tunas (ICCAT)
Indian Ocean Tuna Commission (IOTC)
Northwest Atlantic Fisheries Organisation (NAFO)
North East Atlantic Fisheries Commission (NEAFC)
North Pacific Fisheries Commission (NPFC)
South East Atlantic Fisheries Organisation (SEAFO)
South Pacific Regional Fisheries Management Organisation (SPRFMO)
Southern Indian Ocean Fisheries Agreement (SIOFA)
Western and Central Pacific Fisheries Commission (WCPFC)
The Combined IUU Fishing Vessel List merges all these sources into one list that provides a single reference point to identify whether a vessel is currently IUU listed. Vessels that have been IUU listed in the past and subsequently delisted (for example because of a change in ownership, or because the vessel is no longer in service) are also retained on the site, so that the site contains a full historic record of IUU listed fishing vessels.
Unlike the IUU lists published on individual RFMO websites, which may update vessel details infrequently or not at all, the Combined IUU Fishing Vessel List is kept up to date with the best available information regarding changes to vessel identity, flag state, ownership, location, and operations.
Monitoring Health for the SDGs - Global Health Statistics 2024 - WHOChristina Parmionova
The 2024 World Health Statistics edition reviews more than 50 health-related indicators from the Sustainable Development Goals and WHO’s Thirteenth General Programme of Work. It also highlights the findings from the Global health estimates 2021, notably the impact of the COVID-19 pandemic on life expectancy and healthy life expectancy.
Jennifer Schaus and Associates hosts a complimentary webinar series on The FAR in 2024. Join the webinars on Wednesdays and Fridays at noon, eastern.
Recordings are on YouTube and the company website.
https://www.youtube.com/@jenniferschaus/videos
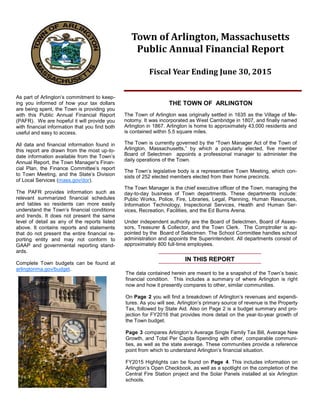
1. The data contained herein are meant to be a snapshot of the Town’s basic
financial condition. This includes a summary of where Arlington is right
now and how it presently compares to other, similar communities.
On Page 2 you will find a breakdown of Arlington’s revenues and expendi-
tures. As you will see, Arlington’s primary source of revenue is the Property
Tax, followed by State Aid. Also on Page 2 is a budget summary and pro-
jection for FY2016 that provides more detail on the year-to-year growth of
the Town budget.
Page 3 compares Arlington’s Average Single Family Tax Bill, Average New
Growth, and Total Per Capita Spending with other, comparable communi-
ties, as well as the state average. These communities provide a reference
point from which to understand Arlington’s financial situation.
FY2015 Highlights can be found on Page 4. This includes information on
Arlington’s Open Checkbook, as well as a spotlight on the completion of the
Central Fire Station project and the Solar Panels installed at six Arlington
schools.
Town of Arlington, Massachusetts
Public Annual Financial Report
Fiscal Year Ending June 30, 2015
As part of Arlington’s commitment to keep-
ing you informed of how your tax dollars
are being spent, the Town is providing you
with this Public Annual Financial Report
(PAFR). We are hopeful it will provide you
with financial information that you find both
useful and easy to access.
All data and financial information found in
this report are drawn from the most up-to-
date information available from the Town’s
Annual Report, the Town Manager’s Finan-
cial Plan, the Finance Committee’s report
to Town Meeting, and the State’s Division
of Local Services (mass.gov/dor).
The PAFR provides information such as
relevant summarized financial schedules
and tables so residents can more easily
understand the Town’s financial conditions
and trends. It does not present the same
level of detail as any of the reports listed
above. It contains reports and statements
that do not present the entire financial re-
porting entity and may not conform to
GAAP and governmental reporting stand-
ards.
Complete Town budgets can be found at
arlingtonma.gov/budget.
THE TOWN OF ARLINGTON
The Town of Arlington was originally settled in 1635 as the Village of Me-
notomy. It was incorporated as West Cambridge in 1807, and finally named
Arlington in 1867. Arlington is home to approximately 43,000 residents and
is contained within 5.5 square miles.
The Town is currently governed by the “Town Manager Act of the Town of
Arlington, Massachusetts,” by which a popularly elected, five member
Board of Selectmen appoints a professional manager to administer the
daily operations of the Town.
The Town’s legislative body is a representative Town Meeting, which con-
sists of 252 elected members elected from their home precincts.
The Town Manager is the chief executive officer of the Town, managing the
day-to-day business of Town departments. These departments include:
Public Works, Police, Fire, Libraries, Legal, Planning, Human Resources,
Information Technology, Inspectional Services, Health and Human Ser-
vices, Recreation, Facilities, and the Ed Burns Arena.
Under independent authority are the Board of Selectmen, Board of Asses-
sors, Treasurer & Collector, and the Town Clerk. The Comptroller is ap-
pointed by the Board of Selectmen. The School Committee handles school
administration and appoints the Superintendent. All departments consist of
approximately 800 full-time employees.
IN THIS REPORT
FY2015 Highlights
4
Solar Panels Installed at Six Arlington Schools
Arlington entered into a 20-year solar power purchase
agreement (PPA) with developer, Ameresco, purchas-
ing electricity at a rate lower than it has paid Eversource
in the past. Rooftop-mounted solar panels were in-
stalled at six Arlington schools, expecting to generate
850,000 kWh in the first year of system operation; 16
million kWh over 20 years, resulting in annual utility
budget savings. Renewable generation will help reduce
carbon dioxide emissions from New England fossil fuel-
fired electric generation plants. Over 20 years, the six
systems will help prevent the emissions of 11,000 metric
tons of carbon dioxide; the same as eliminating over
2,300 cars from the road.
Open Checkbook
Arlington received a Commonwealth of Massachusetts’ Community Innovation Challenge (CIC) grant to develop its
own version of the Commonwealth’s Open Checkbook. The Town Manager’s Office worked to prepare and label the
Town’s financial data so it would effectively integrate the Open Checkbook platform with existing financial systems.
Open Checkbook allows residents to take a deeper dive into School and Town financials, including looking at spending
data by category or department. Residents can view Open Checkbook at arlingtonma.gov/budget.
Central Fire Station Complete
The Central Fire Station renovations were completed in the
summer of 2015. Built in 1926, it is a historic icon in Arling-
ton Center. The architects were able to preserve the out-
side of the building, retaining its historic character, with the
exception of the all new glass doors, which replaced the
conventional solid steel doors. The station will also be
LEED certified, saving money for taxpayers, reducing
greenhouse gas emissions, and providing a heathier envi-
ronment for the community.
Receive timely news and notices from Town Hall via email with Town of Arlington Notices. Notices include
public health and public works alerts, election information, special Town related events, and when the Town
Manager’s Annual Budget & Financial Plan is online. Subscribe today at: arlingtonma.gov/subscribe
2. The summary provided below demonstrates the year-to-year growth between Fiscal Year 2015 and Fiscal Year 2016. This
growth is consistent with the tenets of the Long Range Financial Plan. More detailed information and a glossary of terms,
including the Town's long range financial plan can be found at: www.arlingtonma.gov/budget
Where the Money Comes From ...and Where it Goes
ExpendituresRevenues FY2015 Budget
$137,587,937
32
Budget Summary & FY2016 Projection
Measuring Up... How Arlington Compares to Other Communities
The Average Single Family Tax Bill is
the average home value in a community
multiplied by that community’s property
tax rate. While individual tax bills may
vary according to individual home value,
the Average Tax Bill is a good indicator of
what the property tax burden is on resi-
dential taxpayers.
Due to relatively high home values, Ar-
lington residents tend to pay a higher tax
bill than the state average. While this
places Arlington near the middle in terms
of its comparable communities, it is still
significantly below neighbors Belmont
and Winchester.
Average New Growth: Under Proposi-
tion 21
/2 local property taxes cannot be
increased by more than 2.5% plus tax
revenues from new construction added to
the tax base. Consequently, for many
communities, New Growth is an im-
portant revenue source.
Arlington’s New Growth has exceeded
the majority of its comparable communi-
ties, however it falls slightly short of the
state-wide average.
Per Capita Spending is calculated from
the Town’s total expenditures divided by
its population, which provides a point of
comparison for how much the Town
spends proportionate to its size. This
makes it possible to compare spending
between Towns while accounting for pop-
ulation.
Arlington is in the bottom half of per capi-
ta spending relative to its comparable
communities. It is also below the state
average of $3,229.
Average Single Family Tax Bill FY15
Average New Growth FY13 - FY15
Total Per Capita Spending FY14
* Denotes these communities have a single family tax exemption included in
the figure above.
The School Budget is the largest department
budget in the Town. In addition to Town contribu-
tion to this budget, some funding comes direct
from outside revenue sources. This chart pro-
vides and overview of total funding. Details on
the school budget may be found at:
arlington.k12.ma.us/administration/budget
School Budget Funding
FY2015 FY2016 $ %
Revenue
Property Tax 105,285,021$ 108,977,901$ 3,692,880$ 3.5%
Local Receipts 8,540,842$ 8,896,000$ 355,158$ 4.2%
State Aid 17,462,884$ 18,230,105$ 767,221$ 4.4%
School Construction Aid 2,906,266$ 2,474,773$ (431,493)$ -14.8%
Free Cash 3,042,925$ 3,435,846$ 392,922$ 12.9%
Other Funds 350,000$ 350,000$ -$ 0.0%
TOTAL REVENUES 137,587,937$ 142,364,625$ 4,776,688$ 3.5%
Expenditures
Municipal Departments 31,392,491$ 32,376,144$ 983,653$ 3.1%
School Department 50,729,968$ 53,574,114$ 2,844,146$ 5.6%
Minuteman School 3,788,615$ 4,010,950$ 222,335$ 5.9%
Non-Departmental (Healthcare & Pensions) 24,050,099$ 25,499,823$ 1,449,724$ 6.0%
Capital (Includes Debt Service) 9,918,358$ 10,231,100$ 312,742$ 3.2%
MWRA Debt Shift 5,593,112$ 5,593,112$ -$ 0.0%
Warrant Articles 805,433$ 937,685$ 132,252$ 16.4%
Fixed Costs- Reserve Fund & Elections 1,131,005$ 1,287,760$ 156,755$ 13.9%
Override Stabilization Fund Deposit 4,310,362$ 2,782,763$ (1,527,599)$ -35.4%
TOTAL EXPENDITURES 131,719,443$ 136,293,452$ 4,574,009$ 3.5%
Non-Appropriated Expenses 5,868,494$ 6,071,173$ 202,679$ 3.5%
Surplus / (Deficit) $ - $ - $ - 0.0%
Change
Property Tax
76.52%
Local Receipts
6.21%
State Aid
12.69%
School
Construction
Aid
2.11%
Free Cash
2.21%
Other Funds
0.26%
Municipal
Departments
22.81%
Override
Stabilization Fund
3.13%
School
Department
36.87%
Minuteman
School
2.75%
Non‐
Departmental
17.48%
Capital
7.21%
MWRA Debt Shift
4.07%
Warrant Articles
0.59%
Fixed Costs‐
Reserve Fund &
Elections
0.82%
Non‐
Appropriated
4.27%
Town
Appropriation
89.9%
Grants
4.5%
Revolving Fees &
Reimbursements
5.6%
0.69%
0.87%
0.92%
1.10%
1.17%
1.26%
1.32%
1.39%
1.41%
1.65%
1.77%
1.90%
2.50%
3.30%
0.00%0.50%1.00% 1.50% 2.00% 2.50% 3.00% 3.50%
Milton
Stoneham
Medford
Melrose
Belmont
Brookline
Winchester
North Andover
Arlington
Reading
State-wide Ave
Natick
Watertown
Needham
$4,615
$5,214
$5,411
$5,549
$5,657
$6,630
$6,824
$6,851
$7,306
$7,880
$9,240
$10,588
$10,938
$13,610
$0 $3,000 $6,000 $9,000 $12,000 $15,000
Medford
State-wide Ave
Stoneham
Melrose
Watertown*
Natick
Reading
North Andover
Arlington
Milton
Needham
Winchester
Belmont
Brookline*
$2,301
$2,715
$2,747
$2,759
$3,020
$3,097
$3,127
$3,206
$3,229
$3,544
$3,705
$3,788
$4,346
$4,468
$0 $1,000 $2,000 $3,000 $4,000
Medford
North Andover
Stoneham
Melrose
Arlington
Reading
Milton
Watertown
State-wide Ave
Belmont
Natick
Brookline
Winchester
Needham
3. The summary provided below demonstrates the year-to-year growth between Fiscal Year 2015 and Fiscal Year 2016. This
growth is consistent with the tenets of the Long Range Financial Plan. More detailed information and a glossary of terms,
including the Town's long range financial plan can be found at: www.arlingtonma.gov/budget
Where the Money Comes From ...and Where it Goes
ExpendituresRevenues FY2015 Budget
$137,587,937
32
Budget Summary & FY2016 Projection
Measuring Up... How Arlington Compares to Other Communities
The Average Single Family Tax Bill is
the average home value in a community
multiplied by that community’s property
tax rate. While individual tax bills may
vary according to individual home value,
the Average Tax Bill is a good indicator of
what the property tax burden is on resi-
dential taxpayers.
Due to relatively high home values, Ar-
lington residents tend to pay a higher tax
bill than the state average. While this
places Arlington near the middle in terms
of its comparable communities, it is still
significantly below neighbors Belmont
and Winchester.
Average New Growth: Under Proposi-
tion 21
/2 local property taxes cannot be
increased by more than 2.5% plus tax
revenues from new construction added to
the tax base. Consequently, for many
communities, New Growth is an im-
portant revenue source.
Arlington’s New Growth has exceeded
the majority of its comparable communi-
ties, however it falls slightly short of the
state-wide average.
Per Capita Spending is calculated from
the Town’s total expenditures divided by
its population, which provides a point of
comparison for how much the Town
spends proportionate to its size. This
makes it possible to compare spending
between Towns while accounting for pop-
ulation.
Arlington is in the bottom half of per capi-
ta spending relative to its comparable
communities. It is also below the state
average of $3,229.
Average Single Family Tax Bill FY15
Average New Growth FY13 - FY15
Total Per Capita Spending FY14
* Denotes these communities have a single family tax exemption included in
the figure above.
The School Budget is the largest department
budget in the Town. In addition to Town contribu-
tion to this budget, some funding comes direct
from outside revenue sources. This chart pro-
vides and overview of total funding. Details on
the school budget may be found at:
arlington.k12.ma.us/administration/budget
School Budget Funding
FY2015 FY2016 $ %
Revenue
Property Tax 105,285,021$ 108,977,901$ 3,692,880$ 3.5%
Local Receipts 8,540,842$ 8,896,000$ 355,158$ 4.2%
State Aid 17,462,884$ 18,230,105$ 767,221$ 4.4%
School Construction Aid 2,906,266$ 2,474,773$ (431,493)$ -14.8%
Free Cash 3,042,925$ 3,435,846$ 392,922$ 12.9%
Other Funds 350,000$ 350,000$ -$ 0.0%
TOTAL REVENUES 137,587,937$ 142,364,625$ 4,776,688$ 3.5%
Expenditures
Municipal Departments 31,392,491$ 32,376,144$ 983,653$ 3.1%
School Department 50,729,968$ 53,574,114$ 2,844,146$ 5.6%
Minuteman School 3,788,615$ 4,010,950$ 222,335$ 5.9%
Non-Departmental (Healthcare & Pensions) 24,050,099$ 25,499,823$ 1,449,724$ 6.0%
Capital (Includes Debt Service) 9,918,358$ 10,231,100$ 312,742$ 3.2%
MWRA Debt Shift 5,593,112$ 5,593,112$ -$ 0.0%
Warrant Articles 805,433$ 937,685$ 132,252$ 16.4%
Fixed Costs- Reserve Fund & Elections 1,131,005$ 1,287,760$ 156,755$ 13.9%
Override Stabilization Fund Deposit 4,310,362$ 2,782,763$ (1,527,599)$ -35.4%
TOTAL EXPENDITURES 131,719,443$ 136,293,452$ 4,574,009$ 3.5%
Non-Appropriated Expenses 5,868,494$ 6,071,173$ 202,679$ 3.5%
Surplus / (Deficit) $ - $ - $ - 0.0%
Change
Property Tax
76.52%
Local Receipts
6.21%
State Aid
12.69%
School
Construction
Aid
2.11%
Free Cash
2.21%
OtherFunds
0.26%
Municipal
Departments
22.81%
Override
Stabilization Fund
3.13%
School
Department
36.87%
Minuteman
School
2.75%
Non-
Departmental
17.48%
Capital
7.21%
MWRA Debt Shift
4.07%
Warrant Articles
0.59%
Fixed Costs-
Reserve Fund&
Elections
0.82%
Non-
Appropriated
4.27%
Town
Appropriation
89.9%
Grants
4.5%
Revolving Fees &
Reimbursements
5.6%
0.69%
0.87%
0.92%
1.10%
1.17%
1.26%
1.32%
1.39%
1.41%
1.65%
1.77%
1.90%
2.50%
3.30%
0.00% 0.50%1.00%1.50% 2.00%2.50% 3.00% 3.50%
Milton
Stoneham
Medford
Melrose
Belmont
Brookline
Winchester
North Andover
Arlington
Reading
State-wide Ave
Natick
Watertown
Needham
$4,615
$5,214
$5,411
$5,549
$5,657
$6,630
$6,824
$6,851
$7,306
$7,880
$9,240
$10,588
$10,938
$13,610
$0 $3,000 $6,000 $9,000 $12,000 $15,000
Medford
State-wide Ave
Stoneham
Melrose
Watertown*
Natick
Reading
North Andover
Arlington
Milton
Needham
Winchester
Belmont
Brookline*
$2,301
$2,715
$2,747
$2,759
$3,020
$3,097
$3,127
$3,206
$3,229
$3,544
$3,705
$3,788
$4,346
$4,468
$0 $1,000 $2,000 $3,000 $4,000
Medford
North Andover
Stoneham
Melrose
Arlington
Reading
Milton
Watertown
State-wide Ave
Belmont
Natick
Brookline
Winchester
Needham
4. The data contained herein are meant to be a snapshot of the Town’s basic
financial condition. This includes a summary of where Arlington is right
now and how it presently compares to other, similar communities.
On Page 2 you will find a breakdown of Arlington’s revenues and expendi-
tures. As you will see, Arlington’s primary source of revenue is the Property
Tax, followed by State Aid. Also on Page 2 is a budget summary and pro-
jection for FY2016 that provides more detail on the year-to-year growth of
the Town budget.
Page 3 compares Arlington’s Average Single Family Tax Bill, Average New
Growth, and Total Per Capita Spending with other, comparable communi-
ties, as well as the state average. These communities provide a reference
point from which to understand Arlington’s financial situation.
FY2015 Highlights can be found on Page 4. This includes information on
Arlington’s Open Checkbook, as well as a spotlight on the completion of the
Central Fire Station project and the Solar Panels installed at six Arlington
schools.
Town of Arlington, Massachusetts
Public Annual Financial Report
Fiscal Year Ending June 30, 2015
As part of Arlington’s commitment to keep-
ing you informed of how your tax dollars
are being spent, the Town is providing you
with this Public Annual Financial Report
(PAFR). We are hopeful it will provide you
with financial information that you find both
useful and easy to access.
All data and financial information found in
this report are drawn from the most up-to-
date information available from the Town’s
Annual Report, the Town Manager’s Finan-
cial Plan, the Finance Committee’s report
to Town Meeting, and the State’s Division
of Local Services (mass.gov/dor).
The PAFR provides information such as
relevant summarized financial schedules
and tables so residents can more easily
understand the Town’s financial conditions
and trends. It does not present the same
level of detail as any of the reports listed
above. It contains reports and statements
that do not present the entire financial re-
porting entity and may not conform to
GAAP and governmental reporting stand-
ards.
Complete Town budgets can be found at
arlingtonma.gov/budget.
THE TOWN OF ARLINGTON
The Town of Arlington was originally settled in 1635 as the Village of Me-
notomy. It was incorporated as West Cambridge in 1807, and finally named
Arlington in 1867. Arlington is home to approximately 43,000 residents and
is contained within 5.5 square miles.
The Town is currently governed by the “Town Manager Act of the Town of
Arlington, Massachusetts,” by which a popularly elected, five member
Board of Selectmen appoints a professional manager to administer the
daily operations of the Town.
The Town’s legislative body is a representative Town Meeting, which con-
sists of 252 elected members elected from their home precincts.
The Town Manager is the chief executive officer of the Town, managing the
day-to-day business of Town departments. These departments include:
Public Works, Police, Fire, Libraries, Legal, Planning, Human Resources,
Information Technology, Inspectional Services, Health and Human Ser-
vices, Recreation, Facilities, and the Ed Burns Arena.
Under independent authority are the Board of Selectmen, Board of Asses-
sors, Treasurer & Collector, and the Town Clerk. The Comptroller is ap-
pointed by the Board of Selectmen. The School Committee handles school
administration and appoints the Superintendent. All departments consist of
approximately 800 full-time employees.
IN THIS REPORT
FY2015 Highlights
4
Solar Panels Installed at Six Arlington Schools
Arlington entered into a 20-year solar power purchase
agreement (PPA) with developer, Ameresco, purchas-
ing electricity at a rate lower than it has paid Eversource
in the past. Rooftop-mounted solar panels were in-
stalled at six Arlington schools, expecting to generate
850,000 kWh in the first year of system operation; 16
million kWh over 20 years, resulting in annual utility
budget savings. Renewable generation will help reduce
carbon dioxide emissions from New England fossil fuel-
fired electric generation plants. Over 20 years, the six
systems will help prevent the emissions of 11,000 metric
tons of carbon dioxide; the same as eliminating over
2,300 cars from the road.
Open Checkbook
Arlington received a Commonwealth of Massachusetts’ Community Innovation Challenge (CIC) grant to develop its
own version of the Commonwealth’s Open Checkbook. The Town Manager’s Office worked to prepare and label the
Town’s financial data so it would effectively integrate the Open Checkbook platform with existing financial systems.
Open Checkbook allows residents to take a deeper dive into School and Town financials, including looking at spending
data by category or department. Residents can view Open Checkbook at arlingtonma.gov/budget.
Central Fire Station Complete
The Central Fire Station renovations were completed in the
summer of 2015. Built in 1926, it is a historic icon in Arling-
ton Center. The architects were able to preserve the out-
side of the building, retaining its historic character, with the
exception of the all new glass doors, which replaced the
conventional solid steel doors. The station will also be
LEED certified, saving money for taxpayers, reducing
greenhouse gas emissions, and providing a heathier envi-
ronment for the community.
Receive timely news and notices from Town Hall via email with Town of Arlington Notices. Notices include
public health and public works alerts, election information, special Town related events, and when the Town
Manager’s Annual Budget & Financial Plan is online. Subscribe today at: arlingtonma.gov/subscribe