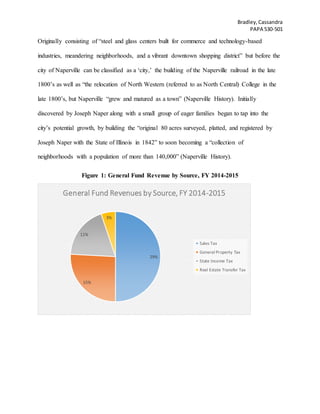
The document summarizes the 2014-2015 annual operating budget for Naperville, Illinois. It discusses how the city has been impacted by the economic recession but has improved its budget since 2008-2009. The budget was developed by the Finance Department to meet the fiscal needs of the city government. Key points of the budget include a decline in property values and taxes, issues with funding the electric utility, and a $9 million reduction due to pension contributions. The largest sources of general fund revenue are sales tax, property tax, and state income tax.
- City finance officers report that the fiscal condition of most cities has improved in 2013 compared to 2012 as the economic recovery continues. However, challenges remain such as high unemployment, pension obligations, and uncertainty about federal spending.
- While city revenues declined for most of the past decade, a small increase is projected for 2013 as property, sales, and income tax revenues experience slow growth. Expenditures are also expected to rise slightly.
- Factors placing pressure on city budgets include increasing costs for healthcare, pensions, and infrastructure, while federal and state aid levels have decreased for many cities. To address these issues, cities have increased fees and made cuts to personnel costs.
CBO regularly produces reports on the distribution of household income and federal taxes. This presentation highlights two methodological improvements for these analyses:
A new income measure to rank households by and to use as the denominator in the calculation of average federal tax rates, and
A regression-based method to correct for underreporting of transfer income in household survey data.
The information is preliminary and is being circulated to stimulate discussion and critical comment.
Presentation by Kevin Perese and Bilal Habib, analysts in CBO's Tax Analysis Division, at the Distributional Tax Analysis Conference.
The New York Senate Finance Committee reviewed and analyzed the economic and revenue projections contained within the Executive Budget for SFY 2010-11.
The Federal Government has spent almost $32 billion on cybersecurity-related expenditures in the past 10 years. More importantly, the cyber spending boom shows no sign of slowing, as spending increased 281 percent from 2006 to 2014 (an average of 22 percent annually). This historic growth in cyber spending runs counter to the greater trend in Federal Government spending that has led to a relatively modest increase of 4.2 percent annually over the same time period.
As the world becomes increasingly digitized, so has the Federal Government, but individual agencies are not spending on cybersecurity in similar ways. Each agency's funding over the past 10 years tells a unique story.
This presentation from the Congressional Budget Office summarizes two reports on the distribution of household income, federal taxes, and government spending. It finds that income is highly skewed towards the top, inequality has increased over time, and the tax system is progressive, though average tax rates are low. It also shows that examining both taxes and spending is important, as the elderly receive more in spending than they pay in taxes, and allocating public goods is challenging but necessary.
This is a very risky preposition. The forecast should be revisited annually rather than assuming no economic downturn through 2019.
Fiscal Pressures. Given the relatively small budget shortfalls projected by IBO for 2017-2019 and the sizable reserves contained in the Mayor’s financial plan—including general reserves of $1 billion annually and $2.6 billion in the Retiree Health Benefits Trust—the city’s fiscal outlook remains solid. But this outlook presumes no economic downturn through 2019. If that forecast holds the city will have gone an unprecedented 10 years without a recession.
Global economic struggles are dampening the US construction recovery. Low growth abroad has reduced investment and consumer spending domestically. While US GDP growth remains steady, construction lags the broader economy and may slow in response to global issues like low commodity prices and China's economic decline. Rising costs also challenge builders as wages and materials prices increase. First quarter construction starts declined from 2015 levels, and some sectors like office have seen significant drops, indicating activity is beginning to flatten due to cautious spending globally. Infrastructure remains a bright spot with increased transportation spending.
The document summarizes key financial information for the City of Rock Hill for fiscal year 2015. It provides highlights of revenues, expenses, economic trends, and performance metrics for the city. It also discusses the city's commitment to transparency, accountability, and long-term financial planning. The city uses various reports and financial documents to keep the public informed about its plans, goals, and finances.
The document discusses commercial real estate lending trends in 2017. It provides an economic overview of 2016, noting that while global economies moderated, the US GDP maintained moderate growth. Consumer spending was the main driver of growth, while business investment declined. Employment gains were strongest in education, professional services, and leisure/hospitality. Lending conditions tightened for commercial real estate due to increased regulatory oversight.
Dr. Stephen J. Fuller of George Mason University's Center for Regional Analysis gave a presentation to the Democratic Business Council of Northern Virginia (DemBiz.org) on April 18, 2014. These are the updated slides from the presentation.
A so-called policy brief from the partisan (Democrat) West Virginia Center on Budget & Policy that encourages the state to adopt a 100-200% increase in the tax on natural gas liquids (NGLs), but granting tax breaks for those who keep NGLs in the state, to be used in petrochemical plants like an ethane cracker.
The document summarizes North American office market indicators for Q3 2014. Vacancy rates declined slightly in both the US and Canada while absorption increased. Job growth drove office demand in both countries, leading to a broadening economic recovery. Office-using employment increased more than total employment, with growth seen across more industry sectors and geographic regions. Transaction volume was also up, reflecting continued strong investor demand.
This document is the 65th annual economic report for Faulkner County prepared by Roger Lewis, PhD. It summarizes key economic indicators for Faulkner County and Conway in 2015. It found that Conway's unemployment rate was the lowest in 7 years at 4.7% and below both state and national rates. Real estate sales increased 14% from 2014 based on revenue stamps. However, the value of building permits declined 18% and no multi-family units were constructed. The report provides statistics on population, cost of living, sales tax collections, banking deposits, and impacts from the natural gas industry and agriculture.
JLL’s Office Skyline focuses on the top tier of the office market, looking at some of the most iconic and highest-rent properties within CBDs and urban cores. Take a look at these five 2016 U.S. office market trends.
Fairfax County Government FY 2017 Advertised Budget PresentationJuan Rengel
This document provides an overview and context for Fairfax County's FY 2017 Advertised Budget Plan. It notes concerns about continued shortfalls in state funding and modest economic growth. While significant budget cuts have been made, additional needs remain unfunded. The budget proposes increases for schools, compensation, and public safety. However, revenue growth is insufficient to fund all priorities, so a $0.03 real estate tax rate increase is proposed, with an optional $0.04 increase. The local and national economies are improving but challenges like high commercial vacancies remain.
September 2016 U.S. employment update and outlookJLL
Despite employment growth in August falling below expectations, the overall U.S. unemployment rate held steady at 4.9 percent as growth in the workforce aligned with employment gains.
This document discusses Canada's deficit, debt, spending, and economic growth under Prime Minister Harper's government. It provides statistics on debt to GDP, program spending, revenue, and budget balances. It also analyzes criticisms from opposition parties like the NDP and Liberals, arguing they fail to consider external economic factors like the 2008 recession or improvements to transfers to provinces. The document questions why opposition parties do not discuss other federal programs or policies impacting investment and economic growth.
The presentation provided an economic forecast for the construction industry in 2015. It predicted total US construction spending to increase 9% and highlighted gains in multiple sectors such as single family housing up 15% and commercial buildings up 15%. The forecast also noted continued growth in California, with housing starts projected to increase significantly through 2018. In the local area, forecasts pointed to declines in office and industrial vacancy rates with continued residential and commercial development. Overall, the projections portrayed an optimistic outlook for the construction industry in 2015 with many sectors expected to see substantial gains over the prior year.
Presentation by Wendy Edelberg, an Associate Director for Economic Analysis at CBO, at the Brookings Institution’s Hutchins Center on Fiscal and Monetary Policy.
Revenues and spending as a share of economic output have varied over business cycles as a result of both changes in legislation and automatic stabilizers. Automatic stabilizers are the automatic increases in revenues and decreases in outlays in the federal budget that occur when the economy strengthens, and the opposite changes that occur when the economy weakens.
The document summarizes a presentation given by James Baumgardner from the Congressional Budget Office at the 2015 Health Care Forecast Conference. It discusses CBO analyses and projections regarding premium support options in Medicare, federal budget and deficit projections, the long-term budget outlook, and the impact of various policy alternatives on spending and debt levels. The slides analyze factors like the aging population, rising health care costs, and the timing and scale of policy changes needed to control the growth of federal debt.
U.S. economic outlook: Cutting through the alarmist noiseShay Moser
Professor of Economics Bart Hobijn provided the outlook for the national and global economies at the 56th Annual ASU Economic Forecast Luncheon on Dec. 11, 2019, at the Phoenix Convention Center.
He joined the W. P. Carey Economics Department at Arizona State University in summer 2015. He is an applied macroeconomist, whose special interests are technological progress and economic growth, price measurement, and labor market dynamics. Prior to joining ASU, Hobijn worked in the Economic Research departments of the Federal Reserve Banks of San Francisco and New York. He has also taught classes at U.C. Berkeley, City University of New York, INSEAD, New York University, and VU University Amsterdam, in the Netherlands.
He serves as a member of the Bureau of Labor Statistics’ technical advisory committee. He completed his PhD in economics at New York University and his MS in econometrics at Erasmus University Rotterdam in The Netherlands.
His research has been published in several of the leading academic journals in economics, including the American Economic Review, Quarterly Journal of Economics, and Journal of Monetary Economics. He has more than 60 publications and more than 6,000 citations on Google Scholar.
February 2016 U.S. employment update and outlook JLL
The labor market recorded a soft opening to 2016, adding only 151,000 new jobs, although unemployment fell below 5.0 percent for the first time since 2008.
Presentation by Wendy Edelberg, an Associate Director for Economic Analysis at CBO, at the National Bureau of Economic Research conference, Economics of Infrastructure Investment.
Federal investment in physical capital, education, and research and development boosts private-sector productivity gradually, CBO estimates. The overall macroeconomic and budgetary effects of federal investment depend on how that spending is financed.
This paper uses cross-country panel data from 1950-2014 to investigate whether the rise in top income inequality can be explained by capital accumulation or innovation when accounting for cross-country differences. Pooled OLS and fixed effects models are used to analyze the relationship between top income inequality, measures of capital accumulation, and measures of innovation. The paper finds some evidence that capital accumulation drives top income inequality in highly competitive countries, consistent with Piketty's theory. However, there is stronger evidence that innovation rents drive top income inequality rather than capital accumulation, as measures of innovation like patents granted and book-to-market ratio are significantly related to higher top 1% and top 10% income shares. The relationship between innovation and top income
Presentation by Ben Page, CBO's Fiscal Policy Studies Unit Chief, at the National Tax Association 108th Annual Conference on Taxation.
In May, the Congress adopted a concurrent resolution on the budget for fiscal year 2016. That resolution requires CBO, to the greatest extent practicable, to incorporate macroeconomic effects into its 10-year cost estimates for major legislation that Congressional committees approve. Such estimates must also include, when practicable, a qualitative assessment of the budgetary effects for the following 20 years. Incorporating such macroeconomic feedback into cost estimates is often called dynamic scoring. This presentation describes how CBO will prepare such estimates.
To understand a government you need to understand the context in which a government operates. Census of Governments and other free U.S. government related resources will help you understand the structure of governments; details on revenues and expenditures, capital outlay, outstanding debt, public employment, education, and public sector retirement; and monitor the fiscal strength of special districts, school districts, local, and state governments.
The City of Houston faces significant financial challenges, including over $3.3 billion in unfunded pension liabilities and another $3.3 billion in general obligation debt that must be repaid in the coming years. Workforce costs, including payroll and pension contributions, account for over half of the city's annual budget. While revenues have increased in recent years, expenses have risen at a faster rate, leading Moody's to issue a negative outlook on the city's finances due to concerns about its ability to balance budgets going forward.
FISCAL CONDITION ANALYSIS11Fiscal Condition Analysis for MShainaBoling829
FISCAL CONDITION ANALYSIS
11
Fiscal Condition Analysis for Maumelle, Arkansas
Angel Cuffie
Liberty UniversityIntroduction
The worksheets are missing, a serious omission.Financial Condition
Financial condition is described as the ability of organizations or institutions to create a balance between recurring expenditures and recurring revenues. According to Singla et al. (2018), it is the ability of institutions to raise funds. A strong financial condition indicates effective operations which results in profitability and the revenues exceed expenditure. On the other hand, a weak financial condition reflects a situation where institutions are unable to cater for their expenditure. For government entities, a good financial condition gives the entity the ability to provide essential services in an effectively and in a continued manner. It also ensures that services are offered even at adverse financial situations. In the contrary, government entities with weak financial conditions are unable to provide services and are faced with challenges such as disruptions in service delivery and have limited resources to cater for its needs (Singla et al., 2018). To maintain a strong financial condition, the government must take considerations to make long-term changes especially planning for developments for the future.
Financial Indicators for Fiscal Financial Analysis
A single measure cannot effectively capture the financial condition of an entire government entity therefore a comprehensive technique that emphasizes on both internal and external fiscal factors. There are numerous indicators for fiscal financial analysis (Sebestova et al., 2018). The financial indicators are broadly categorized into revenues and expenditures. Revenue financial indicators include total revenues, total revenues per household, intergovernmental revenues as a percentage of operating revenues, property tax revenues, sales & use tax revenues per household, restricted revenues to mention a few. On the other hand, expenditure financial indicators include total operating expenditure per household, fringe benefits, fixed costs as a percentage of operating expenditures, debt per household among others.
However, this fiscal condition analysis will only focus on the following five indicators;
Revenues
· Total Revenues
· Property Taxes
· Sales Taxes
Expenditures
· Operating Expenditures
· Personnel CostsAdjusting for constant dollars
While dealing with dollars in a range of time, the dollars have to be converted into constant dollars. According to Johnson (2020), converting current dollars to constant dollars helps financial analysts to take into account the appearance of growth that maybe accrued to inflation. Inflation changes the purchasing power of the dollar over time. In this fiscal condition analysis, all the dollar values are converted into constant 2020 dollar values. Revenue Indicators
Total Revenues per Household
Description: As a city’s population grows, it is ...
The General Fund deficit in Illinois is projected to almost double from FY2015 to FY2016, increasing from an estimated $6.8 billion to $12.7 billion. This is due to a combination of declining revenues and increasing costs. Revenues are expected to decline by $3.6 billion from FY2015 to FY2016 due to the phase down of temporary income tax increases and the loss of one-time borrowing. Meanwhile, "hard costs" like pensions, debt service, and statutory transfers are projected to rise by $1.9 billion. If spending on core services is held flat, over half of spending in FY2016 would need to be deficit spending.
The document discusses several topics related to education finance and budgets, including:
1) A lawsuit filed by 600 school districts in Texas arguing that the current school funding system violates the state constitution.
2) Reasons for shortfalls in Texas education funding, including declining property tax revenues and cuts to education funding.
3) Details of the Texas state budget for 2016-2017, including a $1.2 billion tax break for homeowners and reduced school district property taxes.
The quarterly report summarizes employment data for Boyle County, Kentucky for Q3 2010. Industrial employment increased by 121 jobs from the previous quarter to a total of 3,329 jobs. Non-industrial employment decreased by 45 jobs to 4,137 jobs. The overall employment increased by 76 jobs from the previous quarter to a total of 7,466 jobs due to growth in the industrial sector offsetting losses in non-industrial jobs. The unemployment rate decreased slightly from the previous quarter to 11.8%.
The document provides an analysis of Queensland state's budget for the 2011-2012 fiscal year. It summarizes the state's revenues and expenses for 2010-2011 and 2011-2012. Total revenues increased from $38.5 billion in 2010-2011 to $38.1 billion in 2011-2012, mainly from higher Commonwealth grants. Total expenses rose from $4.4 billion to $6.4 billion respectively, mainly due to increases in superannuation benefit payments and borrowing costs. The budget format focuses on economic planning and performance but could benefit from being more transparent on program justifications and shortcomings.
1) Puerto Rico's economy has contracted for most years since 2007, with real GNP declining by 13.8% total over that period. Persistent fiscal deficits and high levels of public debt exceeding 100% of GNP are major issues.
2) Out-migration, especially of working age residents, has increased substantially in recent years, reducing Puerto Rico's tax base. The population declined by around 8% from its 2004 peak.
3) The fiscal year 2016 budget assumes no deficit but revenues have frequently fallen short of projections, suggesting another deficit is likely. Cash flow problems necessitate short-term borrowing to start the fiscal year.
The document discusses Puerto Rico's recent economic performance and challenges. It notes that Puerto Rico's economy has contracted in most years since 2007, with real GNP growth of -1.8% on average from 2007-2014. Two other major issues facing Puerto Rico are its high and growing public debt level, which represents 103.2% of nominal GNP, and increasing out-migration of residents to the US mainland. Puerto Rico also faces difficulties with its healthcare system due to large cuts to Medicare and Medicaid funding compared to US states.
The document provides an overview of fiscal and economic factors related to the City of Albany, New York. It discusses that Albany is the capital of New York State and home to many state government offices and properties that are tax exempt. This reduces the city's tax base. The document also notes that Albany has higher than average poverty rates that increase demand for social services. It summarizes population trends, economic indicators like income and unemployment, the city's tax base, revenues, and expenditures.
This document summarizes the 2013 adopted budget for the Consolidated City of Indianapolis and Marion County. It describes the fiscal environment in 2012 including unexpected higher property tax and income tax revenues. For 2013, the budget faces a $65 million gap due to expected flat revenues from property and income taxes. Property tax revenue is projected to be flat as economic growth has not increased property values. Income tax revenue will be $3.2 million lower in 2013 due to reduced distributions from a stabilization account. The budget outlook is expected to improve in 2014 when a $20 million increase in income tax revenue is anticipated from resolving a state-local tax imbalance from 2008-2010.
Mercer Capital's Value Focus: Auto Dealer Industry | Year-End 2015Mercer Capital
Mercer Capital's Auto Dealer Industry newsletter provides perspective on valuation issues. Each newsletter also includes a macroeconomic trends, industry trends, and guideline public company metrics.
www.charlottesville.orgCity of Charlottesville, Virginia.docxericbrooks84875
www.charlottesville.org
City of Charlottesville, Virginia
Comprehensive Annual Financial Report
Fiscal Year Ended June 30, 2010
CITY OF CHARLOTTESVILLE, VIRGINIA
Comprehensive Annual Financial Report
Fiscal Year Ended June 30, 2010
Prepared by
Department of Finance
DEPARTMENT OF FINANCE
Monica L. Brumfield
John A. Chisholm
Barbara Eyrse
Elnora L. Grooms
Kathy W. Hall
Khristina S. Hammill
Linda D. Harding
Gail E. Hassmer
Michael Heny
Teresa A. Kirkdoffer
Sharon O’Hare
Michaela Roberts
Beatrice M. Segal
Peggy J. Sprouse
Bernard Wray
CITY OF CHARLOTTESVILLE, VIRGINIA
COMPREHENSIVE ANNUAL FINANCIAL REPORT
FOR THE YEAR ENDED JUNE 30, 2010
TABLE OF CONTENTS
Exhibit or
Schedule Page
INTRODUCTORY SECTION
Letter of Transmittal 1
GFOA Certificate of Achievement for Excellence in Financial Reporting 10
City Organizational Chart 11
List of Elected and Appointed Officials 12
FINANCIAL SECTION
Independent Auditors' Report 13
Management's Discussion and Analysis 15
Basic Financial Statements:
Government-wide Financial Statements:
Statement of Net Assets A 30
Statement of Activities B 31
Fund Financial Statements:
Balance Sheet - Governmental Funds C 32
Statement of Revenues, Expenditures and Changes in Fund Balances - Governmental Funds D 34
Statement of Net Assets - Proprietary Funds E-1 36
Reconciliation of the Proprietary Funds Statement of Net Assets to the Statement
of Net Assets for Business-Type Activities E-2 37
Statement of Revenues, Expenses and Changes in Fund Net Assets - Proprietary
Funds E-3 38
Reconciliation of the Proprietary Funds Statement of Revenues, Expenses and
Changes in Fund Net Assets to the Statement of Activities E-4 39
Statement of Cash Flows - Proprietary Funds E-5 40
Statement of Fiduciary Net Assets - Fiduciary Funds F-1 41
Statement of Changes in Fiduciary Net Assets - Fiduciary Funds F-2 42
Notes to the Financial Statements 43
Required Supplementary Information:
Schedule of Revenues, Expenditures and Changes in Fund Balance - Budget and Actual -
Budget Basis - General Fund G 76
Schedule of Revenues, Expenditures and Changes in Fund Balance - Budget and Actual -
Budget Basis - Social Services Fund H 81
Schedule of Funding Progress and Employer Retirement
Contributions - Employee Retirement and Post-Employment Benefit Plans I 82
Note to Required Supplementary Information .
This document provides a budget message for the City of Novi, Michigan for fiscal year 2010-2011. It discusses how the city has historically relied on manufacturing and transportation businesses but must now adapt to changing economic conditions. It outlines cost reductions made for the upcoming budget, including staff reductions, benefit changes, and other efficiency measures. The message emphasizes the need to plan long-term through fiscal analysis and budgeting conservatively to ensure financial stability in the face of declining revenues.
The Columbus MSA added 12,300 jobs in 2013 and continues to rank very well against comparable U.S. metros, according to Columbus 2020, the economic development organization in the Columbus Region. The final quarterly economic update for the 2013 calendar year covers regional economic data and development activities in the fourth quarter and throughout the year.
Columbus MSA employment was up 8,200 (0.8 percent) from March to June, ahead of Ohio’s increase of 0.4 percent and the U.S. increase of 0.6 percent, according to the Q2 economic update report produced by Columbus 2020. Going into the second half of the year, unemployment in the Columbus Region continued to decline at 4.6 percent, compared to June state and national rates of 5.5 and 6.1, respectively.
Class A vacancy once again has dipped below that of Class B properties as a number of tenants opt for more modern and newer space, compelled by improving economic conditions.
Allen Chastanet's VAT Promise - The Math Just Doesn't Work OutJAN GROSILE
- The document analyzes and critiques Allen Chastanet's "Five-Point Plan" from the UWP manifesto.
- It argues the plan to reduce and eliminate VAT is unrealistic and would bankrupt Saint Lucia within 5 years as VAT makes up 35% of government tax revenue. Removing it without replacement taxes would significantly reduce government income.
- It also contends the true intent is to reduce VAT exemptions rather than the rate, which would increase prices for basic necessities and hurt the poor.
The document provides an executive summary of the City of Tulsa's FY15 budget. It discusses revenues, expenditures, and the economic conditions in Tulsa. Total revenues are projected to be $687 million, an 0.8% increase from FY14. Taxes make up 52% of revenues, with sales tax being the largest at 33%. Expenditures are highest for public safety at 26% and public works/transportation at 39%. The economic forecast for Tulsa is improved, with growth in employment, income, and construction activity.
Power point slide presentation of the final projectobjectivediMARK547399
The document provides guidelines for creating a PowerPoint presentation for a final project. It states that PowerPoint presentations can be a powerful tool to accompany oral presentations but must be carefully prepared to not distract from the speaker. It provides tips for the presentation such as keeping it between 7-15 slides, using readable fonts, and checking it against the grading rubric.
CBO estimates that the federal budget deficit in 2020 will be $1.0 trillion, or 4.6 percent of gross domestic product (GDP). It would increase to 5.4 percent of GDP in 2030 if current law did not change. In CBO’s projections, federal debt held by the public reaches $17.9 trillion at the end of 2020. That amount equals 81 percent of GDP—more than twice its average over the past 50 years. By 2030, debt is projected to reach $31.4 trillion, or 98 percent of GDP, a larger percentage than at any time since just after World War II. It would continue to grow after 2030, reaching 180 percent of GDP by 2050.
Inflation-adjusted GDP is projected to grow by 2.2 percent this year, largely because of continued strength in consumer spending and a rebound in business fixed investment. Output is projected to be higher than the economy’s maximum sustainable output in 2020 to a greater degree than it has been in recent years, leading to higher inflation and interest rates after a period in which both were low, on average. CBO projects that continued strength in the demand for labor will keep the unemployment rate low and drive employment and wages higher. Then over the coming decade, the economy is projected to expand at an average annual rate of 1.7 percent, roughly the same rate as its potential rate of growth.
Similar to Bradley Budget Report with corrections-1 (20)
HSSU provides a holistic student experience through various academic and social programs. The Student Affairs department utilizes several developmental theories to support students. Key offices include Enrollment, Campus Life, Student Success, Athletics, and Diversity and Inclusion. These offices enhance retention, learning, and graduation through services like advising, activities, community partnerships, and more. The goal is for all students to have a supportive environment for growth and achievement.
Harris-Stowe State University is a historically black university located in St. Louis, Missouri. It was formed in 1954 by merging two separate teacher's colleges. Currently, HSSU enrolls around 1,300 students and has a student population that is around 75% female and 83% black. The university aims to address the needs of its primarily African American student body and the local community through partnerships and programs focused on leadership, civic engagement, and addressing social issues. HSSU is working to improve its low graduation rates by implementing initiatives like "banded" tuition to increase retention and affordability.
- The study explored the relationship between non-academic reading habits and self-reported academic success among 24 undergraduate students.
- Results found no correlation between students' scores on assessments of reading habits and academic self-confidence.
- The study was limited by its small sample size but provides a basis for further investigation using a larger, more diverse sample that could potentially yield different results.
This document discusses the social construction of gender and sexism. It begins with an activity asking participants to reflect on how they performed their gender that day. It then discusses how gender is defined differently in other cultures, providing examples of eunuchs, hijras, and the socialization of children along gender lines. The document also covers patriarchy and how it influences sexism. Examples are given of sexism in the media and cultural norms. Throughout, it prompts reflection on how gender stereotypes can be challenged to reduce harmful impacts.
The document discusses a city's proposal to co-locate a newly built Walmart and the town's public library in Grandtown. The plan aims to renovate the library but local residents disapprove of a Walmart location. There are advantages like close proximity but also disadvantages like noise conflicts. As a future public manager, the author does not support the plan due to contradictory relationships between a library and store. A town hall meeting is needed to discuss resident opinions and have an vote on the proposal.
This document provides an overview of Big Brothers Big Sisters of Eastern Missouri, a nonprofit youth mentoring organization. It details the organization's mission, vision, history, services, and operational structure. Some key points:
- The organization's goal is to ensure underprivileged children ages 5-17 have opportunities to develop friendships with role models to combat challenges like poverty.
- Services include one-to-one mentoring relationships using a model that engages parents, mentors, teachers and others.
- Founded in 1904 in St. Louis, the organization aims to build trusting relationships that support young people and transform lives.
- Operational areas described include child safety protocols, enrollment processes,
Big Brothers, Big Sisters of Eastern Missouri provides mentoring relationships to support young people and transform lives. Founded over 100 years ago, it began as separate organizations for boys and girls that later merged. The organization uses consultants, lobbyists, and contractors to improve services, though employees have limited interaction with them. Contractors could be hired for construction projects, lobbyists to influence legislation, and consultants for management changes, if sufficient funding is available.
Big Brothers, Big Sisters of Eastern Missouri PP slides (1)
Bradley Budget Report with corrections-1
1. Bradley,Cassandra
PAPA 530-501
Local Budget Report: Naperville, Illinois
Naperville, a suburb within Chicago, IL, with 141,853 residents is bisected in the DuPage
and Will counties within the State of Illinois (Naperville.il.us). The Naperville, Illinois Annual
Operating Budget (Fiscal Year 2014-2015), has further explained how the great recession has
slightly impacted the city of Naperville’s budget, but the government of Naperville, Illinois has
consistently improved since the 2008-2009 recession.
The 2014-2015 Naperville, IL Annual Operating Budget was developed to meet the fiscal
needs of the government of Naperville, Illinois. The budget was designed by the Finance
Department; mostly by Karen DeAngelis (Director of Finance).
As discussed in the transmittal letter (economic outlook section) within the 2014-2015
Naperville, IL Annual Operating Budget, Mayor A. George Pradel explained with the mere
budget about various factors currently affecting the city’s budget for the 2014-2015 fiscal year.
First, the usage of property tax has “delayed the impact of the economic decline,” especially
affecting the Naperville, IL’s EAV (Equalized Assessed Value) which “fell by a total of 17.7%
over the last four years.” In regards to the property tax affecting economic hardship within the
government of the Naperville, IL “like the rest of the country, home values have declined due to
recession” (“2015 Annual Operating Budget”). Figuratively speaking, property taxes have
decreased by $7 million dollars in the fiscal year 2014 budget as well as the “general corporate
property tax revenue is reduced by $2.8 million” (“2015 Annual Operating Budget”).
Shockingly, the EVA can encounter a possible decrease of “2% again the following year before
it stabilizes” (“2015 Annual Operating Budget”). The main reason for the city of Naperville’s
EAV decline is due to the constant rate of the property tax has to be “reduced by the same
percentage as the EAV decline” (“2015 Annual Operating Budget”). In a positive light, the city
2. Bradley,Cassandra
PAPA 530-501
of Naperville, IL can achieve a successful real estate market since “the rebounding real estate
sales market provides confidence in the underlying recovery of both the housing and commercial
property markets” (“2015 Annual Operating Budget”).
Another issue facing the city of Naperville, IL is the electric utility. In the fiscal year
2015, the electric utility is “lower than prior years” and is currently facing a limitation of staff
recommendations for the purpose of fund borrowing “for the capital projects over the next 5
years” (“2015 Annual Operating Budget”). In addition, in May 2013, “a 2% rate increase” was
granted but the rate increase did not financially “cover current operating expenses;” thus, the
electric utility has generated a negative aspect in the fiscal year 2014. Naperville, IL residents
can encounter possible high electricity bills or will not be able to receive electricity if the city of
Naperville can’t be able to financially support the electric utility in the current budget, hence
financial changes has to be met. Also, it is extremely important to reminder that if the electric
utility budget is not met, then the residents of Naperville can encounter heating problems
(especially during the winter months).
Third, within the fiscal year 2015 budget proposal indicated a financial instability in
which a $9 million financial reduction due to the “absence of the one-time $6 million pension
contribution from FY14” which was initially caused by “underlying operating cost increases
including salary and benefit, pension contributions, and vehicle replacement costs” (“2015
Annual Operating Budget”). This occurrence can present a wide array of problems (including
layoffs, termination of jobs, quitting/leaving job, and etc.) for the city of Naperville, hence the
city has to ensure an effective budget is met, before these problems can potentially occur.
In a historical context, the city of Naperville is still considered a “thriving, suburban
community” but “remained a small rural-based town from 1831-1864” (Naperville History).
3. Bradley,Cassandra
PAPA 530-501
Originally consisting of “steel and glass centers built for commerce and technology-based
industries, meandering neighborhoods, and a vibrant downtown shopping district” but before the
city of Naperville can be classified as a ‘city,’ the building of the Naperville railroad in the late
1800’s as well as “the relocation of North Western (referred to as North Central) College in the
late 1800’s, but Naperville “grew and matured as a town” (Naperville History). Initially
discovered by Joseph Naper along with a small group of eager families began to tap into the
city’s potential growth, by building the “original 80 acres surveyed, platted, and registered by
Joseph Naper with the State of Illinois in 1842” to soon becoming a “collection of
neighborhoods with a population of more than 140,000” (Naperville History).
Figure 1: General Fund Revenue by Source, FY 2014-2015
29%
15%
11%
3%
General Fund Revenues by Source, FY 2014-2015
Sales Tax
General Property Tax
State Income Tax
Real Estate Transfer Tax
4. Bradley,Cassandra
PAPA 530-501
General Fund Revenues
Figure 1 show the percentages of general fund revenues by source (FY 2014-2015). If
you closely examine, you can clearly see the following five largest taxes are: sales tax, general
property tax, state income tax, and real estate transfer tax (“2015 Annual Operating Budget”).
However, the sales tax is the highest general fund revenue, along with general property tax and
state income tax, respectively. Lastly, the remaining general fund revenue, the real estate transfer
tax is the lowest general fund revenue within the city’s budget.
Specifically, the general fund revenues had a difference of variation of growth rates for
the different fund revenues. If you look at Figure 1, you can see that the sales tax revenue is
expected to increase by 3.87% in the 2014-2015 fiscal year. The reason behind the sales tax
growth rate is, in the fiscal year 2013, the sales tax “set a record high” and repeated the same
record, by accumulating “over 32 million” in sales in the fiscal year 2014 (“2015 Annual
Operating Budget”). For the general property tax were expected to decrease by 9.56% in 2015.
The decline in property tax can be attributed to the 2008-2009 recession and a declining real
estate market during the recession greatly affected home-owners (including their home value)
within the city of Naperville. For example, the city’s budget endured a heavy affect towards the
real estate market since it “fell during the general economic recession by an average of 5.1% for
the most recent three years” (“2015 Annual Operating Budget”). The state income tax has
experienced a decrease by 3.30% within the 2015 fiscal year. In a similar fashion to the general
property tax’s decline, the state income tax’s decline was “due to the high state unemployment
rate and the overall weak economy the income tax allocation” unfortunately “declined for the
three year period FY09 to FY11” (“2015 Annual Operating Budget”). In addition, the state
income tax’s budget mainly in 2014 is “slightly below the prior year actual collections” (“2015
5. Bradley,Cassandra
PAPA 530-501
Annual Operating Budget”). Lastly, for the real estate transfer tax also experienced a decrease of
15.53% in 2015. Also, this tax is “directly linked to housing sales” but additionally experienced
a sharp decline, which occurred “significantly over the period FY07 to FY10 with subprime
mortgage defaults, foreclosures, reduction in sales and reduction in sale prices” (“2015 Annual
Operating Budget”).
The city of Naperville accumulates its general fund revenues from sales tax, general
property tax, state income tax, and real estate transfer tax. The equity of the sales tax is
regressive on a socio-economic scale, since the equity has to “distribute effective tax rates across
income groups” (Powerpoint). You have to understand that the city of Naperville is an upper-
middle class/wealthy residential population with a low percentage of lower-middle class
residents, at 4.3% living in poverty (U.S. Census). Basically, lower-middle class residents have a
tendency of spending a considerable (larger) portion of their annual income than upper-
middle/wealthy residents, since they spend a smaller portion of their annual income. For
example, in the table (Effective Tax Rates of Fed. Inc. Tax and Proposed National Sales Taxes),
if a lower-middle individual has an annual income between 5,000 to 10,000, then their national
sales tax is 25.5 but if an upper-middle class/wealthy individual, then their national sales tax is
9.7 (Powerpoint). The equity of general property tax on residential property can be considered
regressive, since some resident’s (lower-middle class and middle class) wealth is accumulated
from the housing sector, in accordance to the U.S. Census, about 75% own their own house (U.S.
Census). But, the upper-middle class have additional access to other financial investments (e.g.
owning a business), than housing. Also, the general property tax on commercial property in the
city of Naperville is progressive. The equity of the state income tax and real estate transfer tax is
likely to be regressive. The sales tax, general property tax, state income tax and real estate
6. Bradley,Cassandra
PAPA 530-501
transfer tax are the only equitable revenues sources in the city of Naperville from an Ability-to-
Pay principle since the residents of the Naperville area are mostly upper-middle class; thus, they
will encounter a higher percentage of taxes due to their income level(s). The utility tax,
telecommunications tax, and hotel/motel tax are the equitable revenues resources from a Benefit
principle since “some revenue is derived from payments by recipients for services rendered or
benefits received” (Lee, Johnson, & Joyce, pg. 137). In addition, those specific revenues greatly
apply to the Benefit principle, since payable taxes coincide with useable services that the city of
Naperville’s residents utilize. Also, a majority of the city of Naperville’s residents consist of
upper-middle class households; thus, are financially stabilized to buy goods and services at the
same time, be able to pay taxes. So, the utility tax, telecommunications tax, and hotel/motel tax
are able to ‘benefit’ to the city of Naperville, since the tax is giving and receiving to support one
another.
7. Bradley,Cassandra
PAPA 530-501
Figure 2: General Fund Expenditures by Department, FY 2014-2015
Budget Allocation Areas
The 2015 Annual Operating Budget shows the general fund expenditures by department
in the 2014-2015 fiscal year. Figure 2 shows the percentages of the general fund expenditures
attributable by department in the 2015. A majority of the general fund expenditures is
attributable to the Police Department, the Fire Department, and the Department of Public Works.
We can see that one (the Fire Department) out of the five departments remained in a stable
condition since this specific department was expected to increase by 1.9% in the 2015 fiscal year.
But, the Police Department, Department of Public Works, the Transportation & Engineering
Department (TED), and the Finance Department did not remain stable in the 2014-2015 fiscal
year. The Police Department’s fund expenditure decreased by 5.14% in 2015, along with the
Department of Public Works, which decreased by 1.69% as well as the Transportation &
Engineering Department (TED) experienced a decrease by 9.72%. Lastly, the Finance
Department indicated a severe decrease of 68.77%. Within the Executive Summary of the city’s
32%
26%
20%
7%
General Fund Expenditures by Department, FY
2014-2015
Police Department
Fire Department
Department of Public Works
Transporation & Engineering
Department (TED)
8. Bradley,Cassandra
PAPA 530-501
budget report, the following departments: Police Department, Fire Department, Department of
Public Works, TED, and the Finance Department was not identified.
Major Capital Projects
The Capital Improvement Project (CIP) details the major capital project expenditures
“planned over the next five years,” including a “listing of potential projects for the next fifteen
years” (“2015 Annual Operating Budget”). Currently, the city of Naperville’s capital
improvement projects budget is $54 million dollars (“2015 Annual Operating Budget”). Just
recently, in the year of 2013, the Marriott Hotel became a success to the city of Naperville, which
in turn, “increased hotel taxes” (“2015 Annual Operating Budget”). In addition, the city has
decided to utilize “underlying improvement in the business area” as well as an “increased
permits and license revenue reflecting increased development activity in the city” (“2015 Annual
Operating Budget”). In the near future, precisely 2016 and beyond, the city of Naperville is
utilizing a “new construction home sales activity” phase which is designed to increase the
property tax. In the upcoming year of 2016, a series of construction projects (mostly,” buildings,
renovations, and road work”) are planned for the city of Naperville (Baker, 2016). Specifically,
the Naperville Public Library and Naperville Park District are the newest building construction
projects slated for completion in 2016 (Baker, 2016). In addition, the Frontier Sports Complex,
“one of the key capital projects in 2016,” the Knoch Park Central Maintenance Facility,
Huntington Estates Park, Old Sawmill Park, and Walnut Ridge Park are slated for renovation
purposes in 2016 (Baker, 2016). For roadwork construction projects, Route 59 and Interstate 88
has been completed, but the city is planning a “beautification phase in 2016, which will include
sidewalks, bike trails, and landscaping” (Baker, 2016). Additionally, the South Washington Street
Bridget (South of Ring Road) is “slated to start in June” for the purpose of road widening in
9. Bradley,Cassandra
PAPA 530-501
order to improve for “pedestrian and bicycle safety” (Baker, 2016). Bob Kozurek (Deputy City
Engineer) informed the Chicago Tribune about the road work projects for the city as noted in the
text, “we will have a full plate of road maintenance and micro-surfacing in the summer” (Baker,
2016).
Further Questions
It would be extremely interesting to learn about how the Naperville budget compares to
those of other cities in the Illinois regions in terms of their revenues, expenditures, and major
capital projects. Regarding the general fund revenues, it is important to note that the 2014-2015
Naperville budget shows potential fault lines. For example, general property tax revenue was
projected to decrease by 9.56% in 2014-2015 due to the ripple effect of the 2008-2009 recession
on assessed property value. Is the city of Naperville effectively prepared to handle an economic
downturn that may occur, which would lead to another drop in real estate value? Also, how is the
current city’s budget going to be effectively handling the recent Illinois financial budget crisis?
Will this financial budget crisis severely affect the city of Naperville’s real estate to the point
where current Naperville residents have to relocate? If so, does the city of Naperville have a plan
of action? As for the general fund expenditures, if you glance at the figure 2 (general fund
expenditures by department, FY 2014-2015), you can see the following departments: Police
Department, Department of Public Works, the Transportation & Engineering Department, and
Finance Department have indicated sharp decreases for their general fund expenditures in 2015.
But, why is that? Does the city of Naperville feel as if these particular departments are not
important to fund? Lastly, pertaining to major capital projects for the city of Naperville, since the
current major capital project expenditures’ budget is $54 million, with newly planned
construction projects in tow, is the city going to be financially stabilized these major capital
10. Bradley,Cassandra
PAPA 530-501
projects? Also, how will the city be able to effectively handle the major capital projects currently
in tow for the future? Will the city provide an official document to the general public (mainly the
residents of Naperville) explaining how the city (in relation to the current Illinois financial
budget crisis) will be able to handle any future major capital projects?
11. Bradley,Cassandra
PAPA 530-501
References
Baker, Suzanne. 2016 preview: Construction projects ramping up in Naperville. Chicago
Tribune. 1 Jan 2016. Web. http://www.chicagotribune.com/suburbs/naperville-
sun/news/ct-nvs-naperville-look-ahead-st-0103-20160101-story.html
Lee Jr., Robert D., Johnson, Ronald W., Joyce, Phillip G. Public Budgeting Systems. 2013. New
York, NY: Jones & Bartlett Publishers.
Naperville. City of Naperville, Illinois. 2015 Annual Operated Budget. Naperville:, 2015. Web.
https://www.naperville.il.us/emplibrary/FY15AOBadopted.pdf
Naperville. Naperville Demographics. City of Naperville, Illinois. 2011. Naperville:, 2011. Web.
http://www.naperville.il.us/demographics.aspx
Naperville. History of Naperville. City of Naperville, Illinois. 2015. Naperville:, 2015. Web.
http://www.naperville.il.us/emplibrary/chapterb_history.pdf
United States Census Bureau. Quickfacts of Naperville, Illinois. 2015. U.S.A. Web.
http://www.census.gov/quickfacts/table/PST045215/1751622