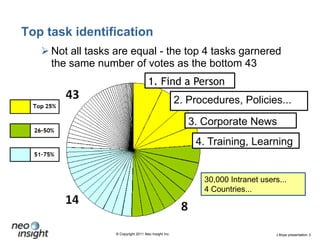
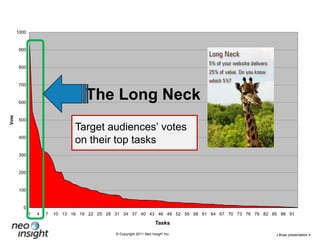
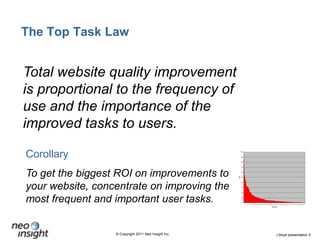
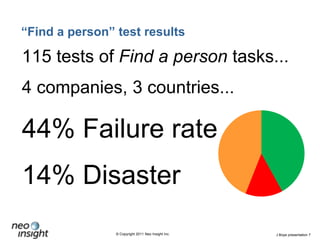
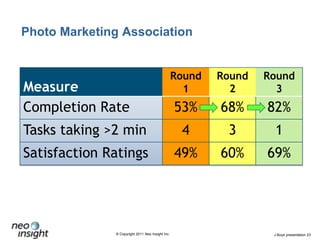
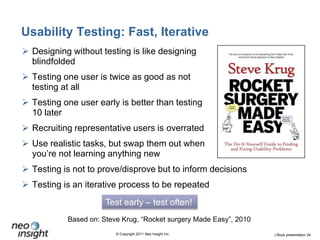
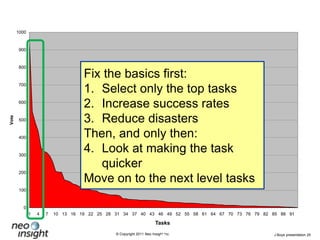
First Things First: Fix the Tasks!Mike AtyeoJ Boye PresentationWednesday May 4, 2011V1.0
Mike AtyeoContactsPhone	(613) 271-3001Email 	info@neoinsight.comWeb	www.neoinsight.comMail	Suite 374	300 Earl Grey Drive	Ottawa, Ontario	Canada  K2T 1C1Strategic design(613) 271-3001 x101mike@neoinsight.comGord HopkinsUser Experience Specialist (613) 271-3001 x102gord@neoinsight.comScott SmithCompetitive strategy (613) 271-3001 x103scott@neoinsight.comLisa FastExperience Designer (613) 271-3001 x104lisa@neoinsight.com
Top task identificationNot all tasks are equal - the top 4 tasks garnered the same number of votes as the bottom 431. Find a Person2. Procedures, Policies...3. Corporate News4. Training, Learning30,000 Intranet users... 4 Countries...
The Long NeckTarget audiences’ votes on their top tasksTasks4
The Top Task LawTotal website quality improvement is proportional to the frequency of use and the importance of the improved tasks to users. CorollaryTo get the biggest ROI on improvements to your website, concentrate on improving the most frequent and important user tasks.
Aside...http://www.slideshare.net/lrosenfeld/redesign-must-die
“Find a person” test results115 tests of Find a person tasks...4 companies, 3 countries...44% Failure rate14% Disaster
Mary Meeker, 2010
Why Test? Why test behaviour?You are not your userOpinion-wars waste time and moneyManagement responds to measurement Users’ expectations and technology are both changing too rapidly to rely on our past experience aloneSmall changes can make a big differenceEven professionals are never certain of the resultsWeb visitors are real people with things they want to doTo obtain objective, continuous measuresWhen people look at a page, they see things differently than when they use a pageUsers cannot explain their own behaviour
279%
Why Test? Why test behaviour?You are not your userOpinion-wars waste time and moneyManagement responds to measurement Users’ expectations and technology are both changing too rapidly to rely on our past experience aloneSmall changes can make a big differenceEven professionals are never certain of the resultsWeb visitors are real people with things they want to doTo obtain objective, continuous measuresWhen people look at a page, they see things differently than when they use a pageUsers cannot explain their own behaviour
Exercise: Concentrationhttp://www.youtube.com/watch?v=IGQmdoK_ZfY&feature=player_embedded
Why Test? Why test behaviour?You are not your userOpinion-wars waste time and moneyManagement responds to measurement Users’ expectations and technology are both changing too rapidly to rely on our past experience aloneSmall changes can make a big differenceEven professionals are never certain of the resultsWeb visitors are real people with things they want to doTo obtain objective, continuous measuresWhen people look at a page, they see things differently than when they use a pageUsers cannot explain their own behaviour
almost no fixations within advertisementsusers don't fixate within design elements that resemble adsHeatmaps from eyetracking studies: The areas where users looked the most are coloredred; the yellow areas indicate fewer views, followed by the least-viewed blue areas. Gray areas didn't attract any fixations. Green boxes were drawn on top of the images after the study to highlight the advertisements.http://www.useit.com/alertbox/banner-blindness.html
Why Test? Why test behaviour?You are not your userOpinion-wars waste time and moneyManagement responds to measurement Users’ expectations and technology are both changing too rapidly to rely on our past experience aloneSmall changes can make a big differenceEven professionals are never certain of the resultsWeb visitors are real people with things they want to doTo obtain objective, continuous measuresWhen people look at a page, they see things differently than when they use a pageUsers cannot explain their own behaviour
Where the participants looked: eye-trackingQuantitative task study showed what happened.
The eyetracking revealed the why.
People tended not to look at the ‘faces’ boxes.
Despite the fact that a high proportion of the gazes are to the right hand side.
And the layout of the page directs attention to the right.
Note that they didn’t glance at the image and ignore it – they didn’t even look at it.
So this happens subconsciously: people aren’t making a conscious decision to ignore the image.
And it happens very quickly – within milliseconds.Tullis, T., Siegel, M & Sun, E. (2009) Proceedings of the 27th International Conference on Human Factors in Computing Systems,  Boston, MA.
Why Test? Why test behaviour?You are not your userOpinion-wars waste time and moneyManagement responds to measurement Users’ expectations and technology are both changing too rapidly to rely on our past experience aloneSmall changes can make a big differenceEven professionals are never certain of the resultsWeb visitors are real people with things they want to doTo obtain objective, continuous measuresWhen people look at a page, they see things differently than when they use a pageUsers cannot explain their own behaviour
Which version led to a 19% increase in purchases?AB
Additional navigation at the top of Version A helped convince 19% more visitors to purchase something.”“Clearly customers prefer more links to help them find their own desired path rather than being told what the promos of the day are...The deals damage sales!
Task Benchmarking: MetricsCompletion rates: percent of successful task completionsDisaster rates: percent of people who thought they’d completed the task successfully but had the wrong answerCompletion times Target times: estimated or based on another siteFrequency: estimated number of times a staff member completes the tasks during a given timePotential return: estimated money or time that can be saved by improving the efficiency of the tasksConfidence: self-rated – in disasters and in successBased on: http://www.customercarewords.com/task-performance-indicator.html

First Things First: Fix the Tasks!

  • 1.
    First Things First:Fix the Tasks!Mike AtyeoJ Boye PresentationWednesday May 4, 2011V1.0
  • 2.
    Mike AtyeoContactsPhone (613) 271-3001Email info@neoinsight.comWeb www.neoinsight.comMail Suite 374 300 Earl Grey Drive Ottawa, Ontario Canada K2T 1C1Strategic design(613) 271-3001 x101mike@neoinsight.comGord HopkinsUser Experience Specialist (613) 271-3001 x102gord@neoinsight.comScott SmithCompetitive strategy (613) 271-3001 x103scott@neoinsight.comLisa FastExperience Designer (613) 271-3001 x104lisa@neoinsight.com
  • 3.
    Top task identificationNotall tasks are equal - the top 4 tasks garnered the same number of votes as the bottom 431. Find a Person2. Procedures, Policies...3. Corporate News4. Training, Learning30,000 Intranet users... 4 Countries...
  • 4.
    The Long NeckTargetaudiences’ votes on their top tasksTasks4
  • 5.
    The Top TaskLawTotal website quality improvement is proportional to the frequency of use and the importance of the improved tasks to users. CorollaryTo get the biggest ROI on improvements to your website, concentrate on improving the most frequent and important user tasks.
  • 6.
  • 7.
    “Find a person”test results115 tests of Find a person tasks...4 companies, 3 countries...44% Failure rate14% Disaster
  • 8.
  • 9.
    Why Test? Whytest behaviour?You are not your userOpinion-wars waste time and moneyManagement responds to measurement Users’ expectations and technology are both changing too rapidly to rely on our past experience aloneSmall changes can make a big differenceEven professionals are never certain of the resultsWeb visitors are real people with things they want to doTo obtain objective, continuous measuresWhen people look at a page, they see things differently than when they use a pageUsers cannot explain their own behaviour
  • 10.
  • 11.
    Why Test? Whytest behaviour?You are not your userOpinion-wars waste time and moneyManagement responds to measurement Users’ expectations and technology are both changing too rapidly to rely on our past experience aloneSmall changes can make a big differenceEven professionals are never certain of the resultsWeb visitors are real people with things they want to doTo obtain objective, continuous measuresWhen people look at a page, they see things differently than when they use a pageUsers cannot explain their own behaviour
  • 12.
  • 13.
    Why Test? Whytest behaviour?You are not your userOpinion-wars waste time and moneyManagement responds to measurement Users’ expectations and technology are both changing too rapidly to rely on our past experience aloneSmall changes can make a big differenceEven professionals are never certain of the resultsWeb visitors are real people with things they want to doTo obtain objective, continuous measuresWhen people look at a page, they see things differently than when they use a pageUsers cannot explain their own behaviour
  • 14.
    almost no fixationswithin advertisementsusers don't fixate within design elements that resemble adsHeatmaps from eyetracking studies: The areas where users looked the most are coloredred; the yellow areas indicate fewer views, followed by the least-viewed blue areas. Gray areas didn't attract any fixations. Green boxes were drawn on top of the images after the study to highlight the advertisements.http://www.useit.com/alertbox/banner-blindness.html
  • 15.
    Why Test? Whytest behaviour?You are not your userOpinion-wars waste time and moneyManagement responds to measurement Users’ expectations and technology are both changing too rapidly to rely on our past experience aloneSmall changes can make a big differenceEven professionals are never certain of the resultsWeb visitors are real people with things they want to doTo obtain objective, continuous measuresWhen people look at a page, they see things differently than when they use a pageUsers cannot explain their own behaviour
  • 16.
    Where the participantslooked: eye-trackingQuantitative task study showed what happened.
  • 17.
  • 18.
    People tended notto look at the ‘faces’ boxes.
  • 19.
    Despite the factthat a high proportion of the gazes are to the right hand side.
  • 20.
    And the layoutof the page directs attention to the right.
  • 21.
    Note that theydidn’t glance at the image and ignore it – they didn’t even look at it.
  • 22.
    So this happenssubconsciously: people aren’t making a conscious decision to ignore the image.
  • 23.
    And it happensvery quickly – within milliseconds.Tullis, T., Siegel, M & Sun, E. (2009) Proceedings of the 27th International Conference on Human Factors in Computing Systems, Boston, MA.
  • 24.
    Why Test? Whytest behaviour?You are not your userOpinion-wars waste time and moneyManagement responds to measurement Users’ expectations and technology are both changing too rapidly to rely on our past experience aloneSmall changes can make a big differenceEven professionals are never certain of the resultsWeb visitors are real people with things they want to doTo obtain objective, continuous measuresWhen people look at a page, they see things differently than when they use a pageUsers cannot explain their own behaviour
  • 25.
    Which version ledto a 19% increase in purchases?AB
  • 26.
    Additional navigation atthe top of Version A helped convince 19% more visitors to purchase something.”“Clearly customers prefer more links to help them find their own desired path rather than being told what the promos of the day are...The deals damage sales!
  • 27.
    Task Benchmarking: MetricsCompletionrates: percent of successful task completionsDisaster rates: percent of people who thought they’d completed the task successfully but had the wrong answerCompletion times Target times: estimated or based on another siteFrequency: estimated number of times a staff member completes the tasks during a given timePotential return: estimated money or time that can be saved by improving the efficiency of the tasksConfidence: self-rated – in disasters and in successBased on: http://www.customercarewords.com/task-performance-indicator.html