Download to read offline

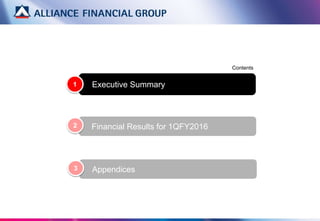
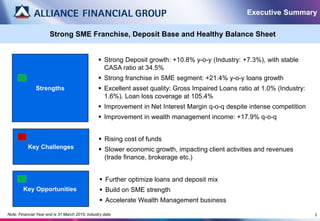

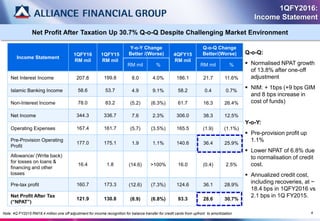
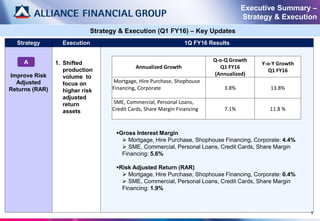
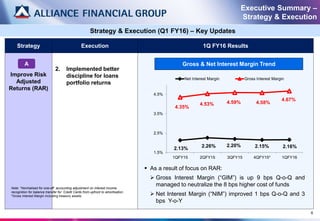
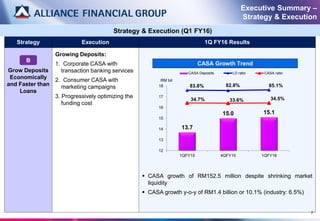
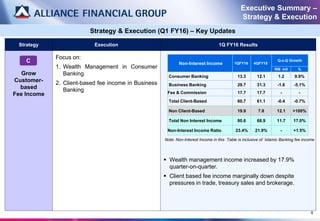

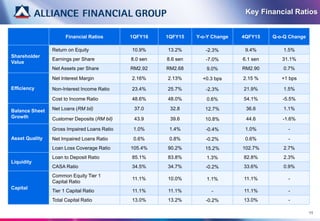
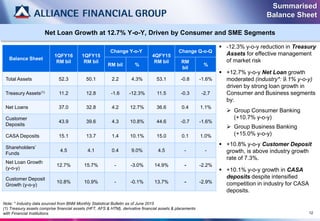
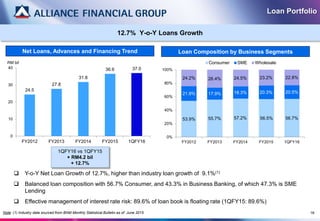
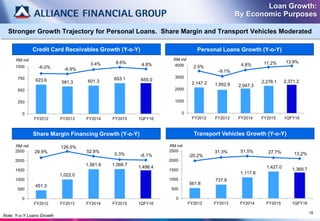
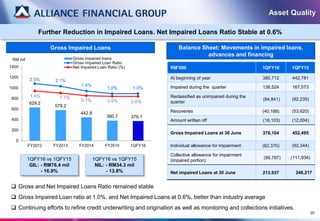

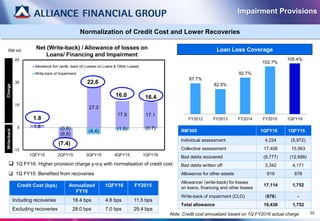
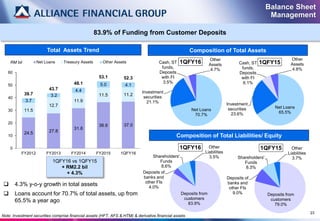
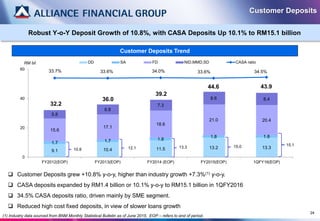
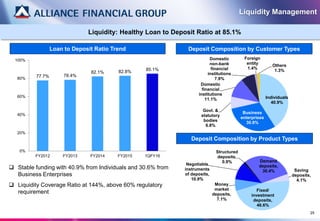
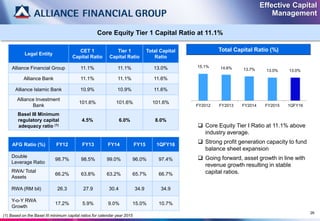
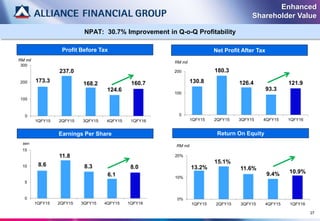
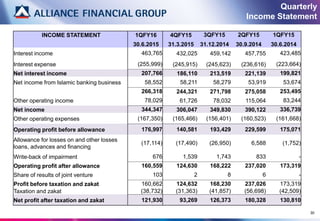
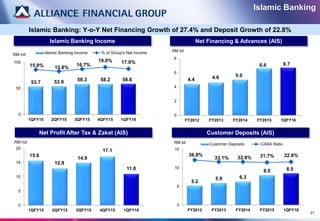
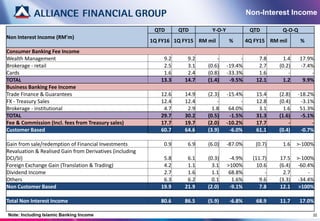

This document provides an executive summary and financial results for 1QFY2016: - Strong deposit and loan growth of 10.8% and 12.7% respectively due to strong SME franchise and consumer banking. Asset quality remains high with low impaired loan ratios. - Net profit grew 30.7% quarter-on-quarter due to higher net interest and non-interest income, though lower than previous year due to normalizing credit costs. - Key priorities for FY2016 include improving risk-adjusted returns, growing deposits faster than loans, and increasing fee-based income.