Download to read offline


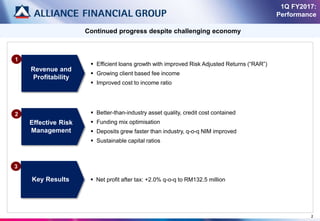
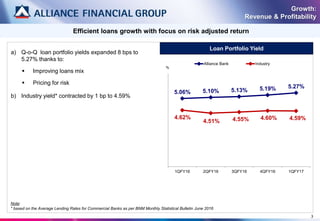
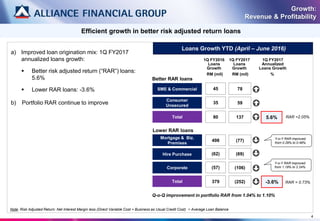
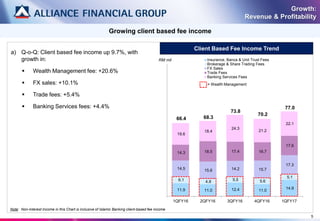
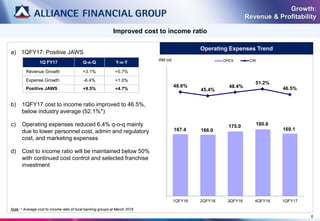
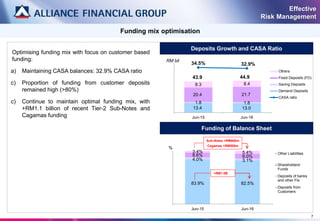
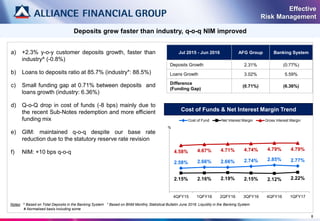
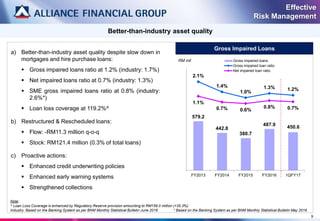
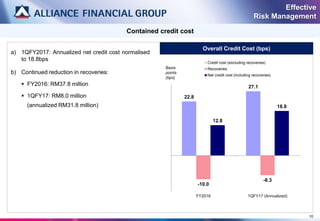
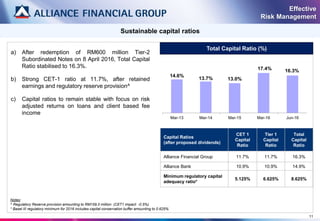
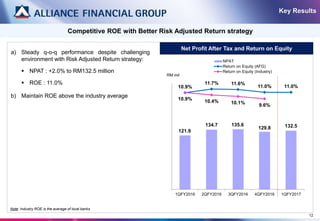
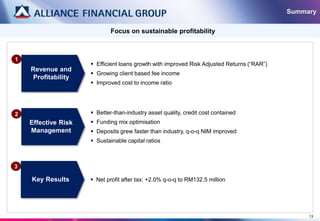
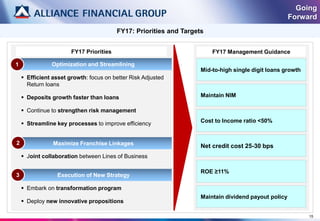
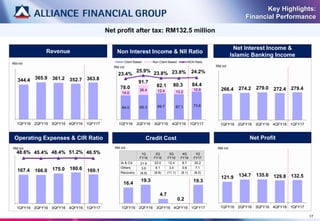
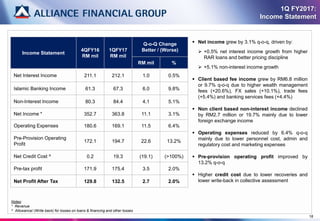

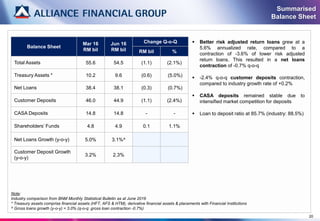
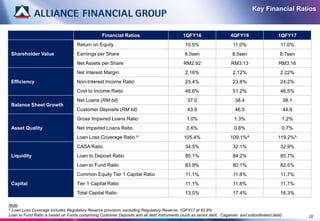

The document provides an analyst briefing on the company's 1Q FY2017 performance. Key points include: - Revenue and profitability grew with efficient loan growth focused on improved risk-adjusted returns and growing fee income. Cost-to-income ratio improved. - Asset quality was better than industry and credit costs were contained through effective risk management. Deposits grew faster than loans and net interest margin improved. - For FY2017, priorities are efficient growth in better risk loans, increasing deposits faster than loans, strengthening risk management, improving efficiency, and maintaining financial targets including ROE of at least 11%.