Download as PDF, PPTX

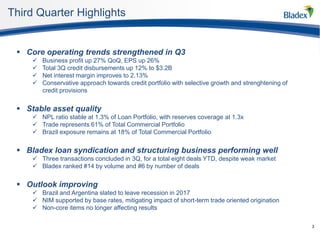
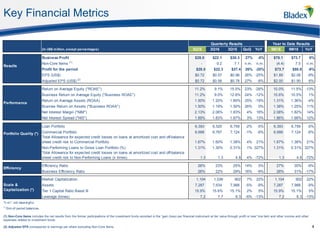
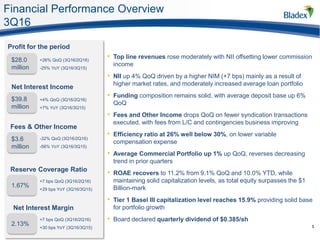
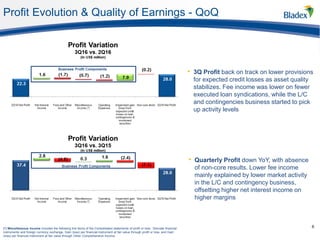
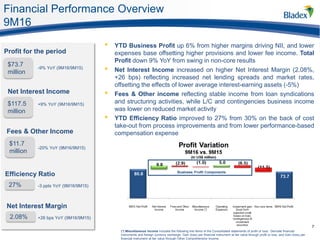
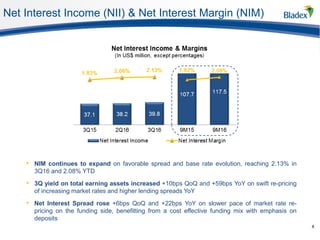
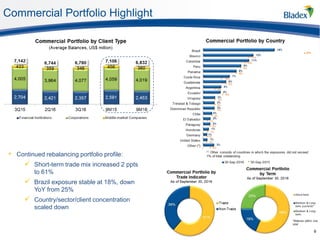
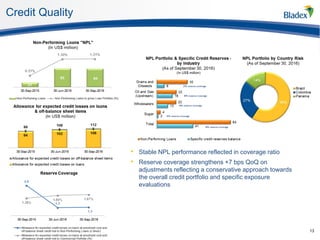
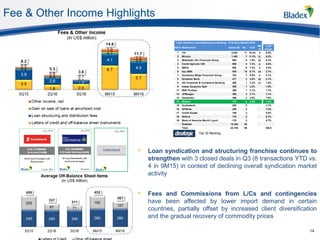
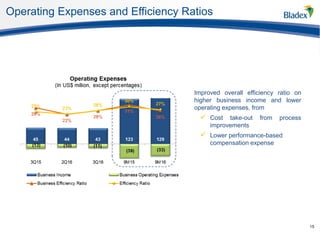
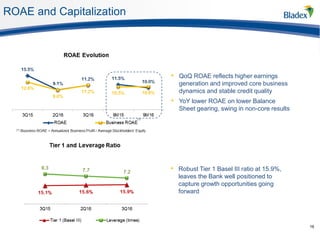
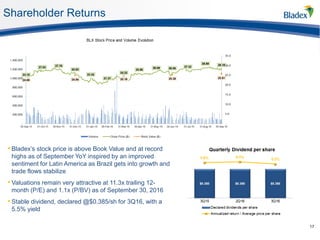


This presentation discusses the Bank's third quarter highlights and financial performance. Some key points: - Business profit increased 27% quarter-over-quarter and 6% year-to-date, driven by higher net interest income from margin expansion. - Net interest margin improved to 2.13% as interest rates increased, boosting the yield on earning assets. - Credit quality remained stable with non-performing loans at 1.31% of the portfolio and reserves covering 1.3x of non-performing loans. - The outlook is improving as Brazil and Argentina are expected to exit recession in 2017, which will support further growth in the bank's business.


