Download to read offline


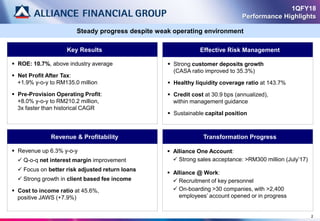
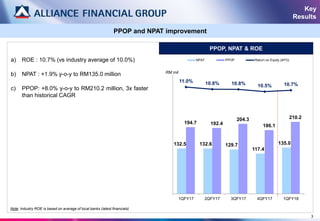
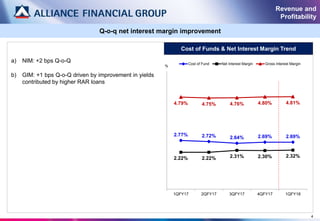
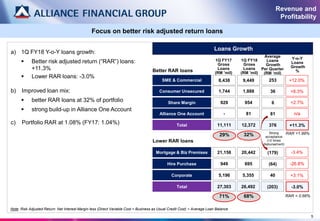
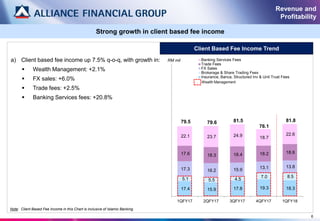
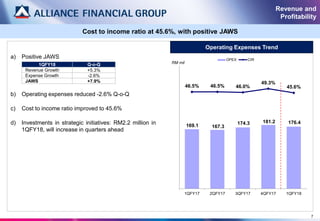
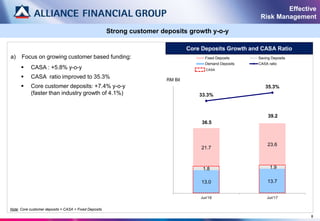
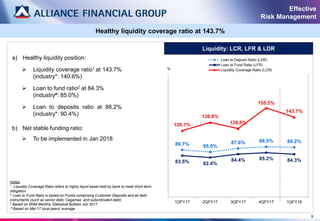
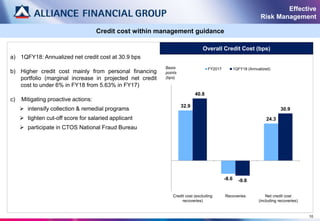

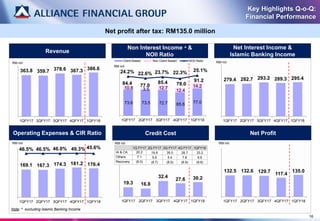
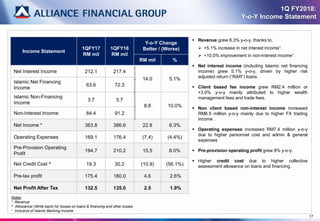
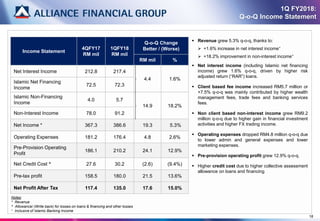
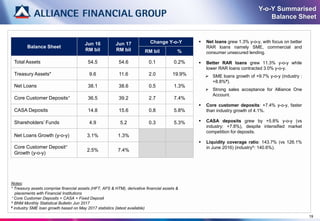
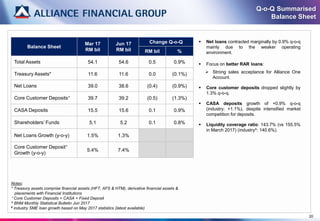
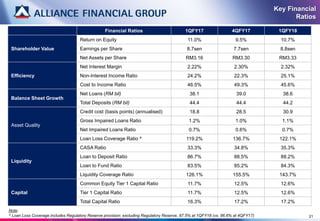

a) ROE of 10.7%, above industry average, with NPAT up 1.9% YoY and PPOP increasing 8.0% YoY, 3x faster than historical CAGR b) Revenue grew 6.3% YoY with improved NIM and client-based fee income, while costs declined 2.6% QoQ, lowering CIR to 45.6% c) Strong customer deposits growth and healthy liquidity coverage ratio of 143.7%, with credit costs within guidance at 30.9 bps annualized