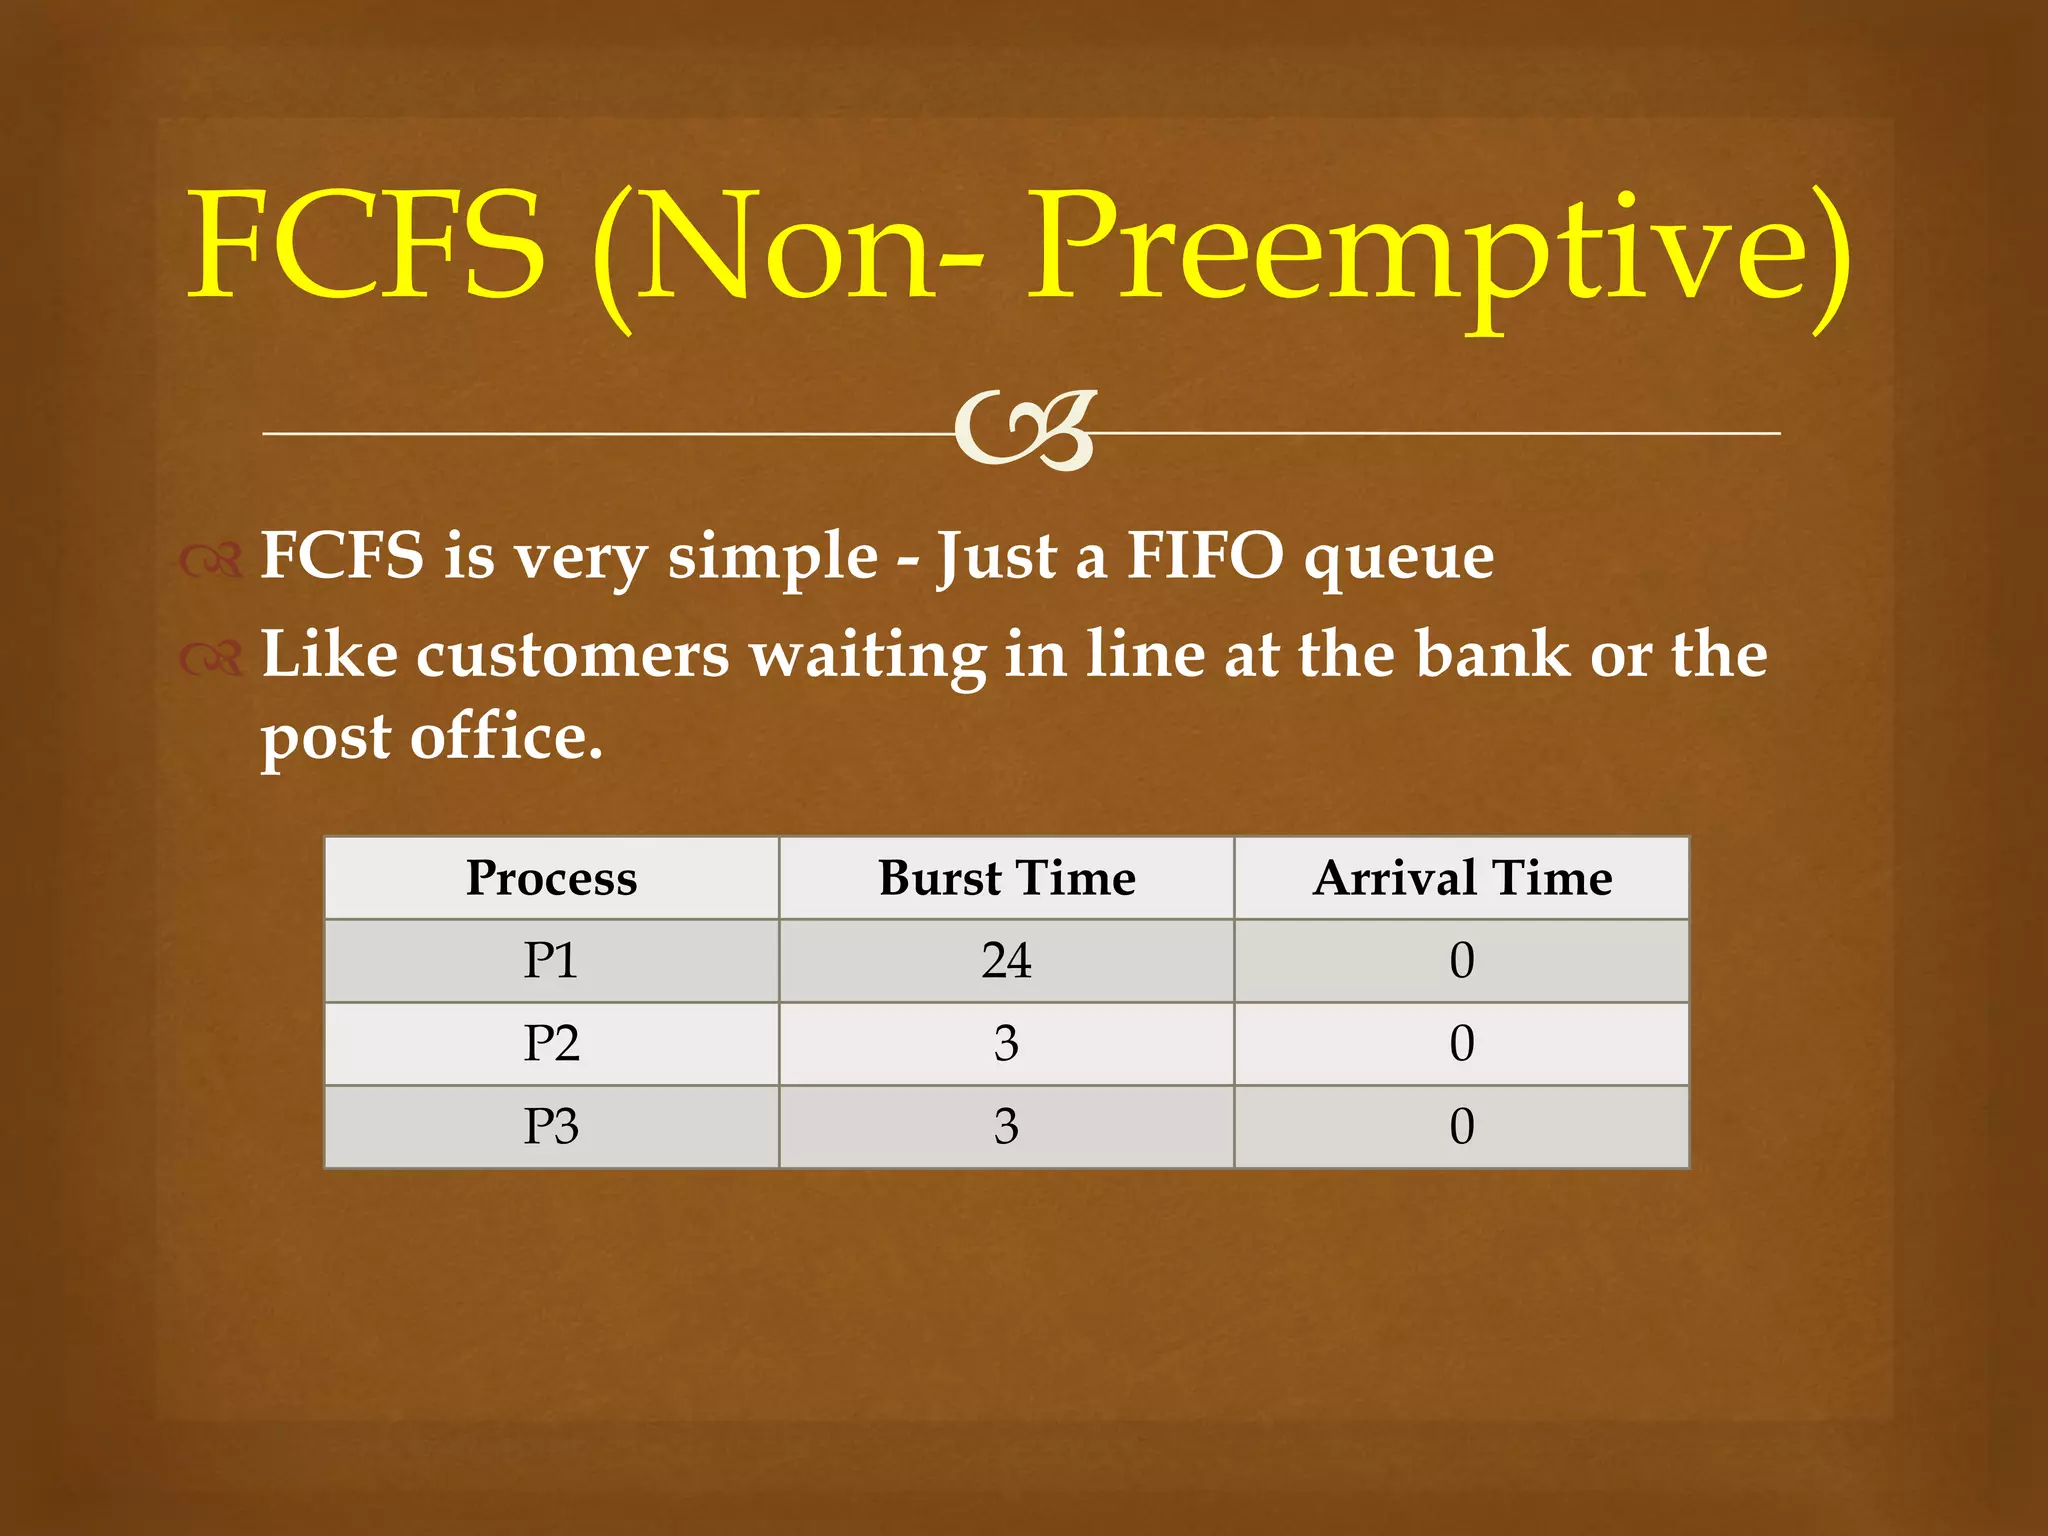
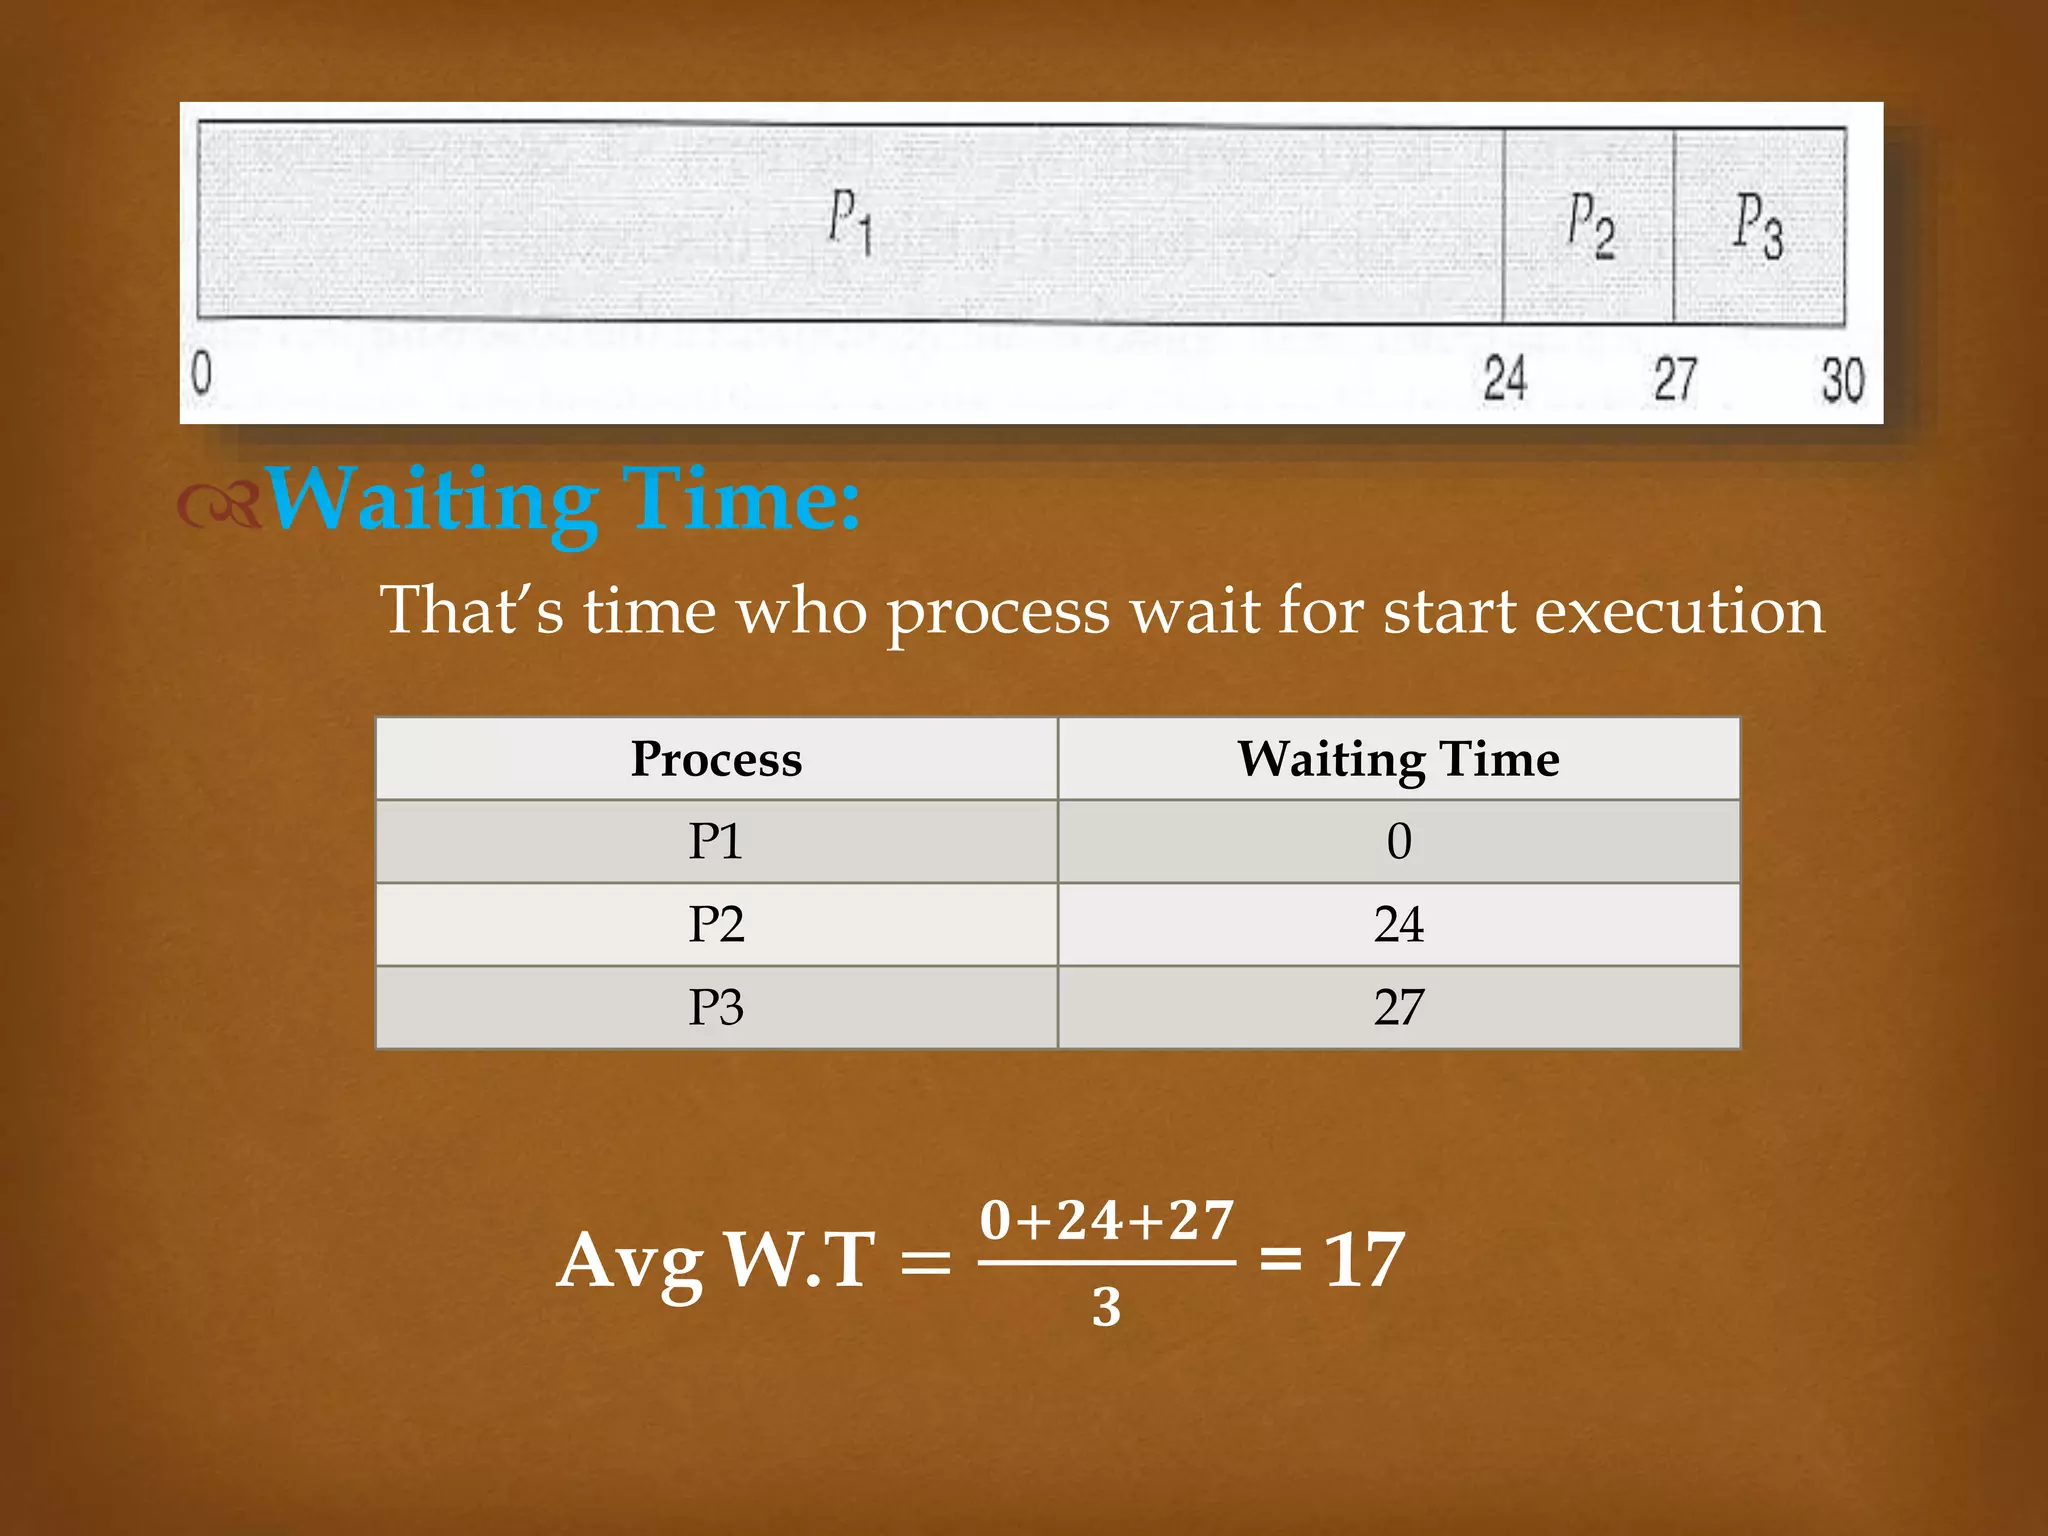
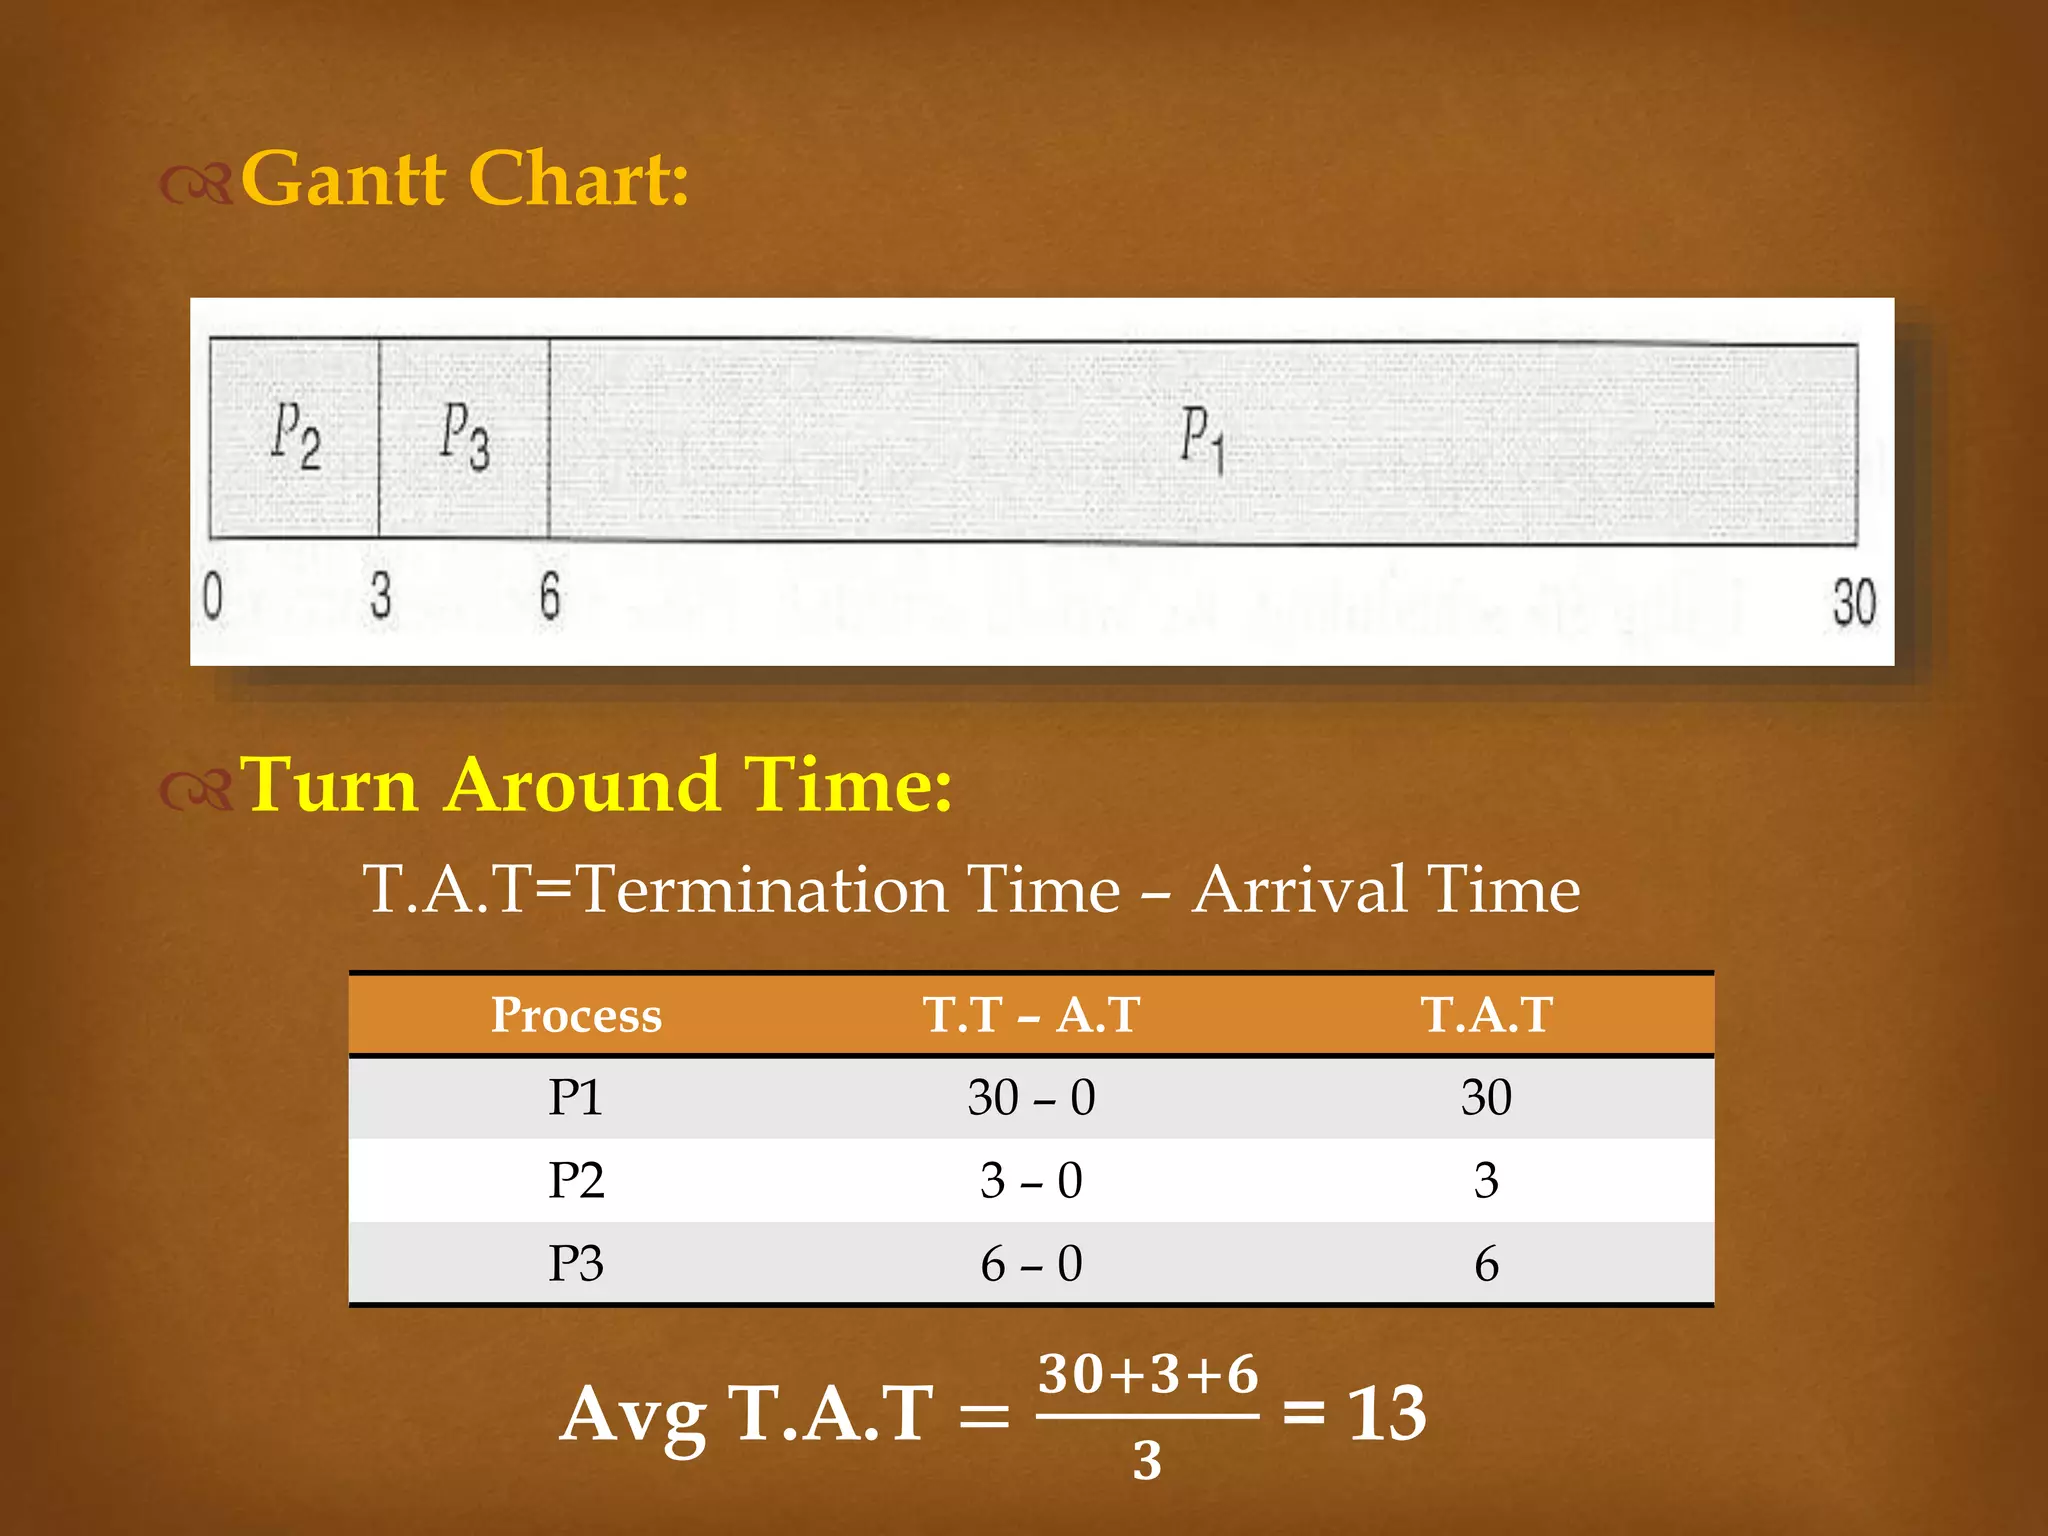
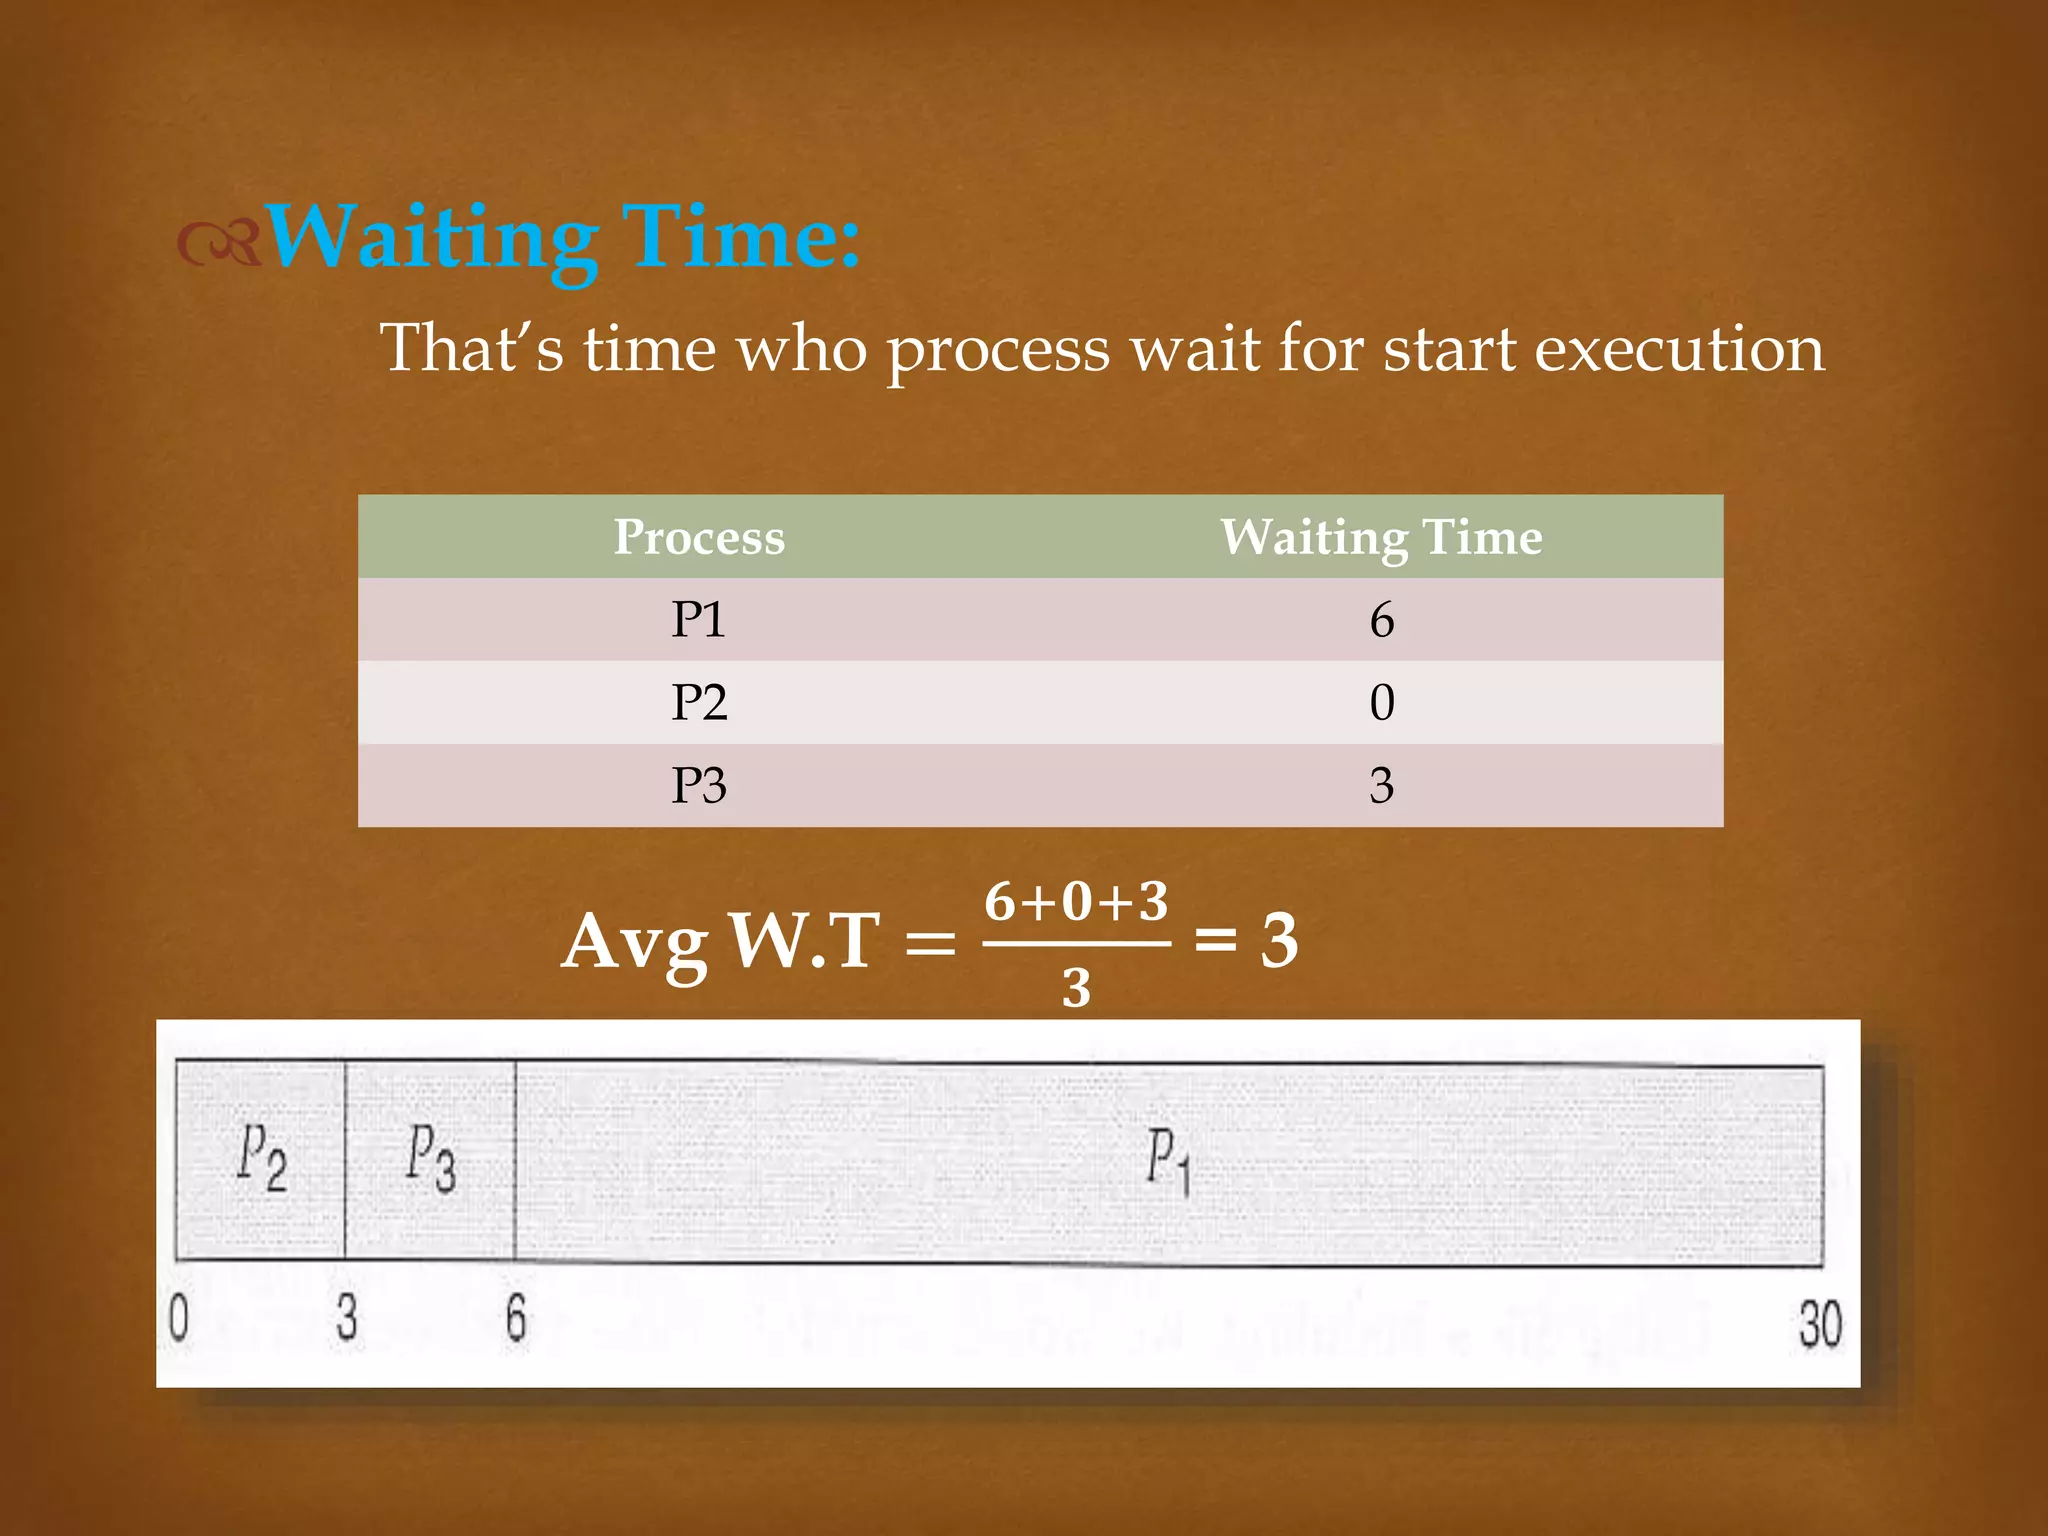
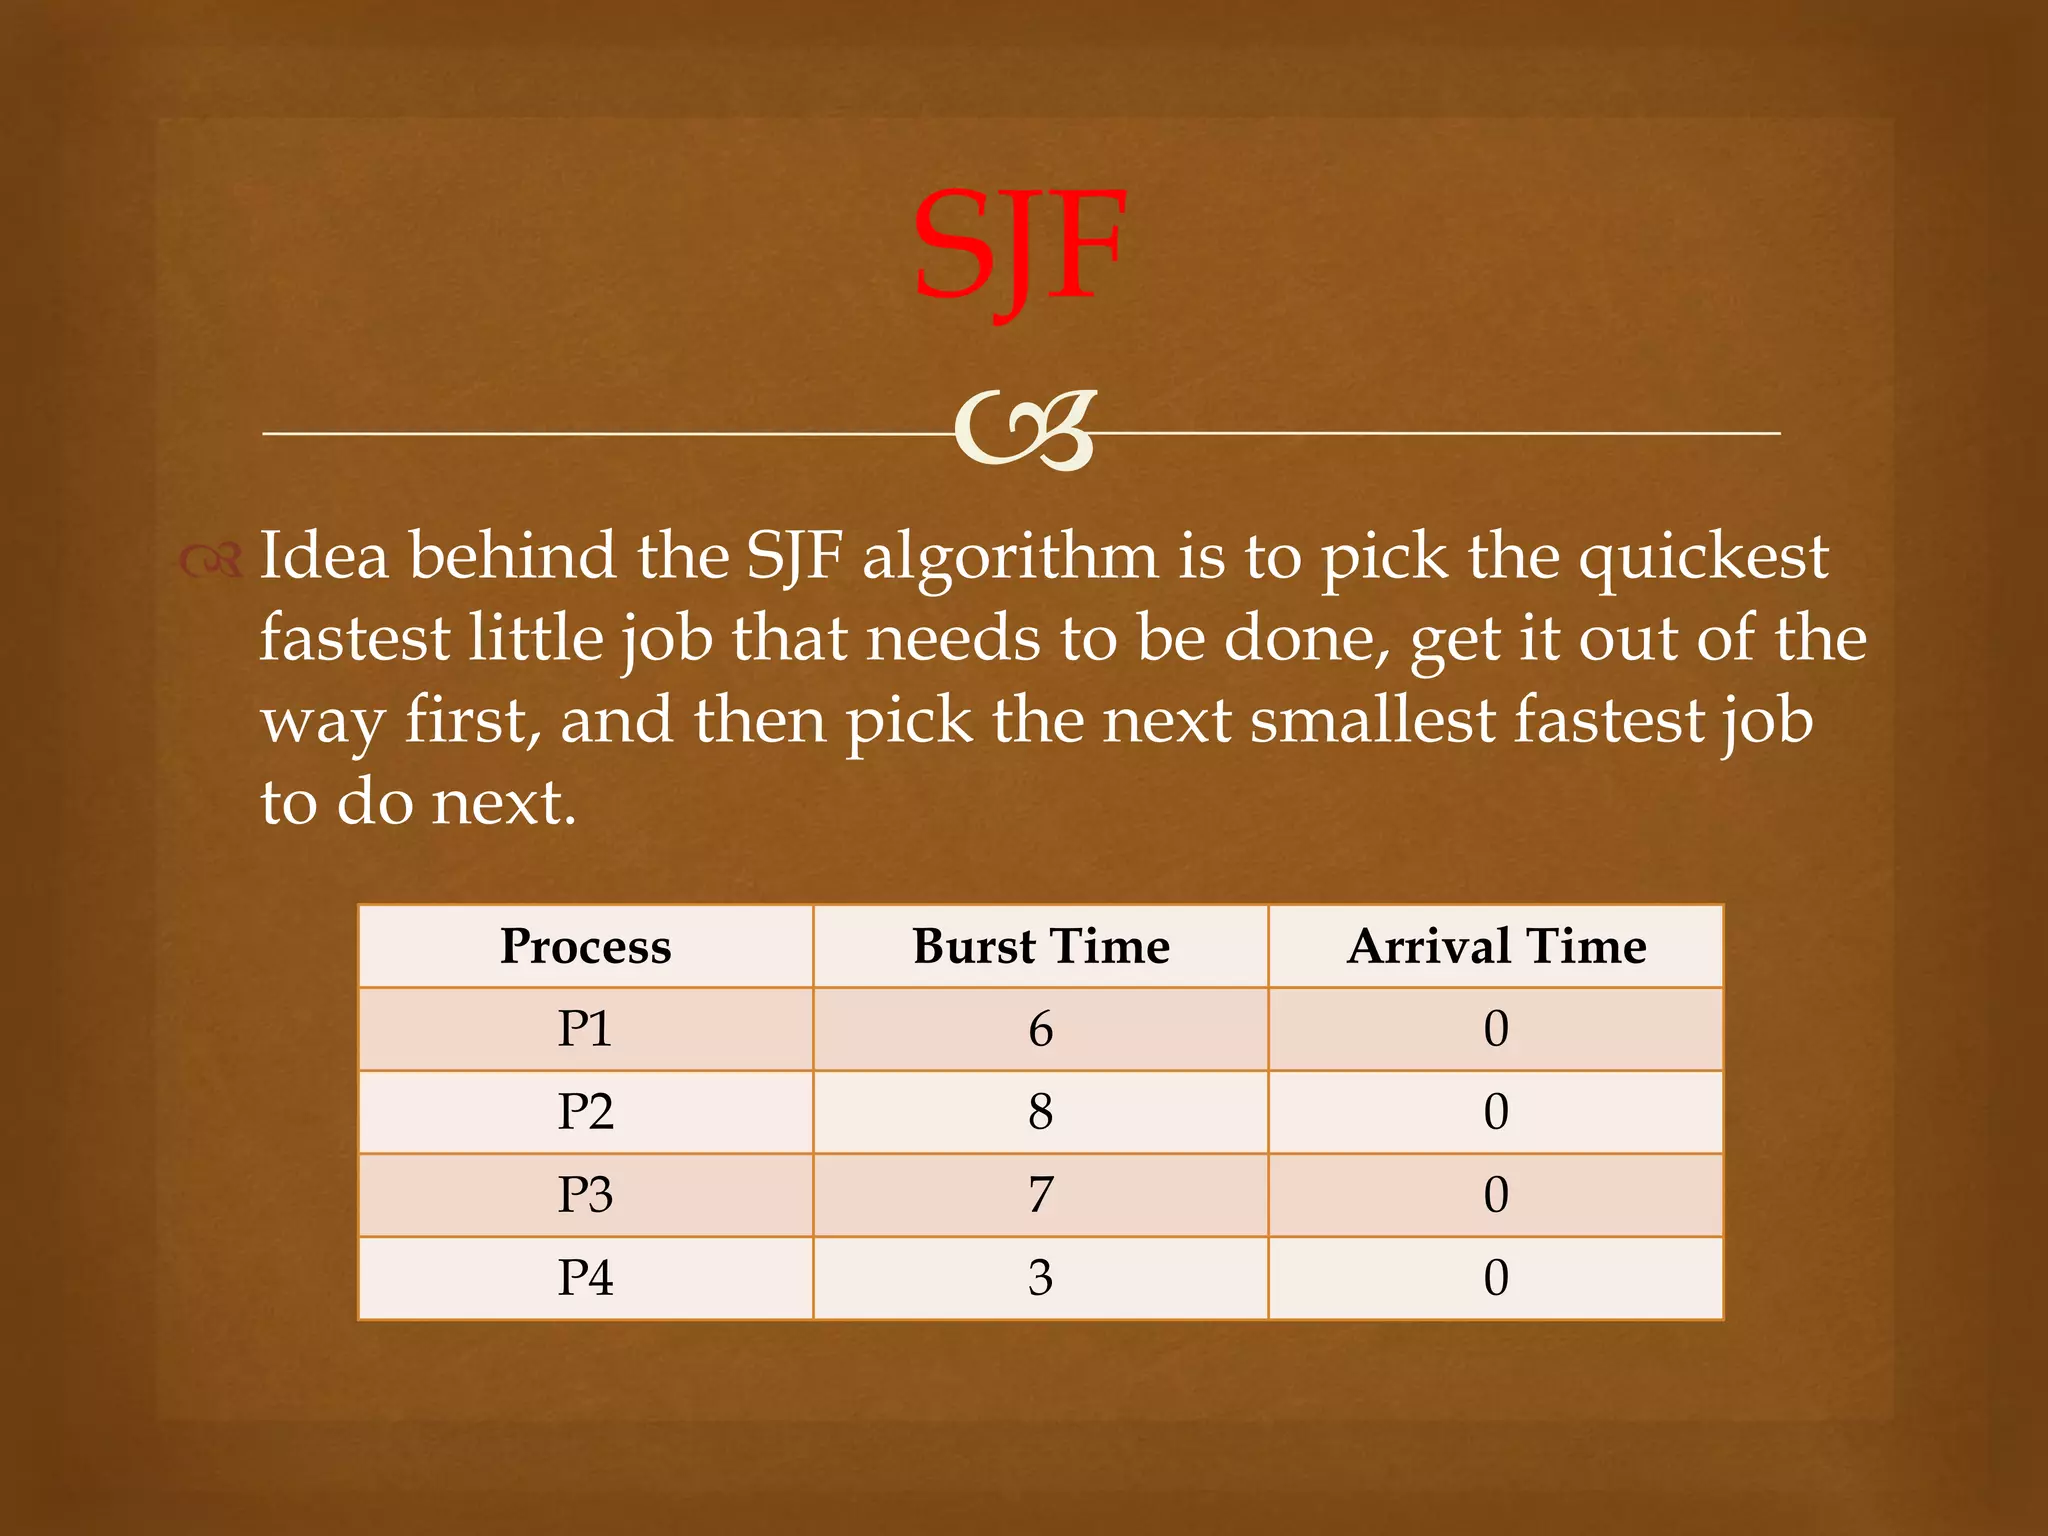
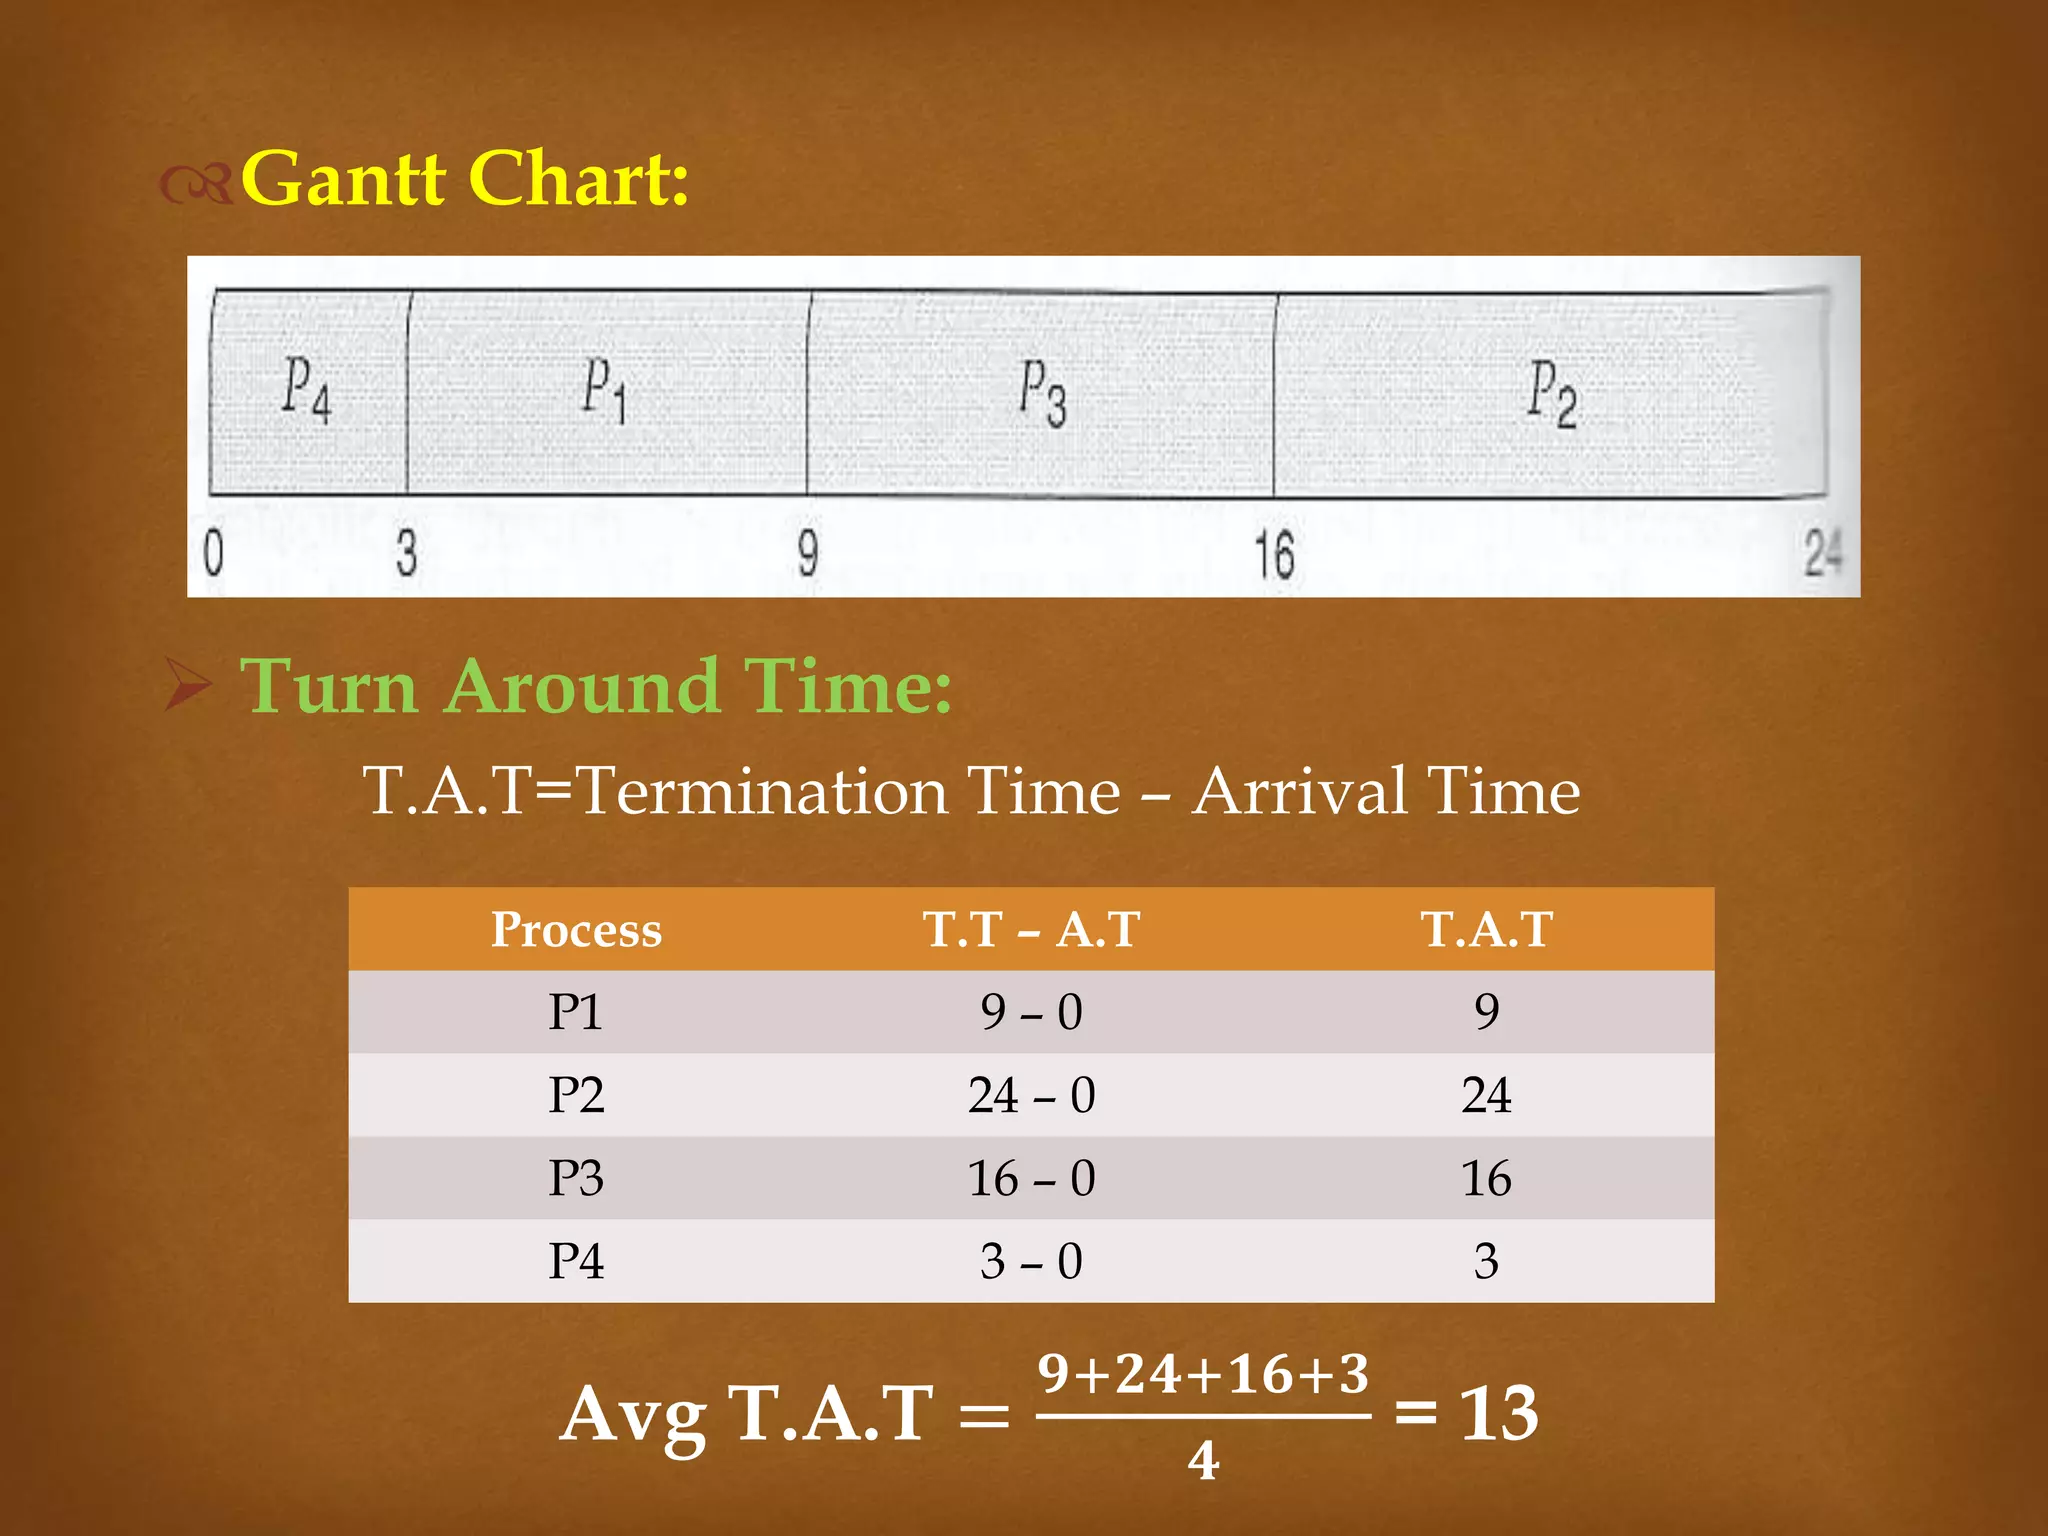
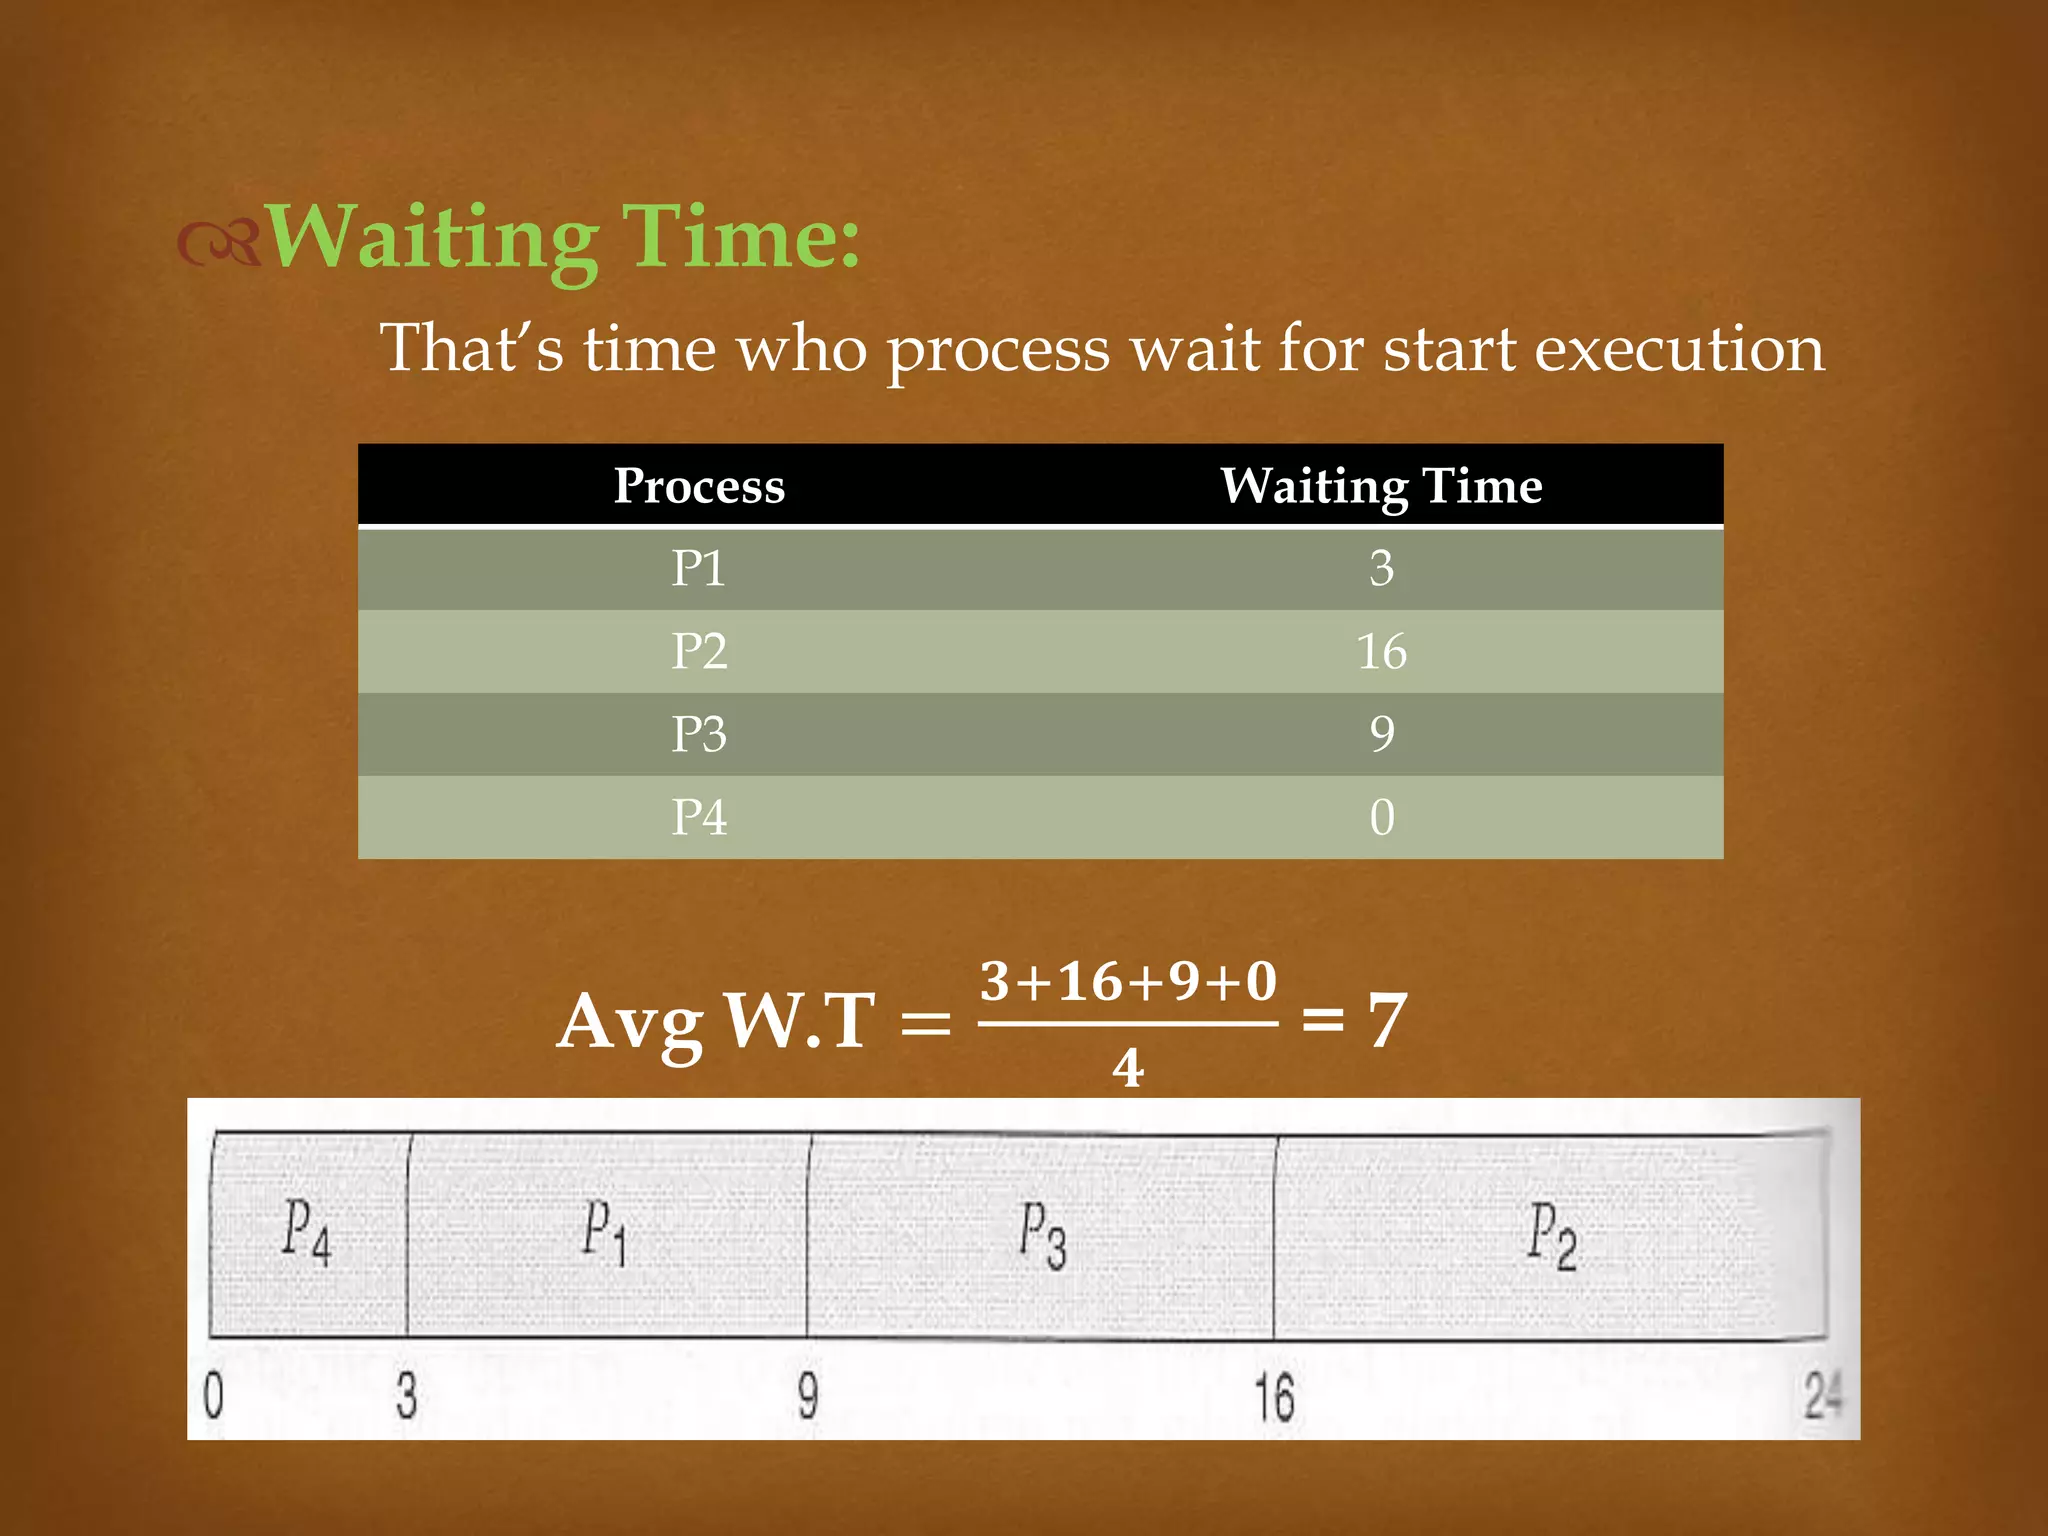
First Come First
Serve
Shortest Job First

BY: Adeel Rasheed

 FCFS is very simple - Just a FIFO queue
 Like customers waiting in line at the bank or the
post office.
FCFS (Non- Preemptive)
Process Burst Time Arrival Time
P1 24 0
P2 3 0
P3 3 0
Gantt Chart:
Turn Around Time:
T.A.T=Termination Time – Arrival Time
Process T.T – A.T T.A.T
P1 24 – 0 24
P2 27 – 0 27
P3 30 – 0 30
Avg T.A.T =
𝟐𝟒+𝟐𝟕+𝟑𝟎
𝟑
= 27
Waiting Time:
That’s time who process wait for start execution
Process Waiting Time
P1 0
P2 24
P3 27
Avg W.T =
𝟎+𝟐𝟒+𝟐𝟕
𝟑
= 17

Example

 Low priority running process anytime when a high
priority process enters into a ready state.
 Pick a little job first.
FCFS (Preemptive)
Process Burst Time Arrival Time
P1 24 0
P2 3 0
P3 3 0
Gantt Chart:
Turn Around Time:
T.A.T=Termination Time – Arrival Time
Process T.T – A.T T.A.T
P1 30 – 0 30
P2 3 – 0 3
P3 6 – 0 6
Avg T.A.T =
𝟑𝟎+𝟑+𝟔
𝟑
= 13
Waiting Time:
That’s time who process wait for start execution
Process Waiting Time
P1 6
P2 0
P3 3
Avg W.T =
𝟔+𝟎+𝟑
𝟑
= 3

 Idea behind the SJF algorithm is to pick the quickest
fastest little job that needs to be done, get it out of the
way first, and then pick the next smallest fastest job
to do next.
SJF
Process Burst Time Arrival Time
P1 6 0
P2 8 0
P3 7 0
P4 3 0
Gantt Chart:
 Turn Around Time:
T.A.T=Termination Time – Arrival Time
Process T.T – A.T T.A.T
P1 9 – 0 9
P2 24 – 0 24
P3 16 – 0 16
P4 3 – 0 3
Avg T.A.T =
𝟗+𝟐𝟒+𝟏𝟔+𝟑
𝟒
= 13
Waiting Time:
That’s time who process wait for start execution
Process Waiting Time
P1 3
P2 16
P3 9
P4 0
Avg W.T =
𝟑+𝟏𝟔+𝟗+𝟎
𝟒
= 7


First Come First Serve & Shortest Job First-(FCFS & SJF)

  • 1.
  • 2.
  • 3.
      FCFS isvery simple - Just a FIFO queue  Like customers waiting in line at the bank or the post office. FCFS (Non- Preemptive) Process Burst Time Arrival Time P1 24 0 P2 3 0 P3 3 0
  • 4.
    Gantt Chart: Turn AroundTime: T.A.T=Termination Time – Arrival Time Process T.T – A.T T.A.T P1 24 – 0 24 P2 27 – 0 27 P3 30 – 0 30 Avg T.A.T = 𝟐𝟒+𝟐𝟕+𝟑𝟎 𝟑 = 27
  • 5.
    Waiting Time: That’s timewho process wait for start execution Process Waiting Time P1 0 P2 24 P3 27 Avg W.T = 𝟎+𝟐𝟒+𝟐𝟕 𝟑 = 17
  • 6.
  • 7.
      Low priorityrunning process anytime when a high priority process enters into a ready state.  Pick a little job first. FCFS (Preemptive) Process Burst Time Arrival Time P1 24 0 P2 3 0 P3 3 0
  • 8.
    Gantt Chart: Turn AroundTime: T.A.T=Termination Time – Arrival Time Process T.T – A.T T.A.T P1 30 – 0 30 P2 3 – 0 3 P3 6 – 0 6 Avg T.A.T = 𝟑𝟎+𝟑+𝟔 𝟑 = 13
  • 9.
    Waiting Time: That’s timewho process wait for start execution Process Waiting Time P1 6 P2 0 P3 3 Avg W.T = 𝟔+𝟎+𝟑 𝟑 = 3
  • 10.
      Idea behindthe SJF algorithm is to pick the quickest fastest little job that needs to be done, get it out of the way first, and then pick the next smallest fastest job to do next. SJF Process Burst Time Arrival Time P1 6 0 P2 8 0 P3 7 0 P4 3 0
  • 11.
    Gantt Chart:  TurnAround Time: T.A.T=Termination Time – Arrival Time Process T.T – A.T T.A.T P1 9 – 0 9 P2 24 – 0 24 P3 16 – 0 16 P4 3 – 0 3 Avg T.A.T = 𝟗+𝟐𝟒+𝟏𝟔+𝟑 𝟒 = 13
  • 12.
    Waiting Time: That’s timewho process wait for start execution Process Waiting Time P1 3 P2 16 P3 9 P4 0 Avg W.T = 𝟑+𝟏𝟔+𝟗+𝟎 𝟒 = 7
  • 13.