Download as PDF, PPTX

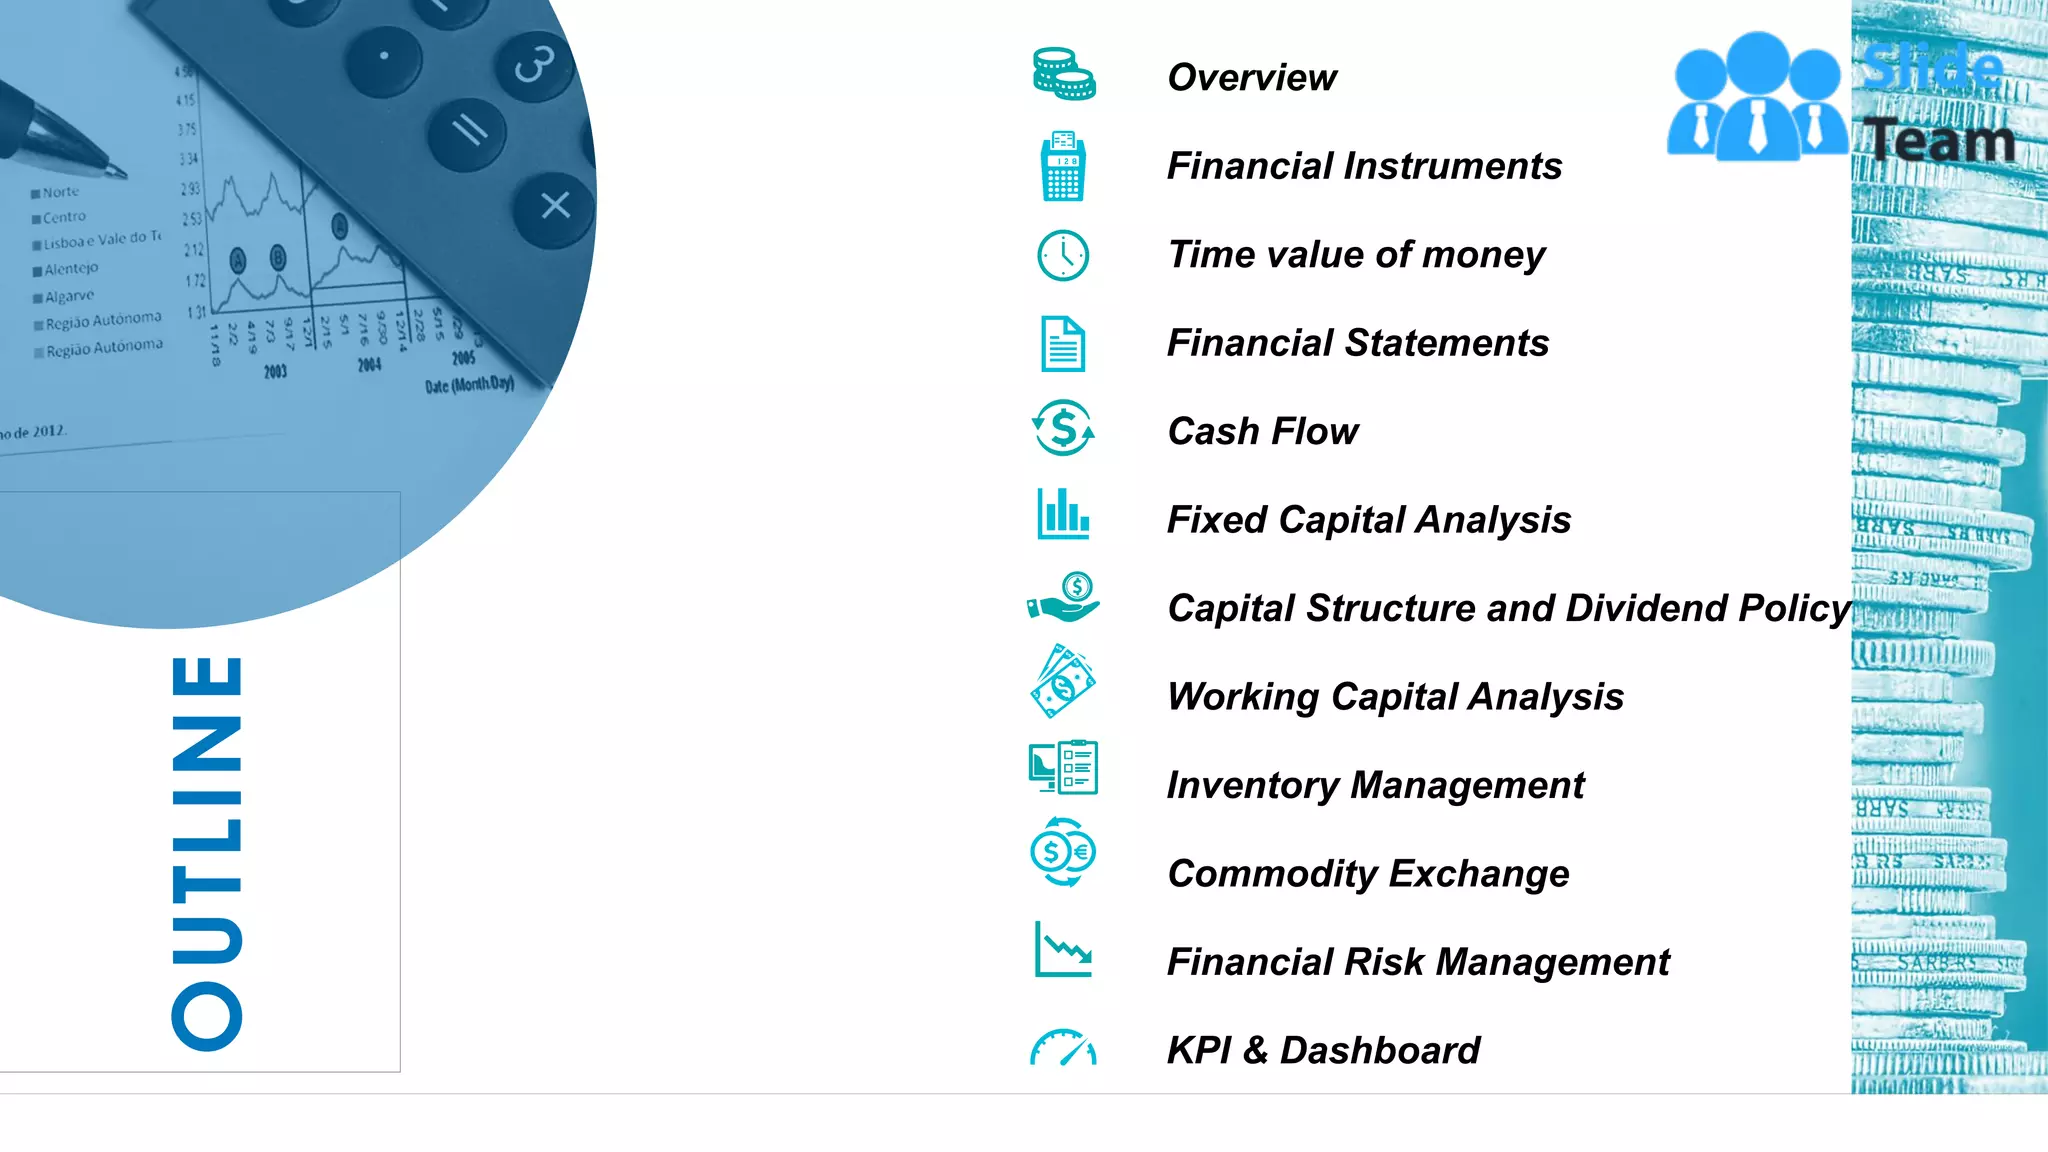


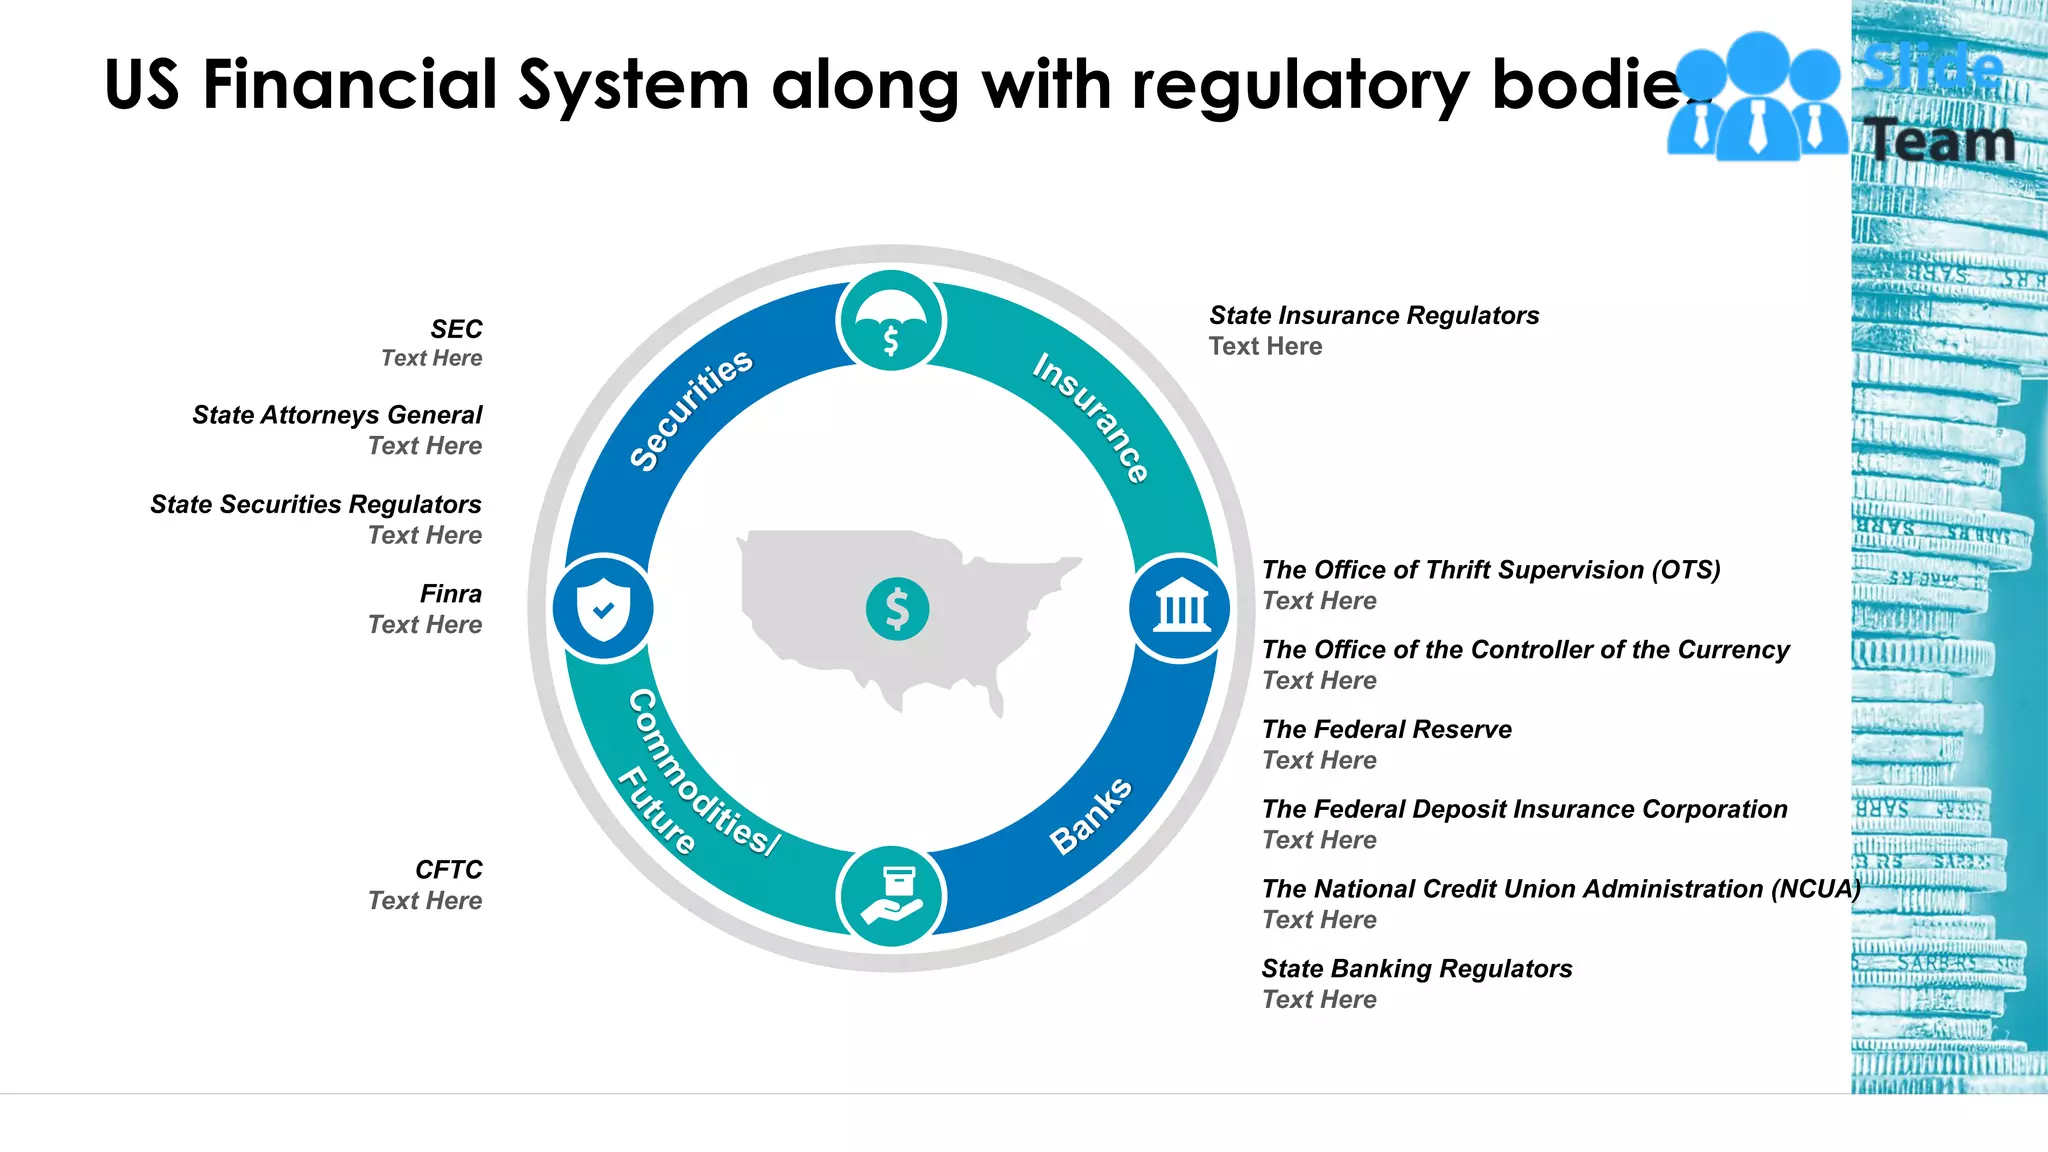
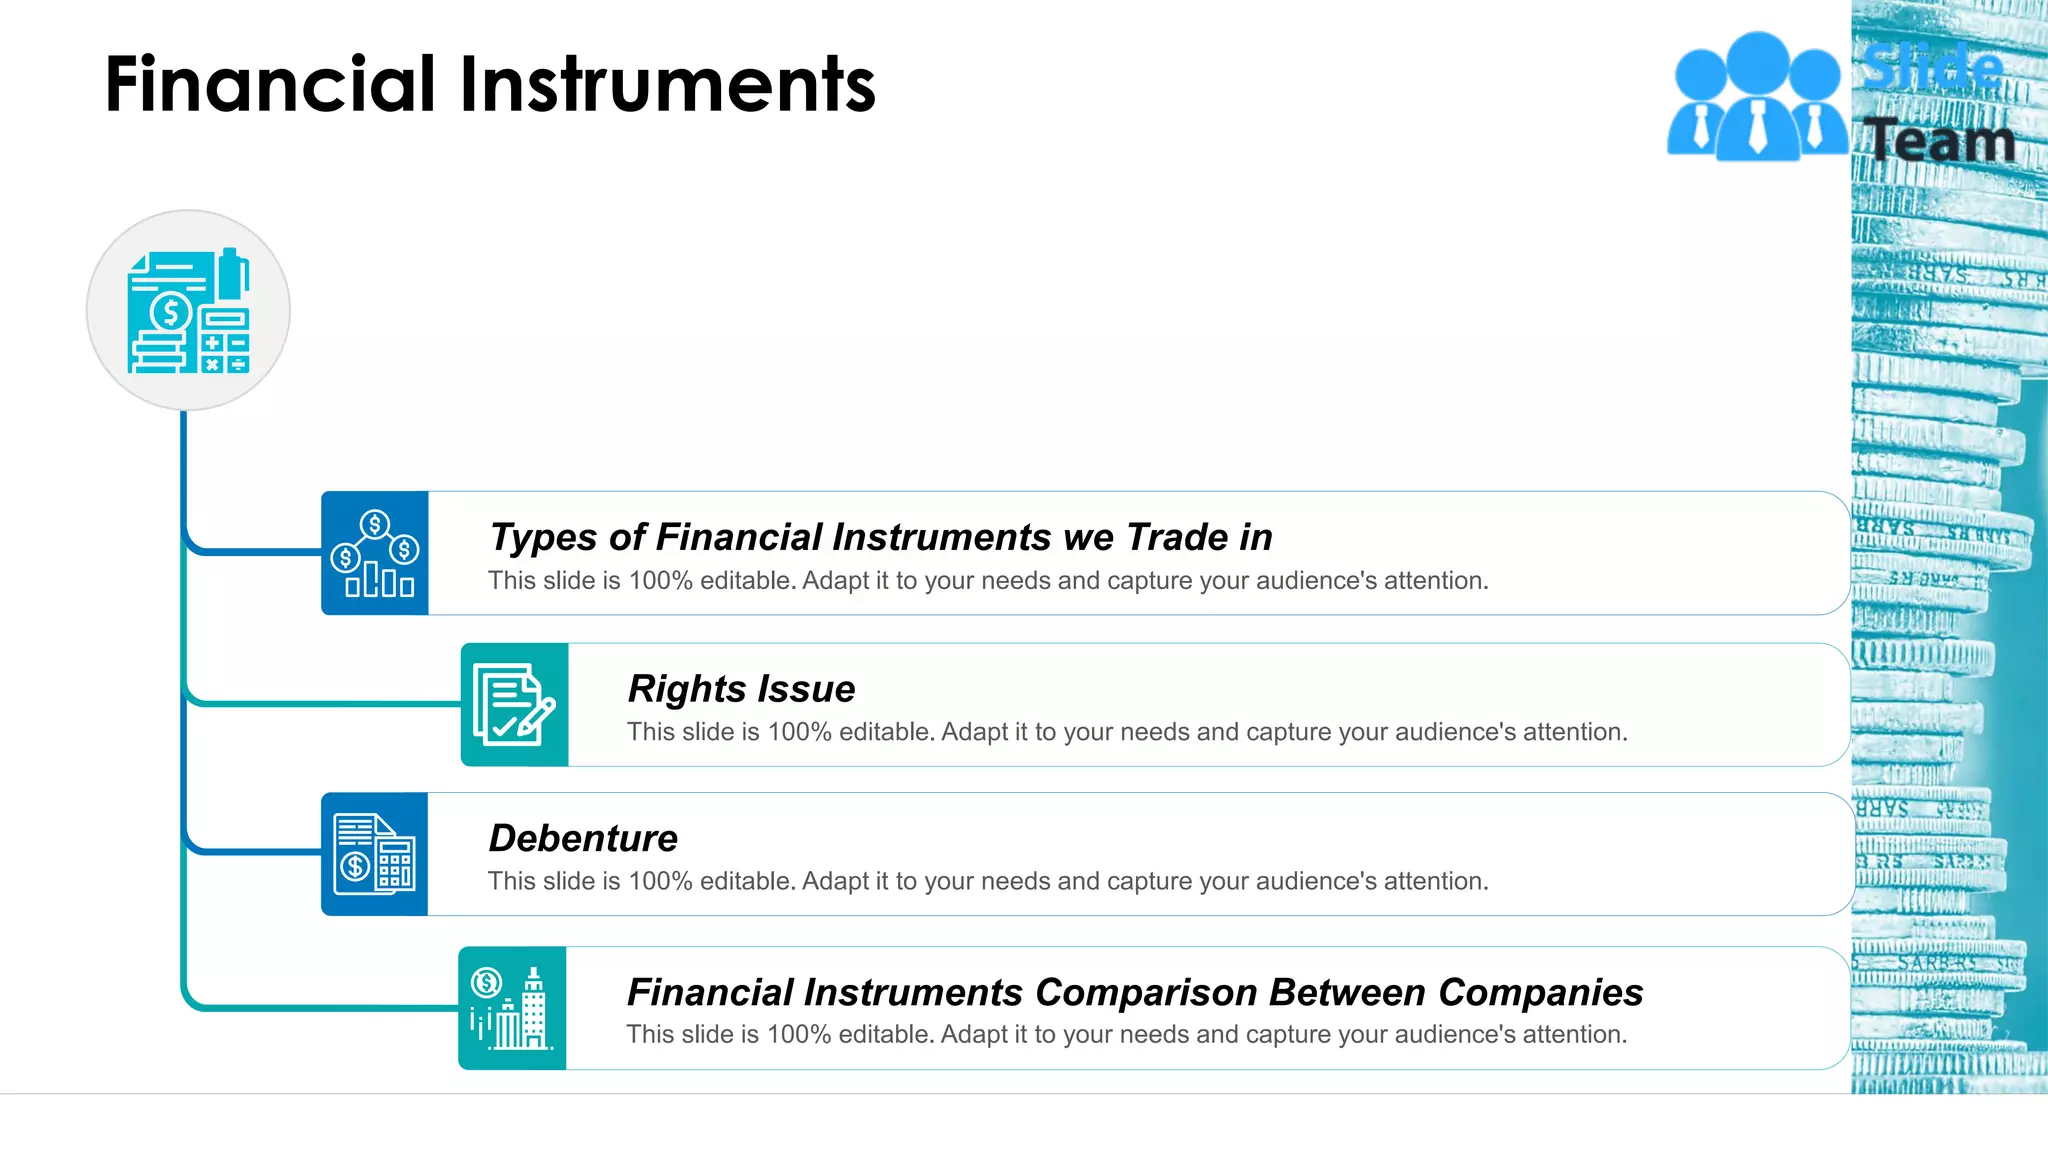
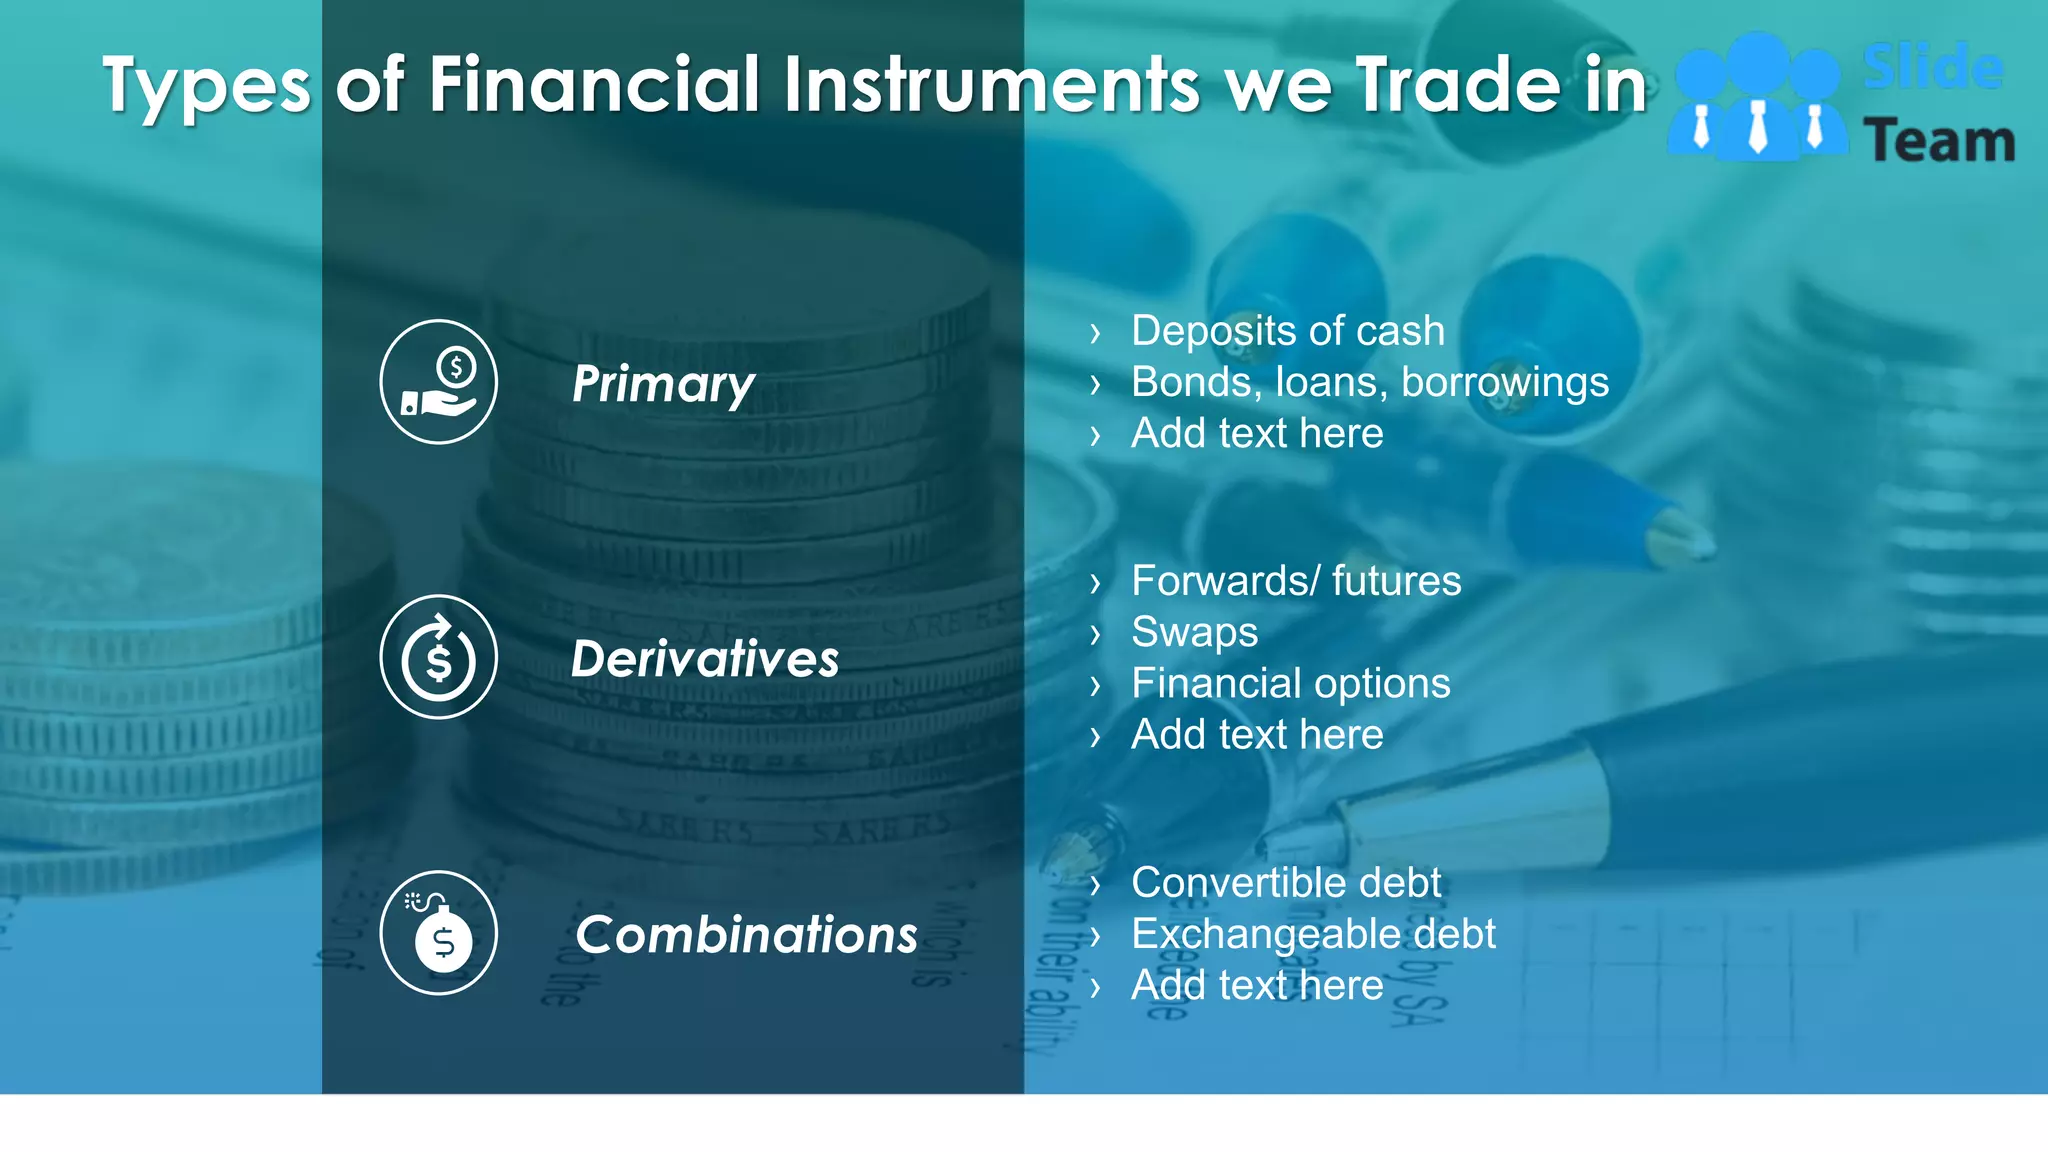
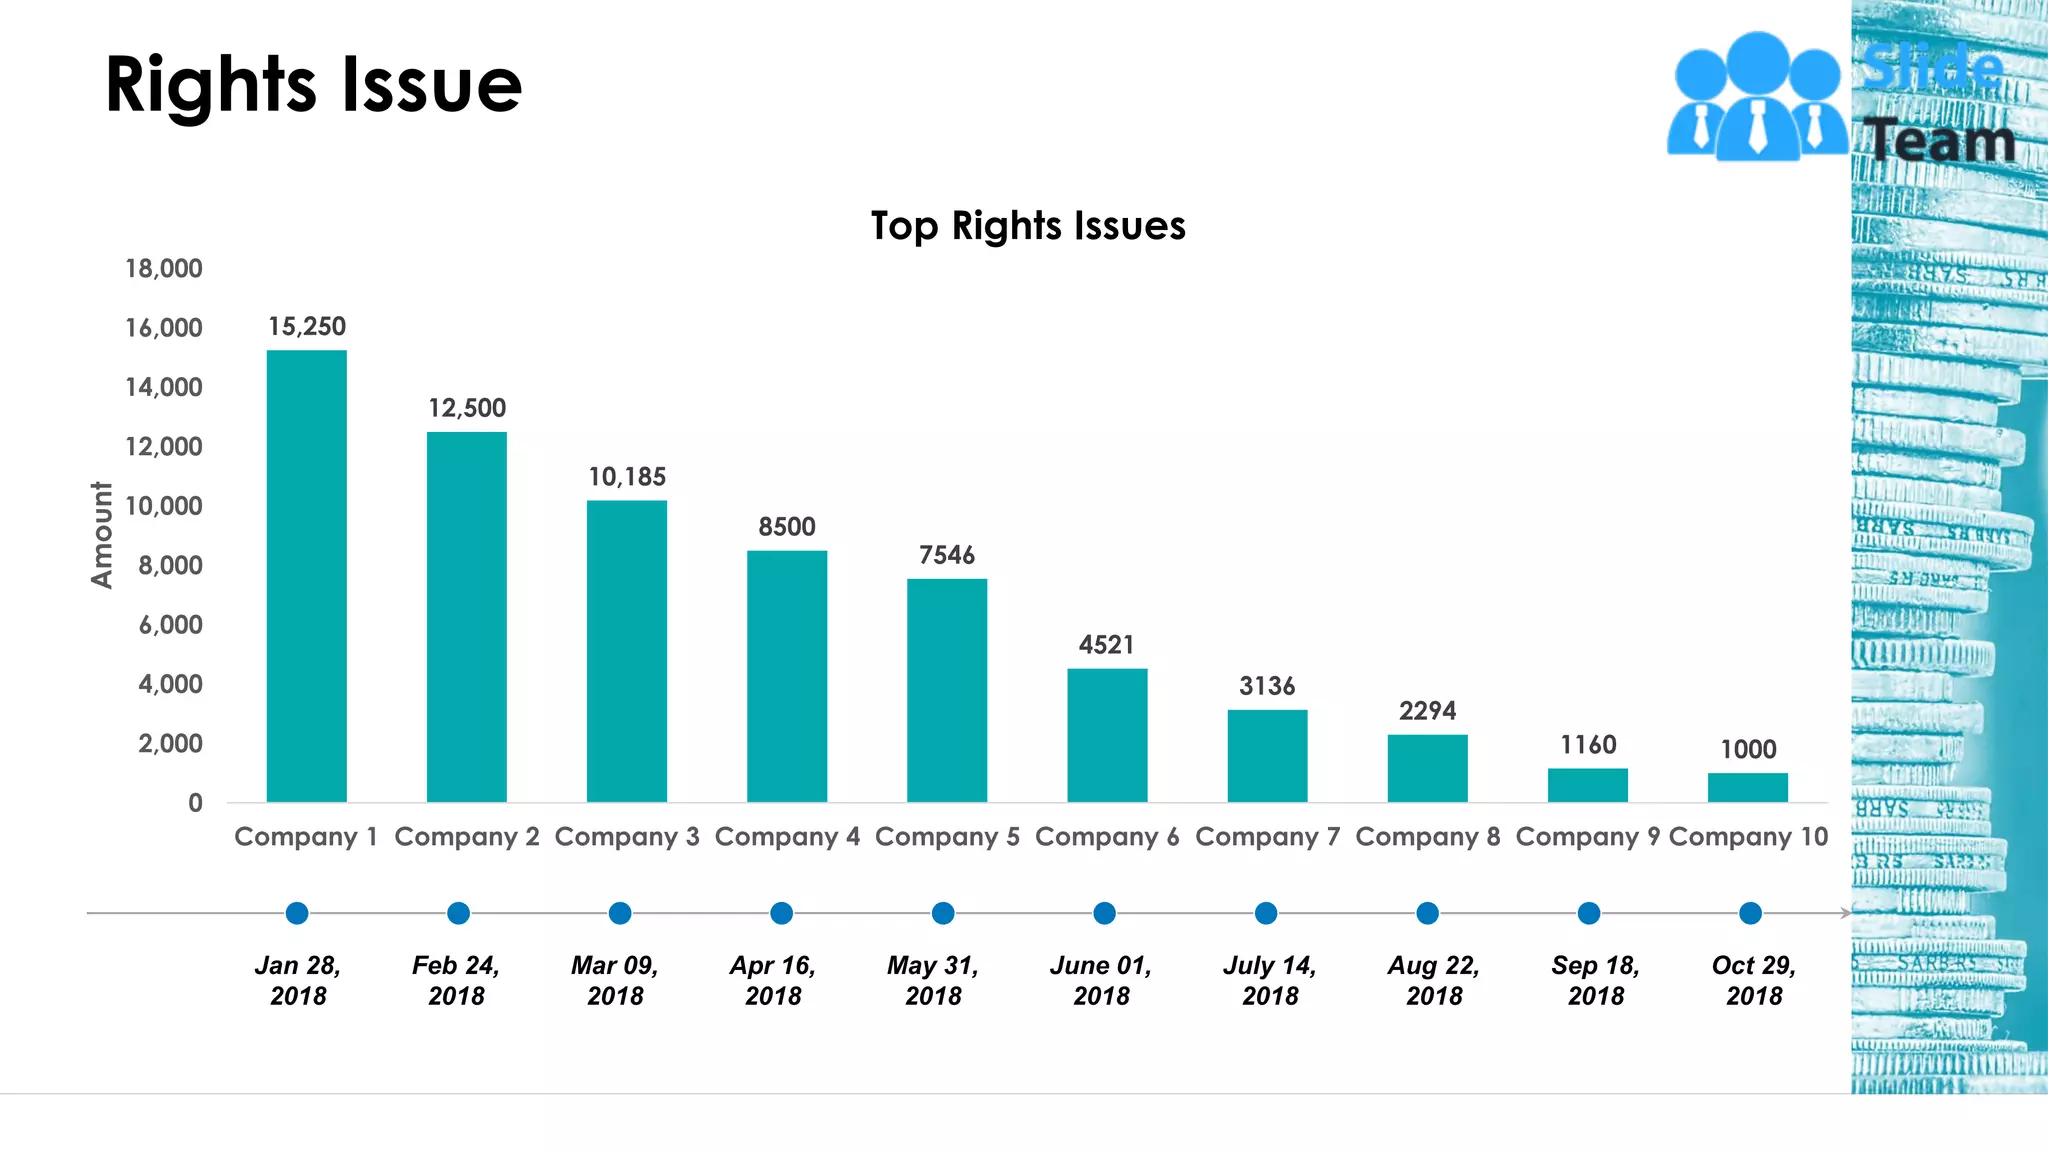

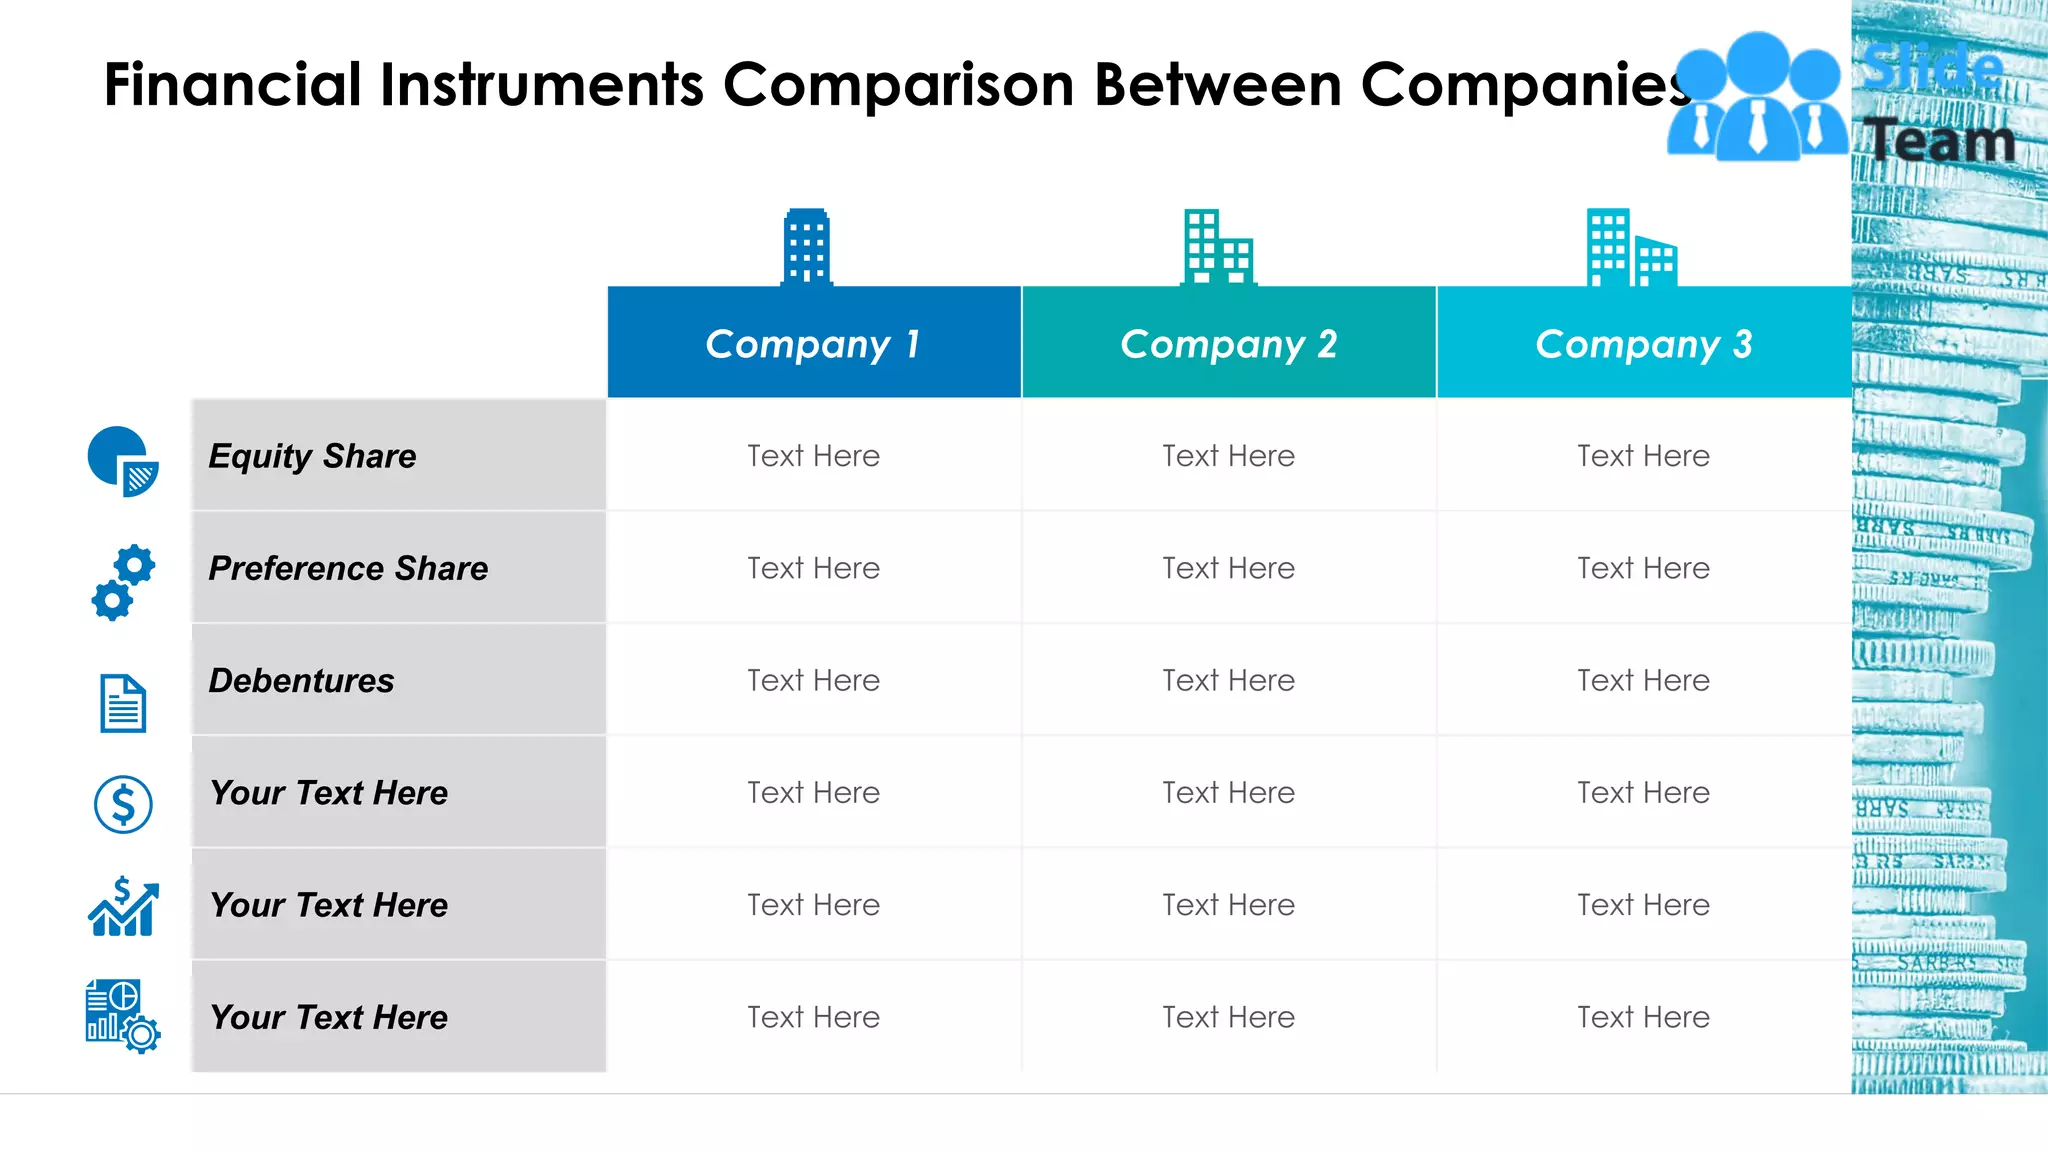


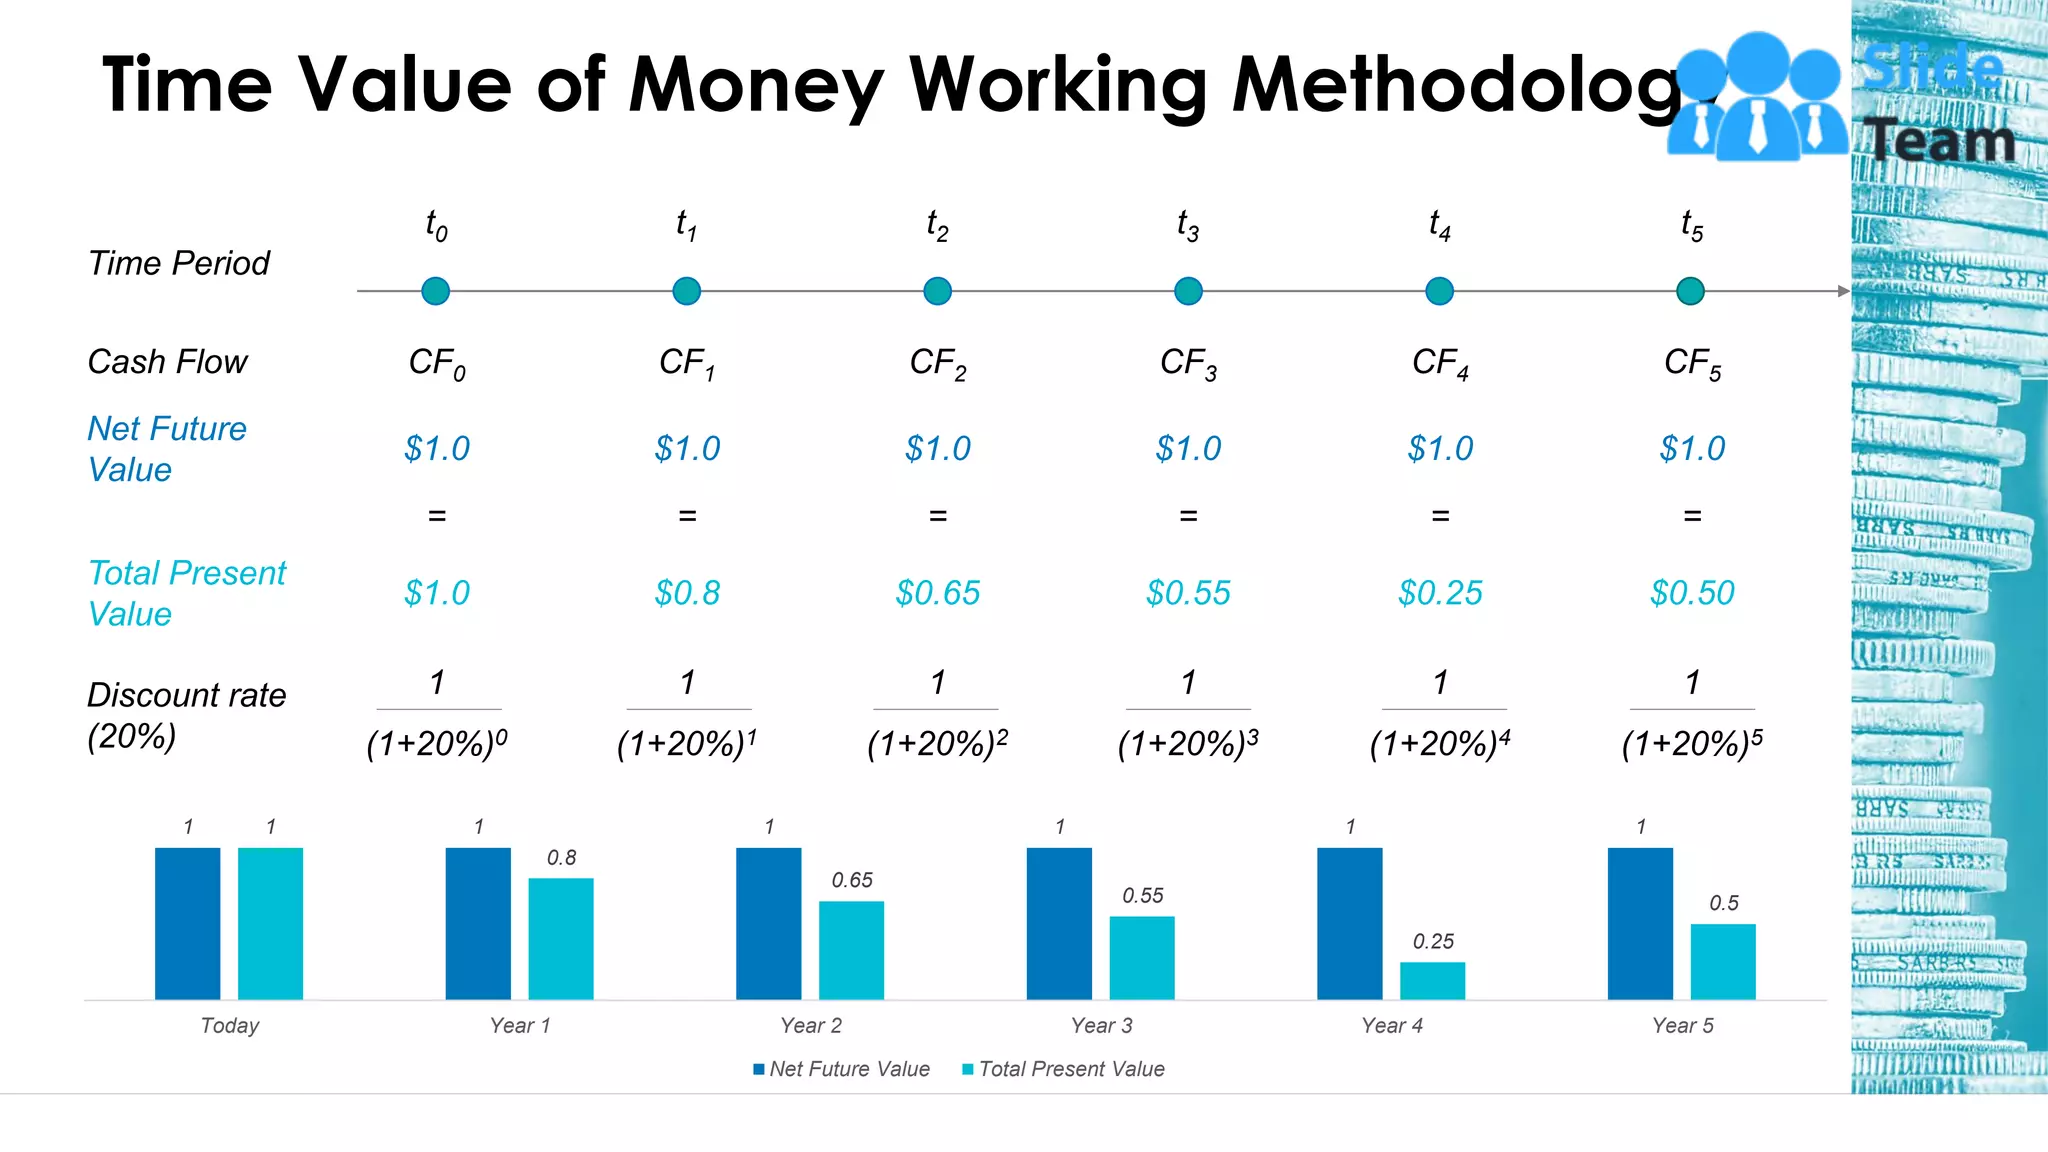


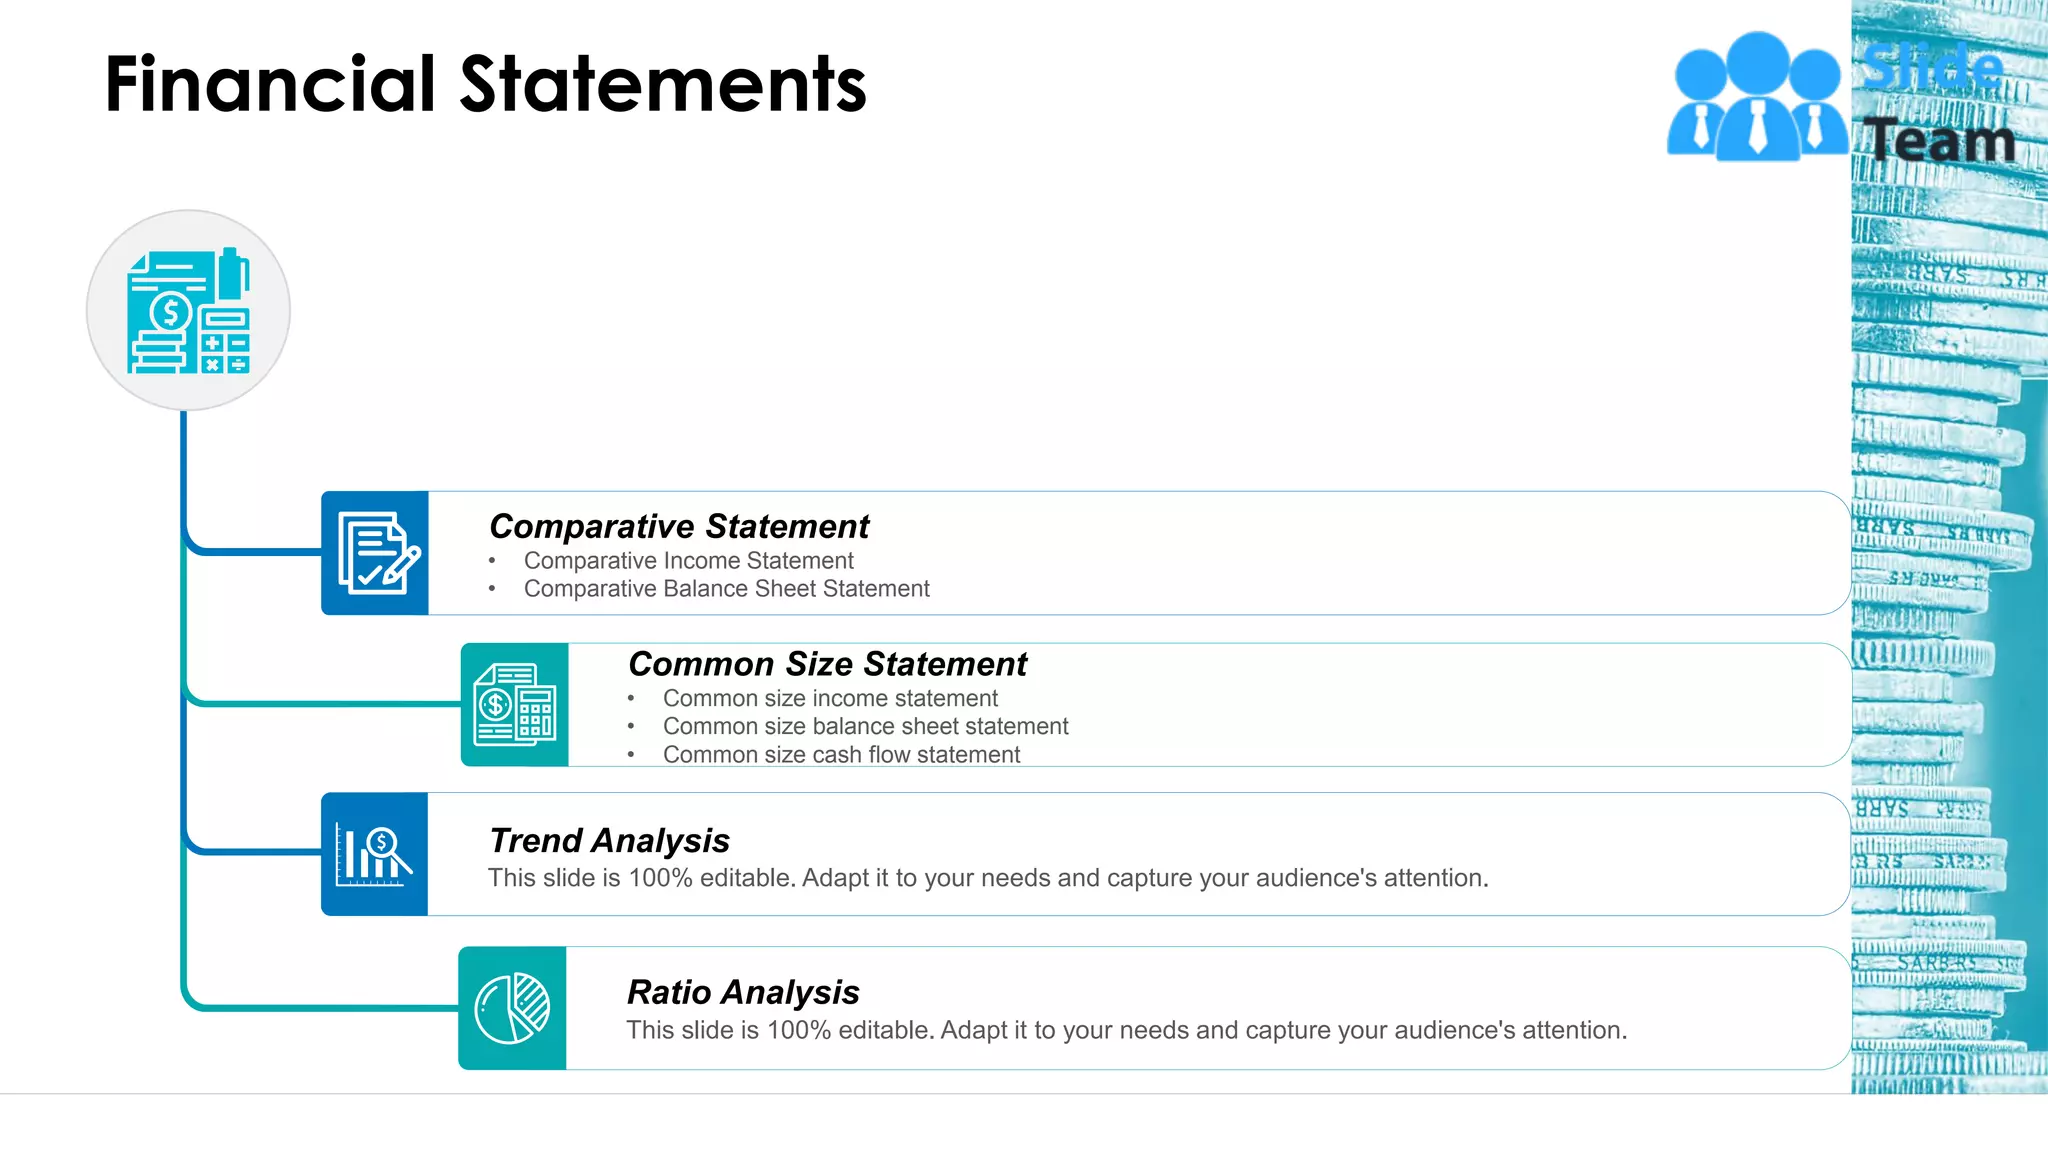
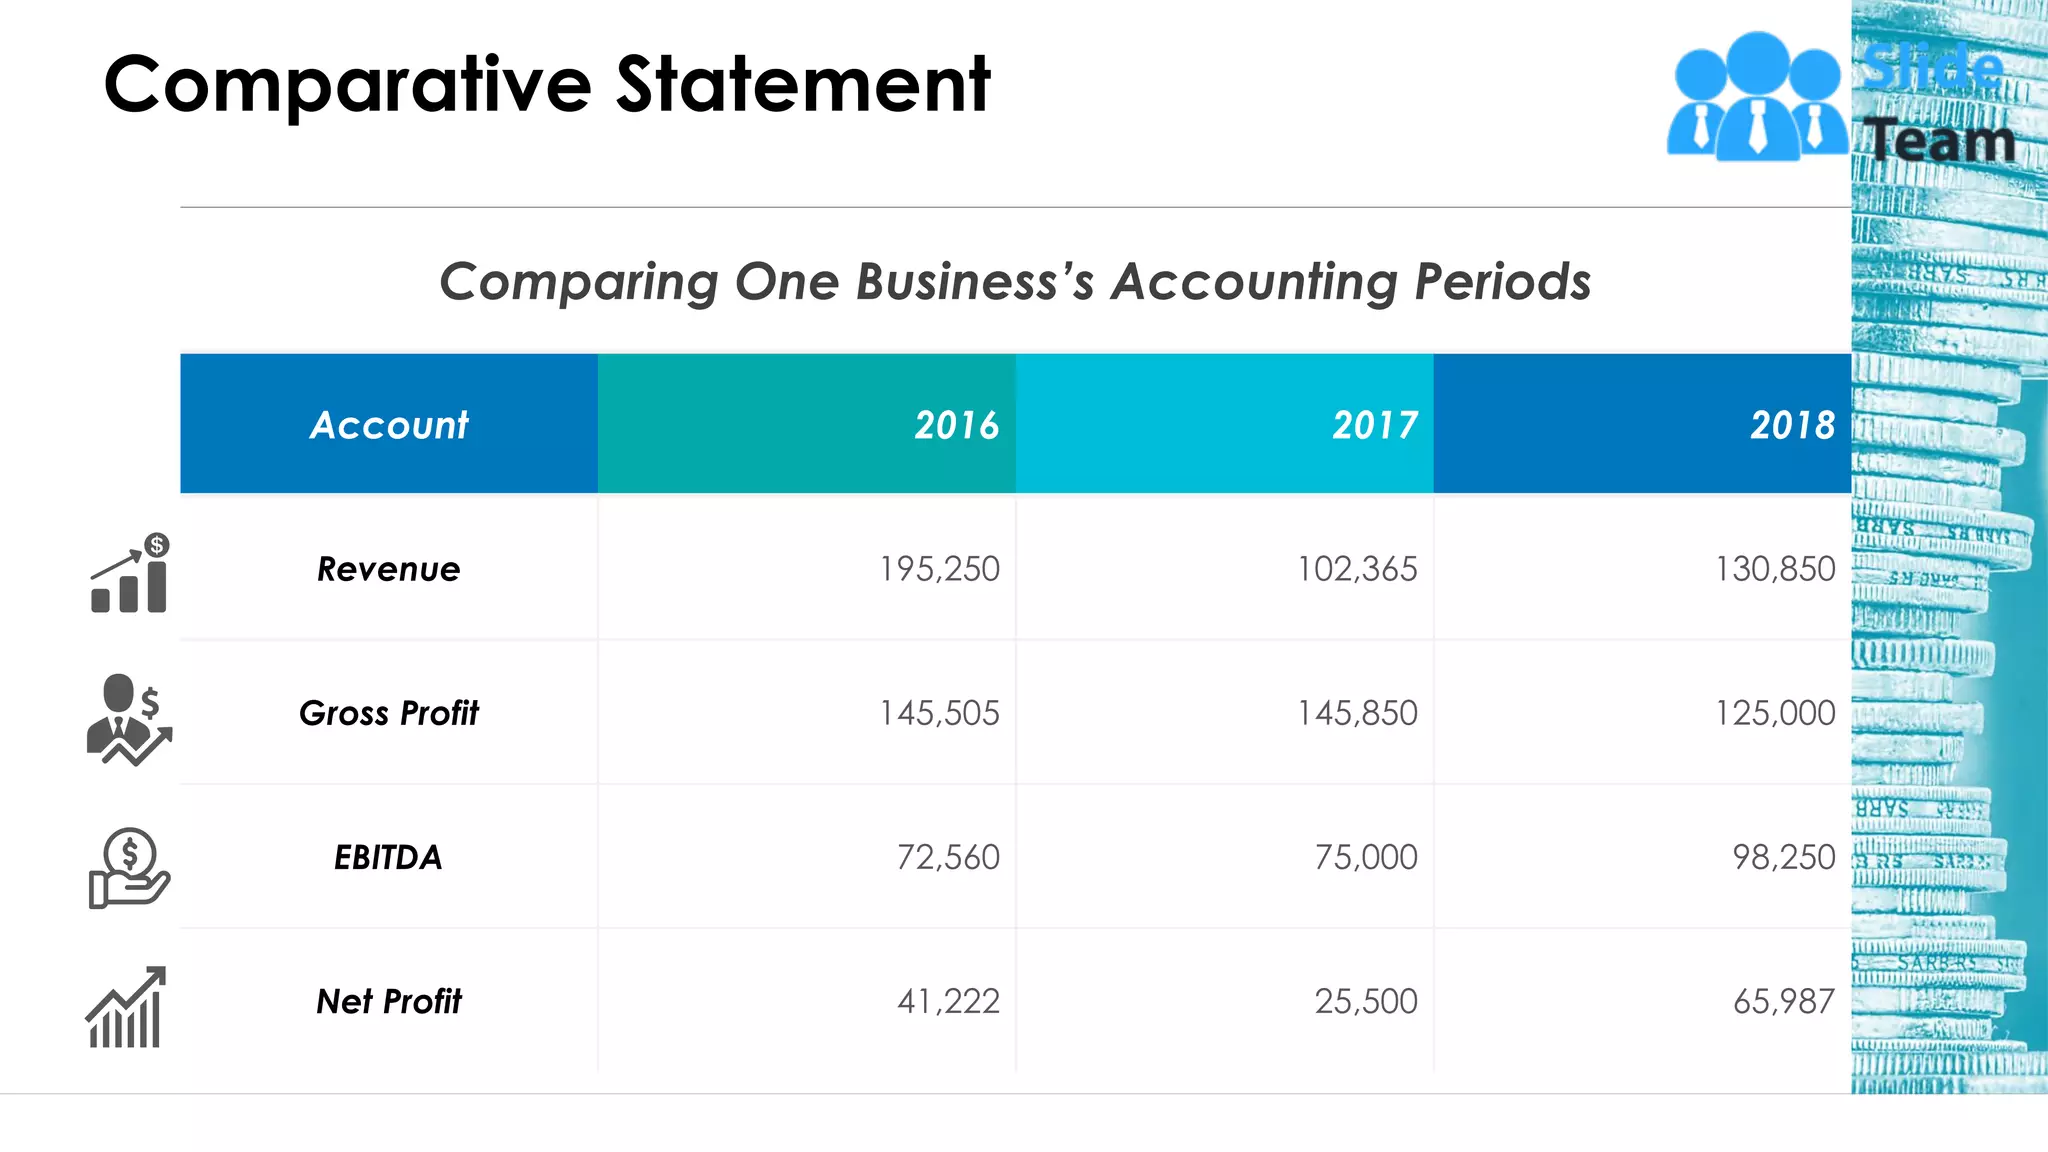


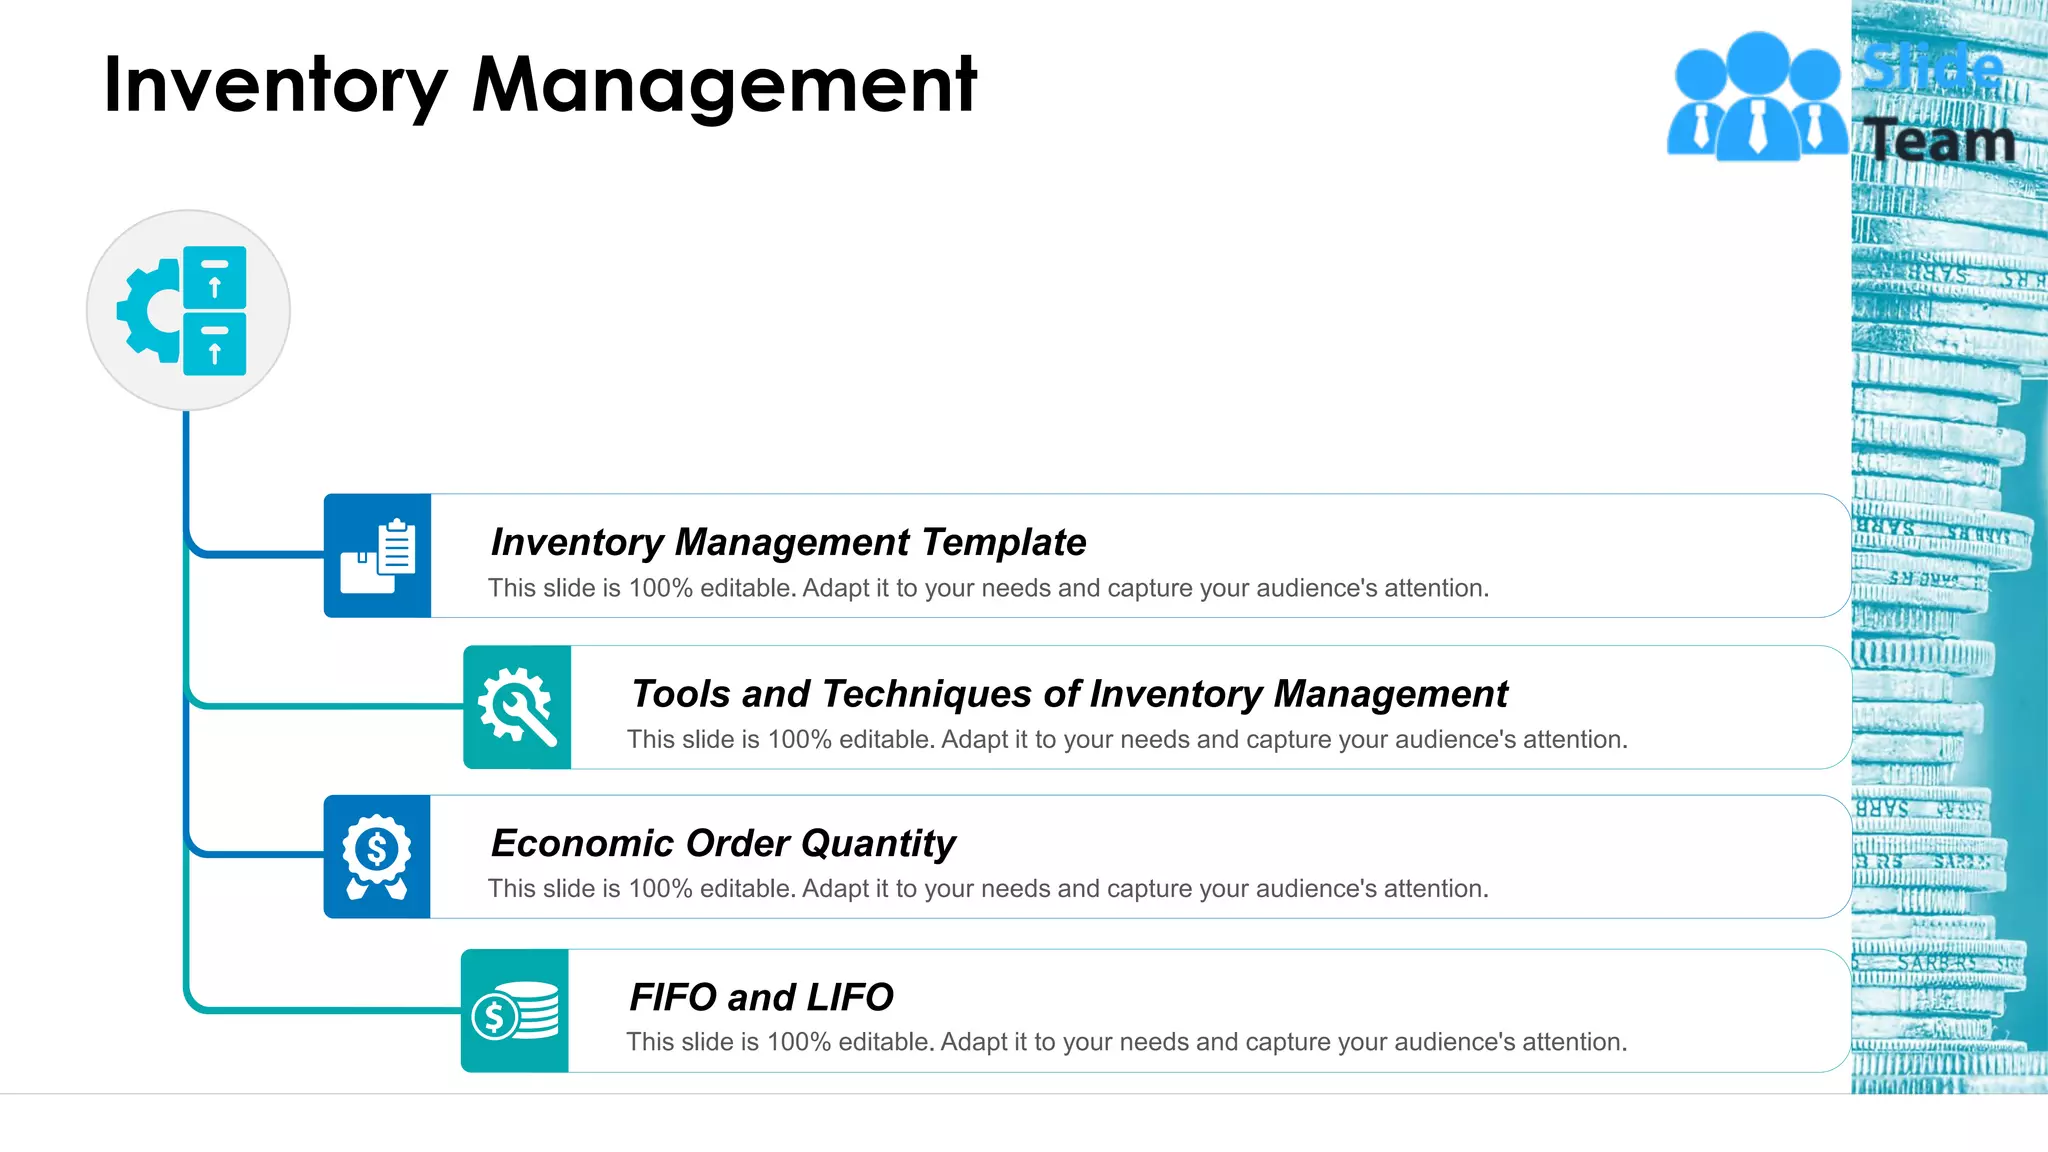


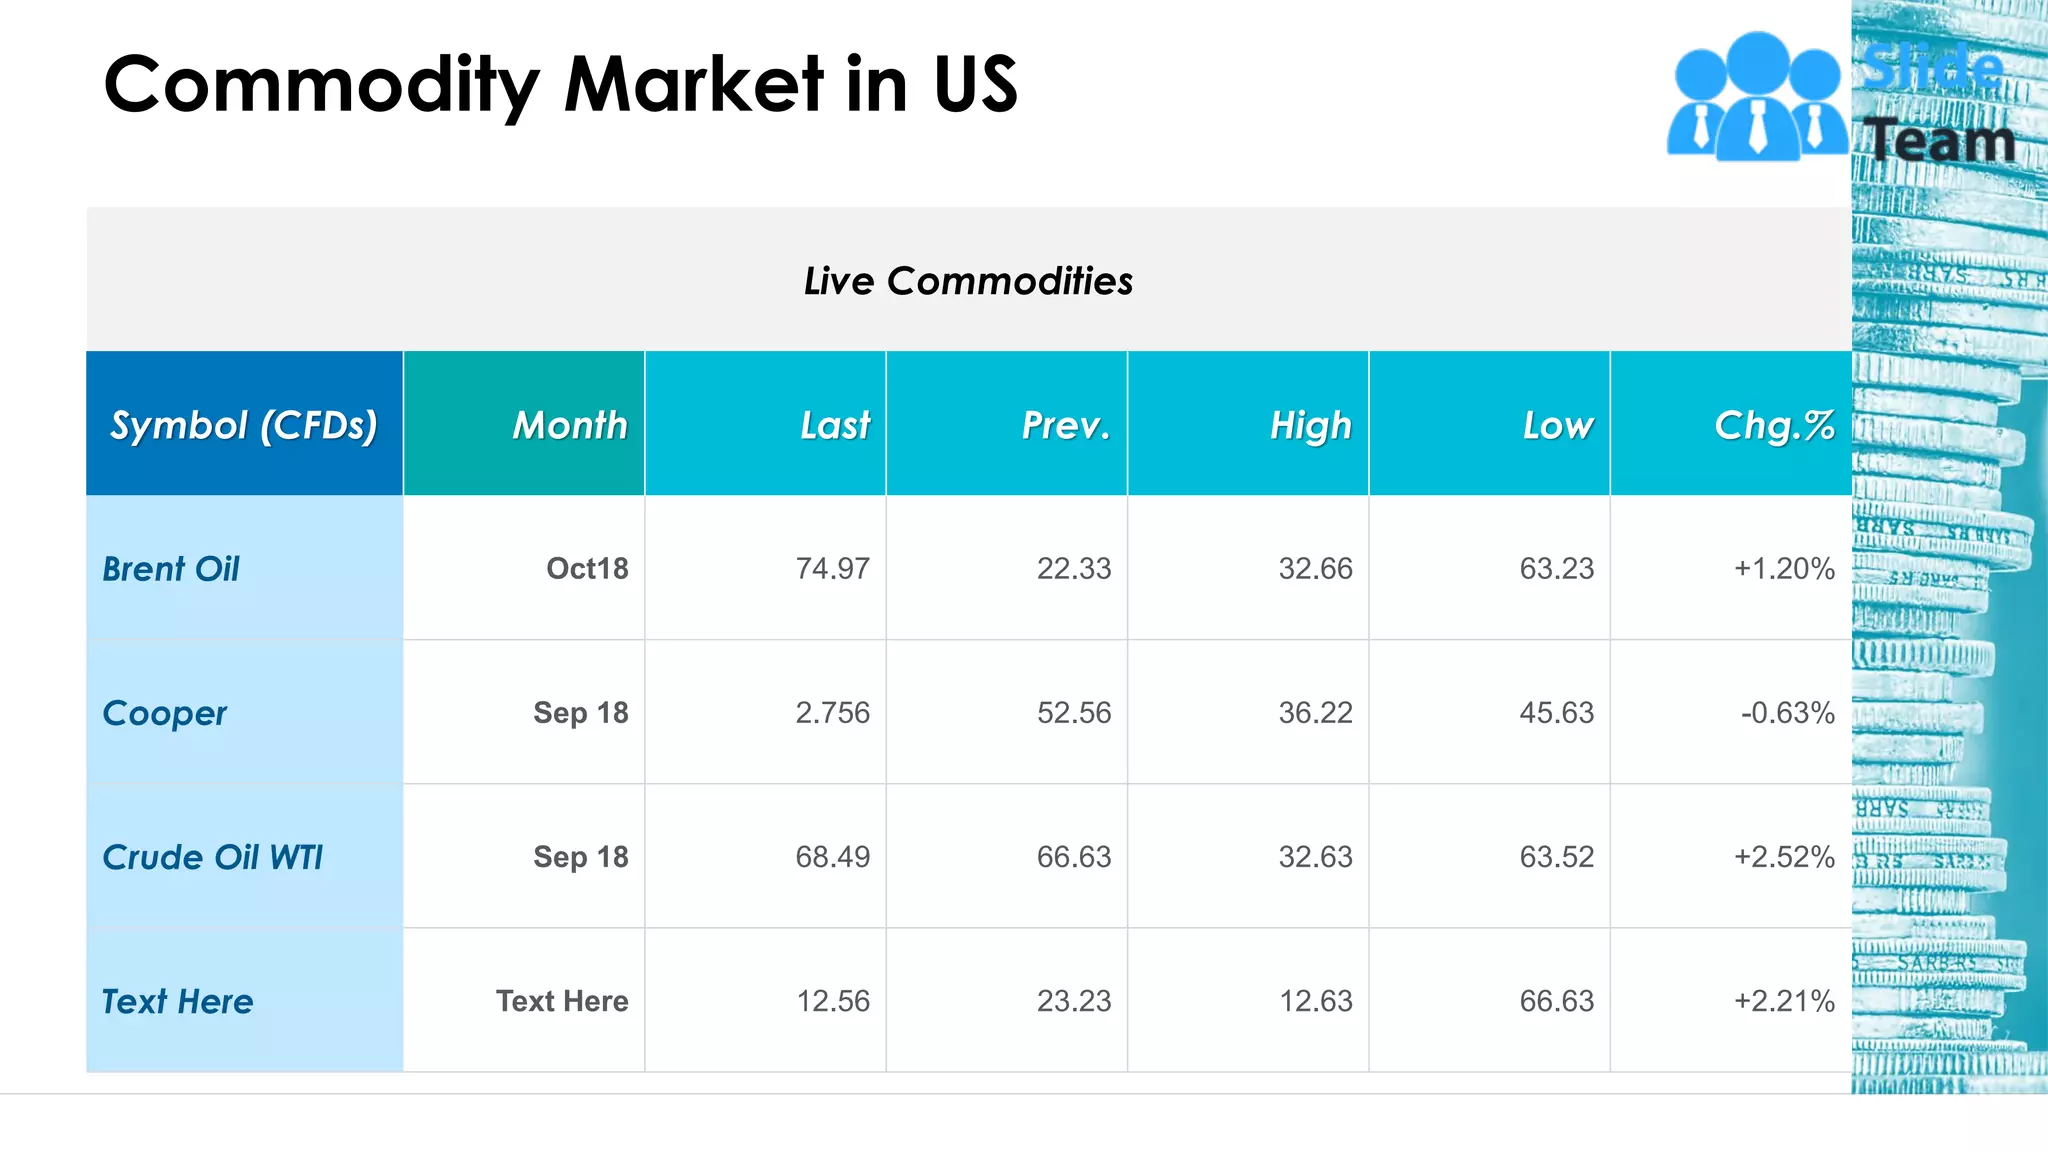

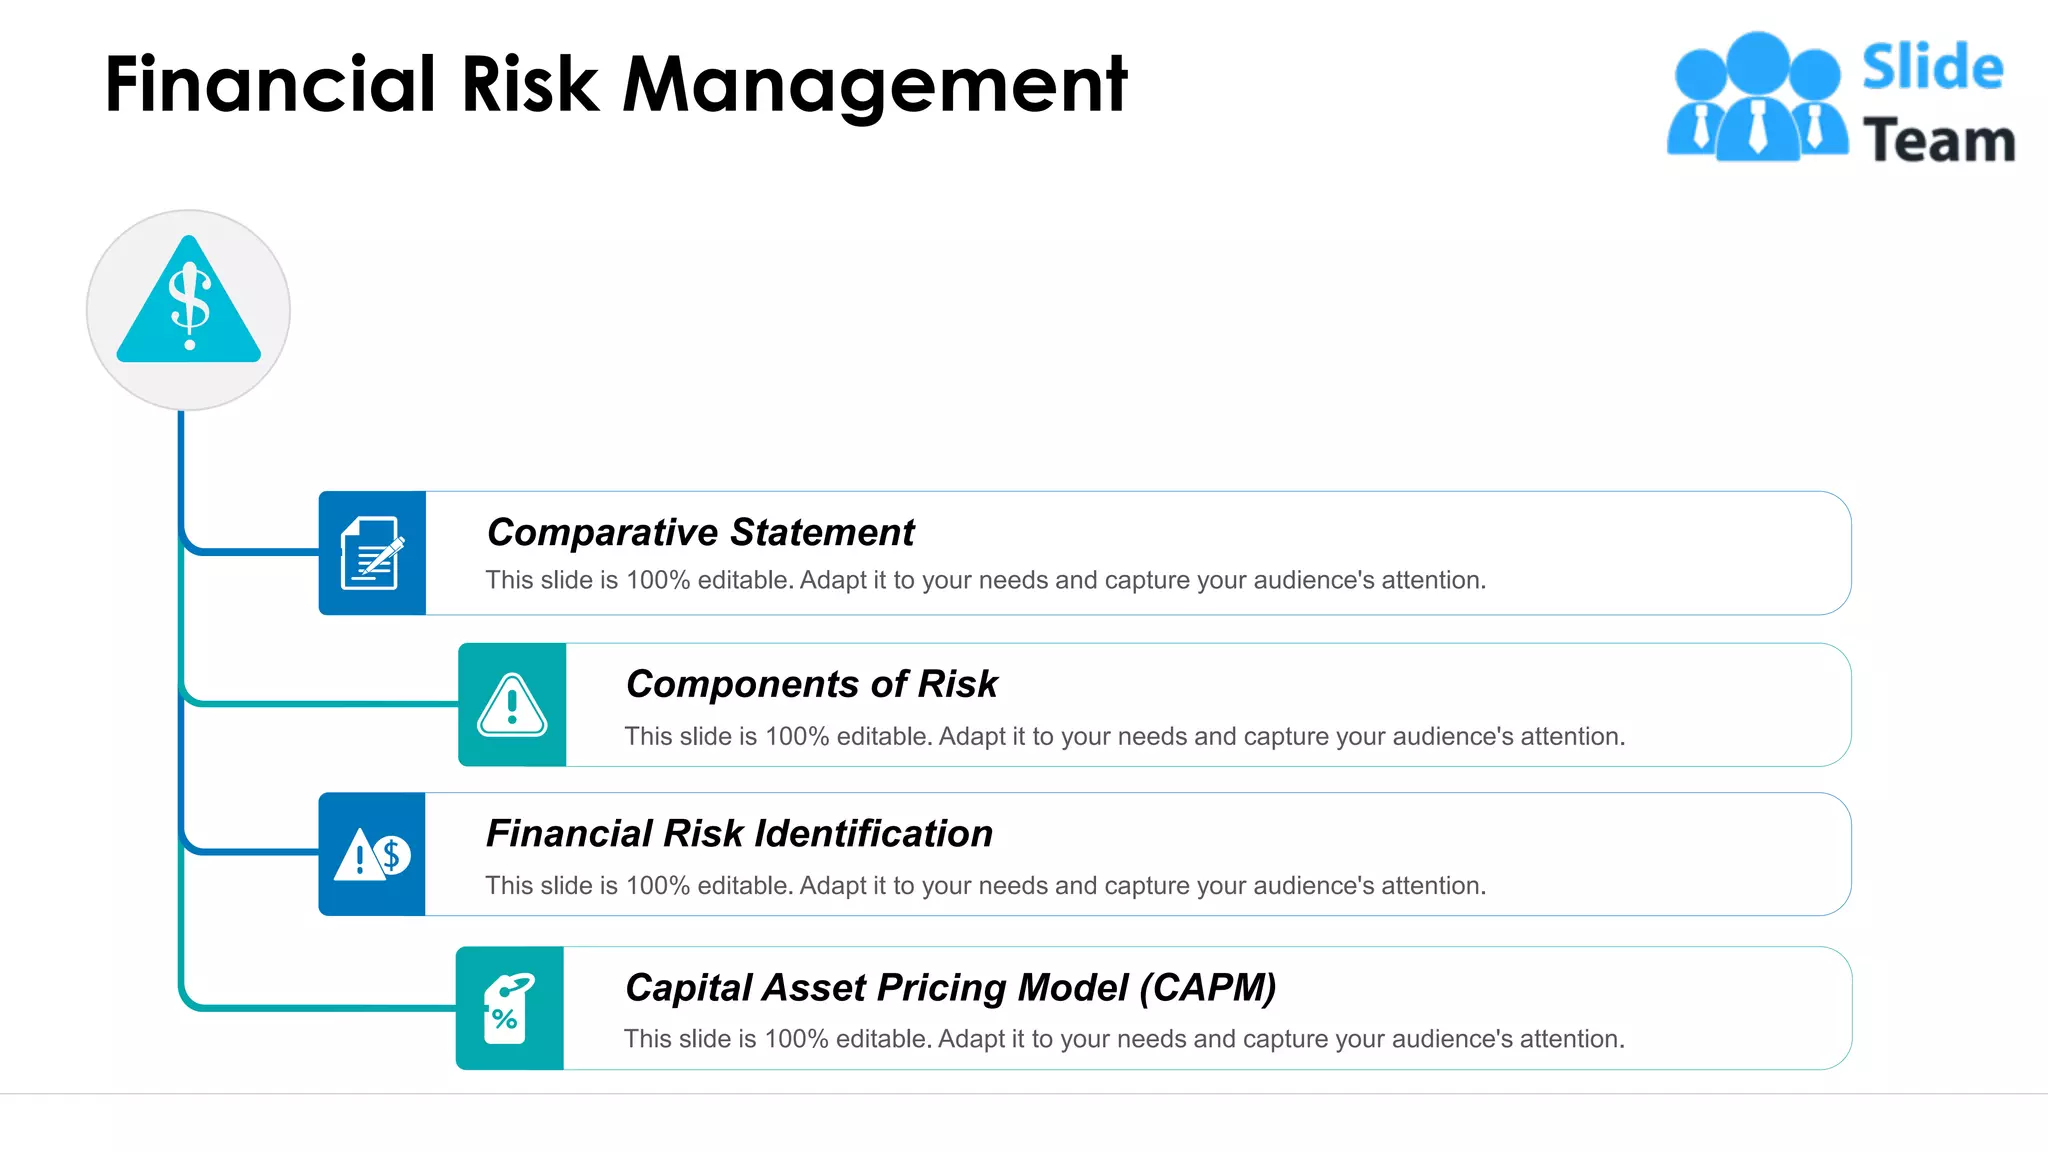


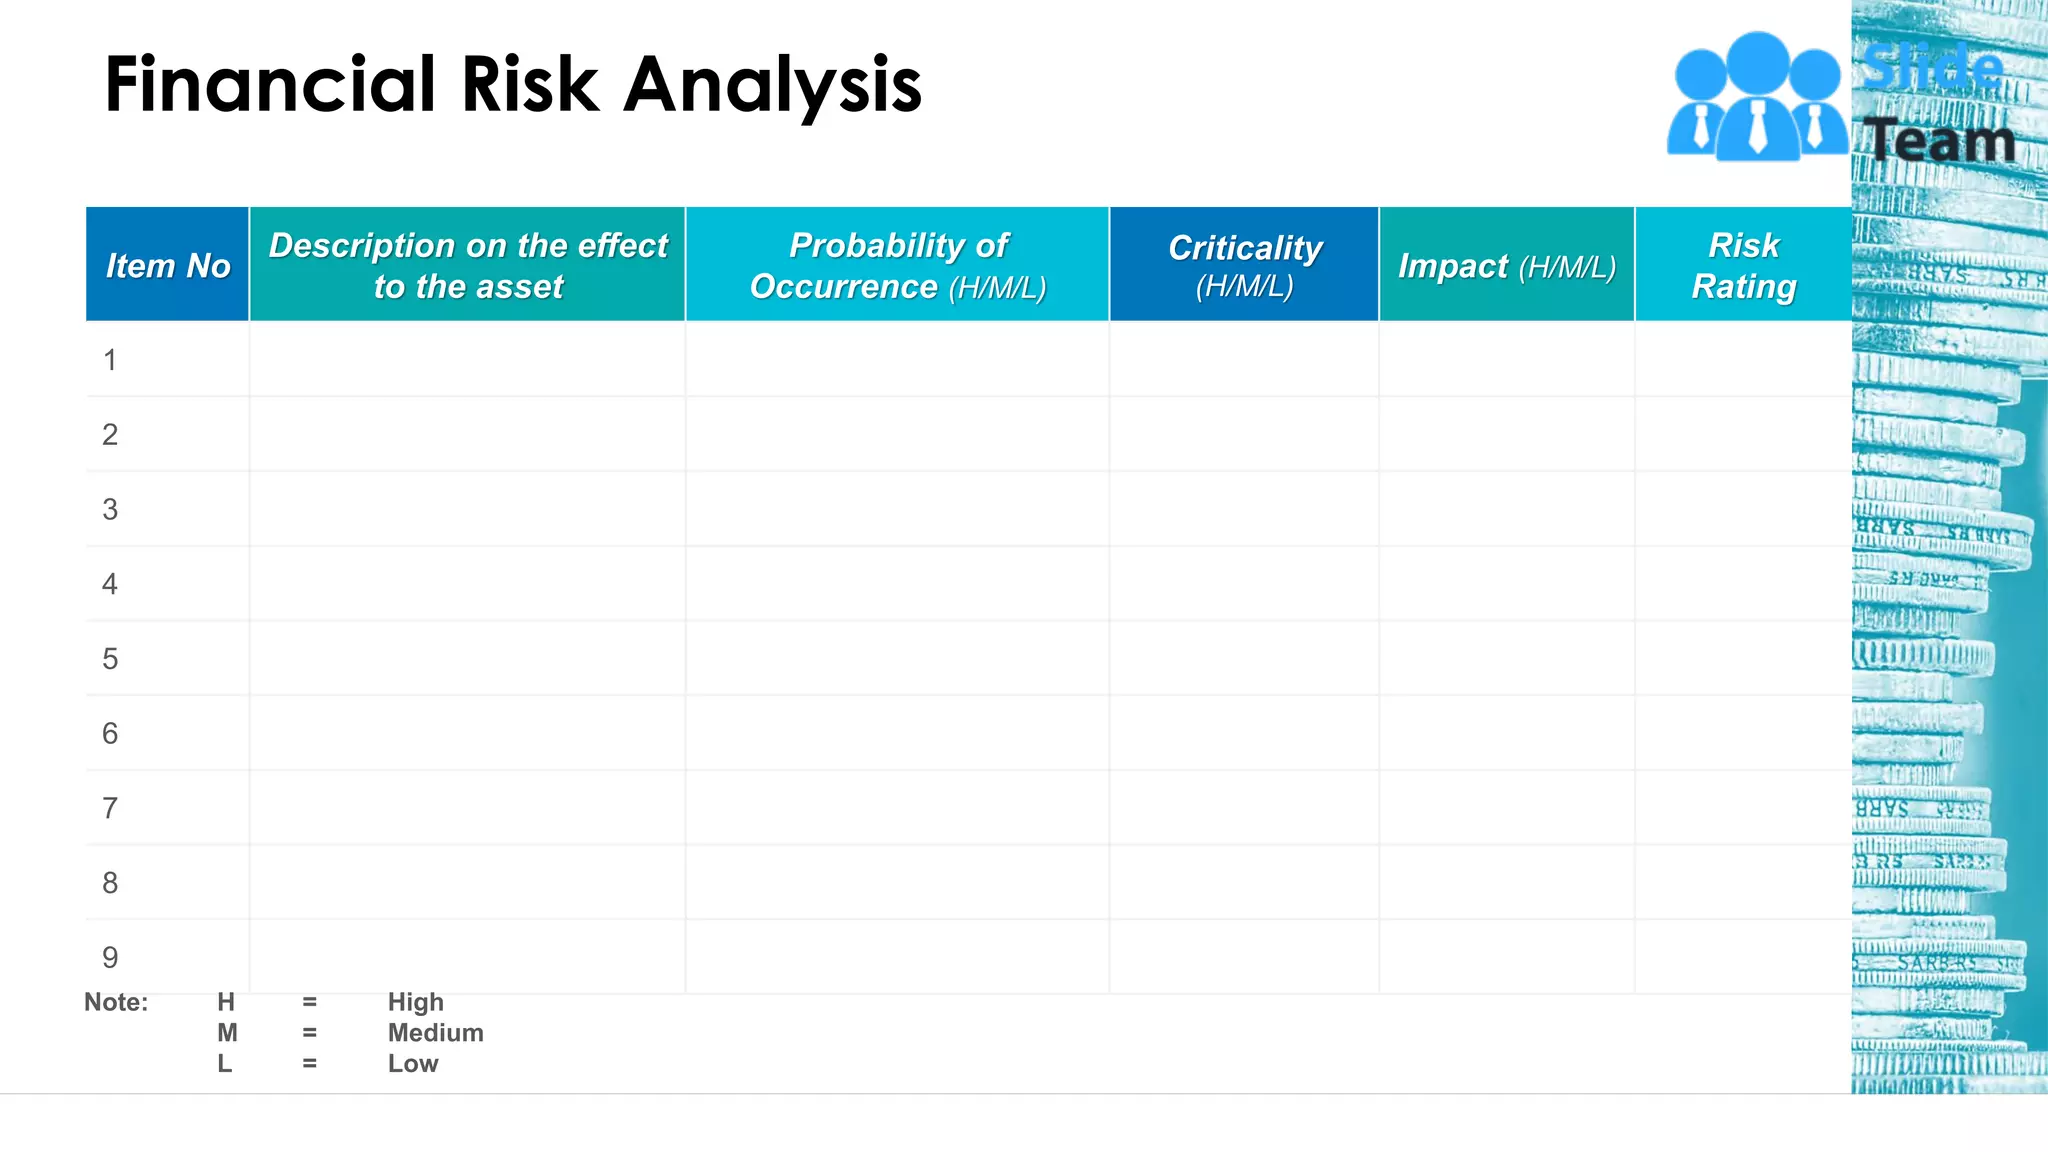
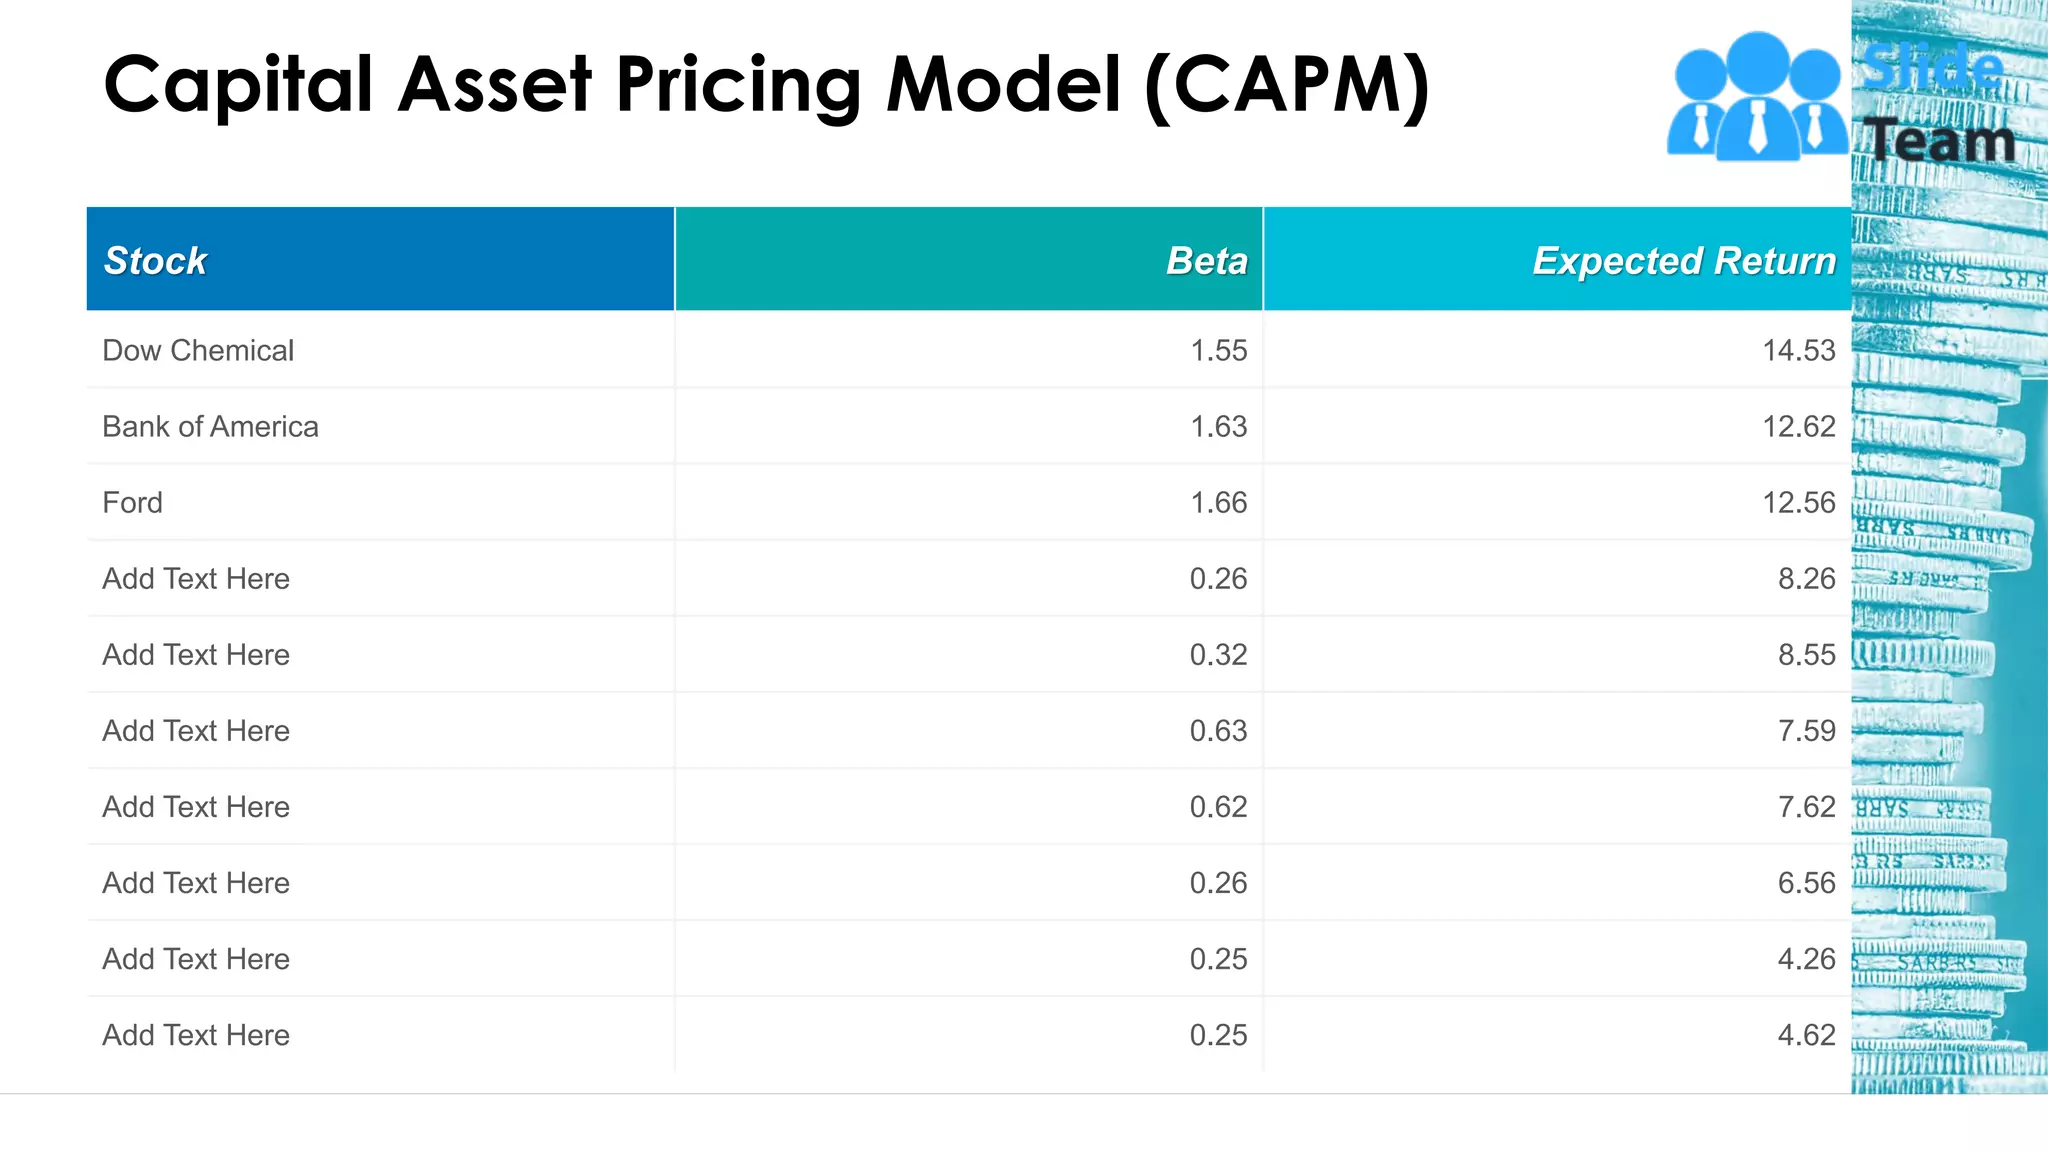


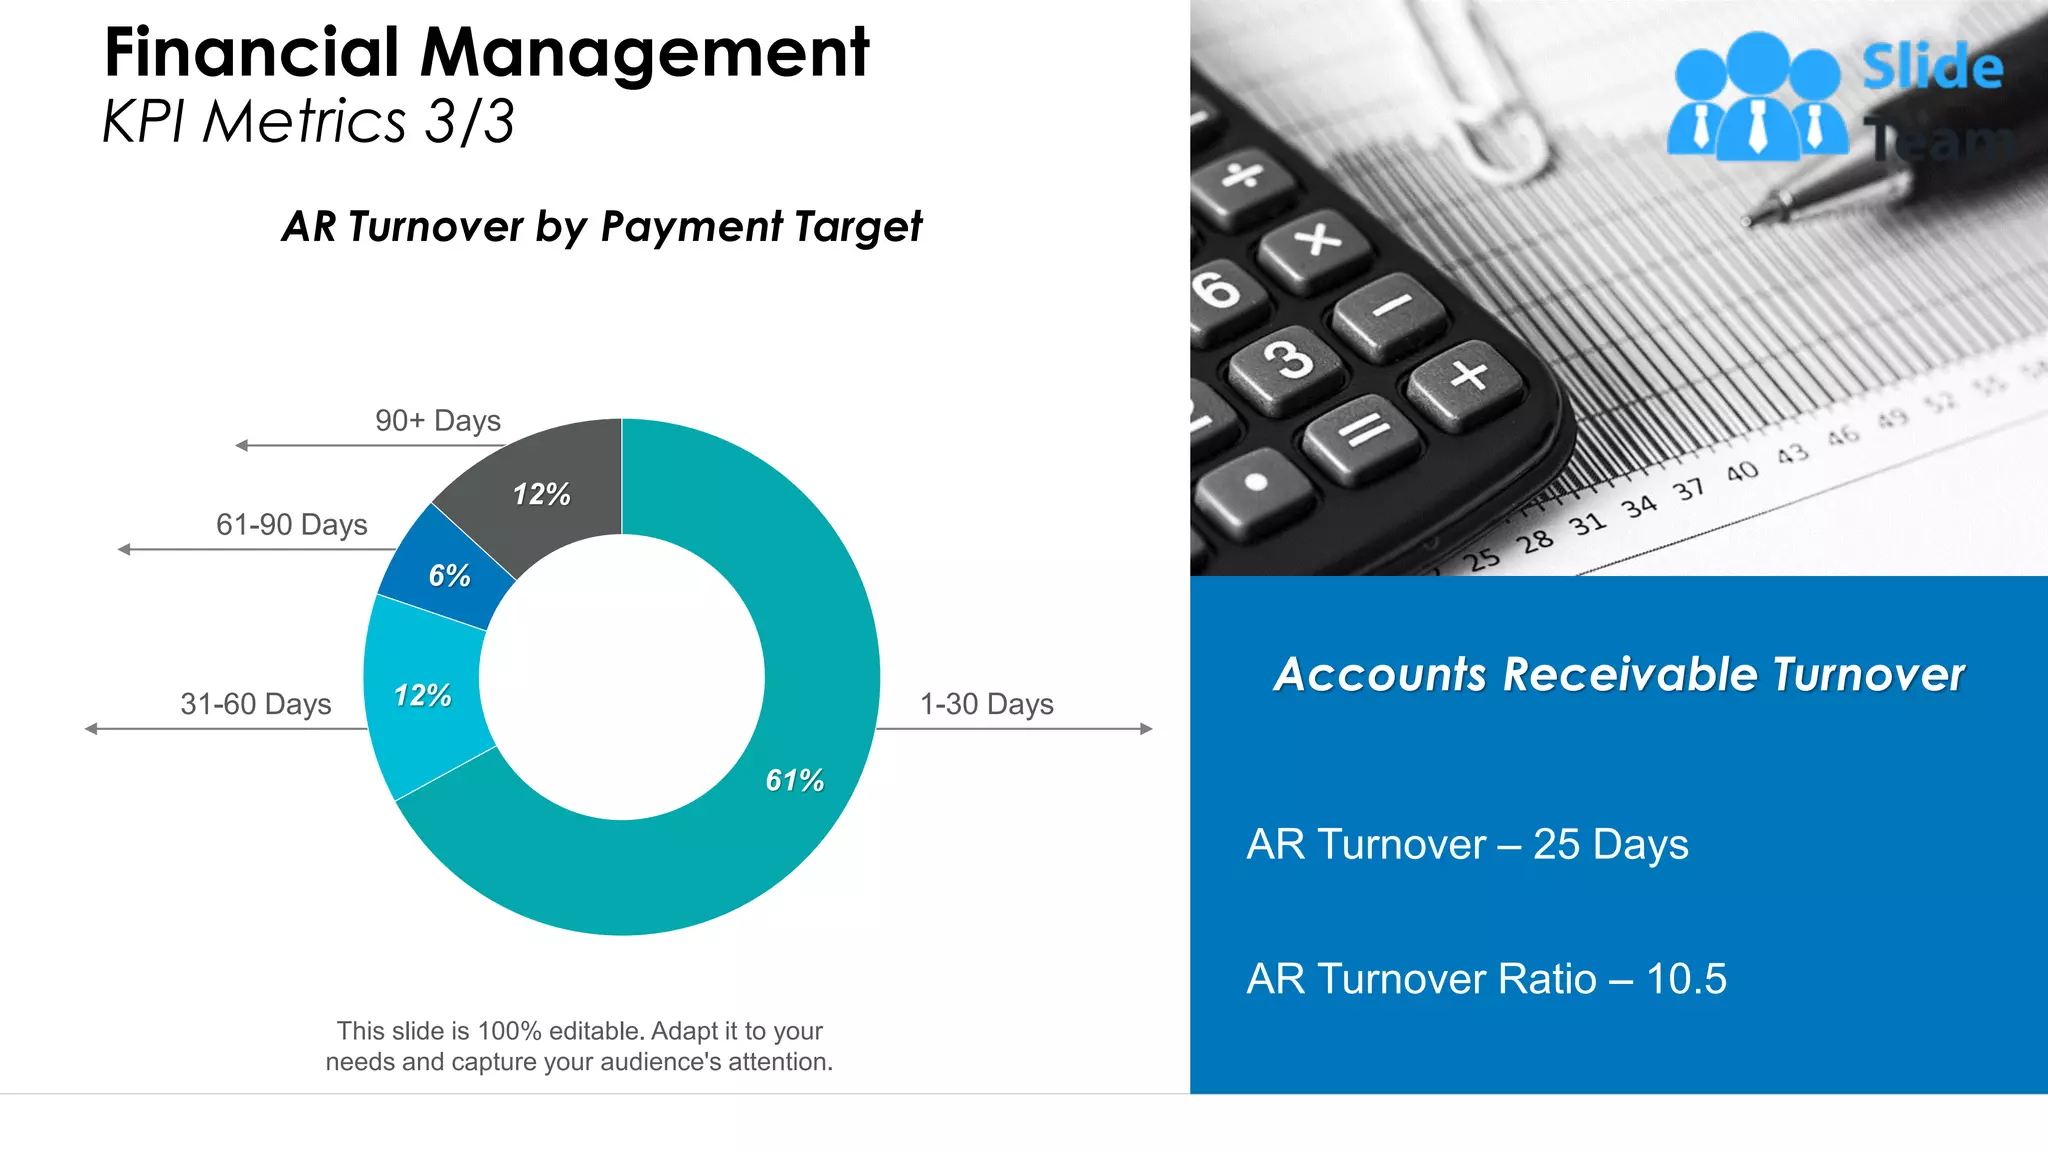
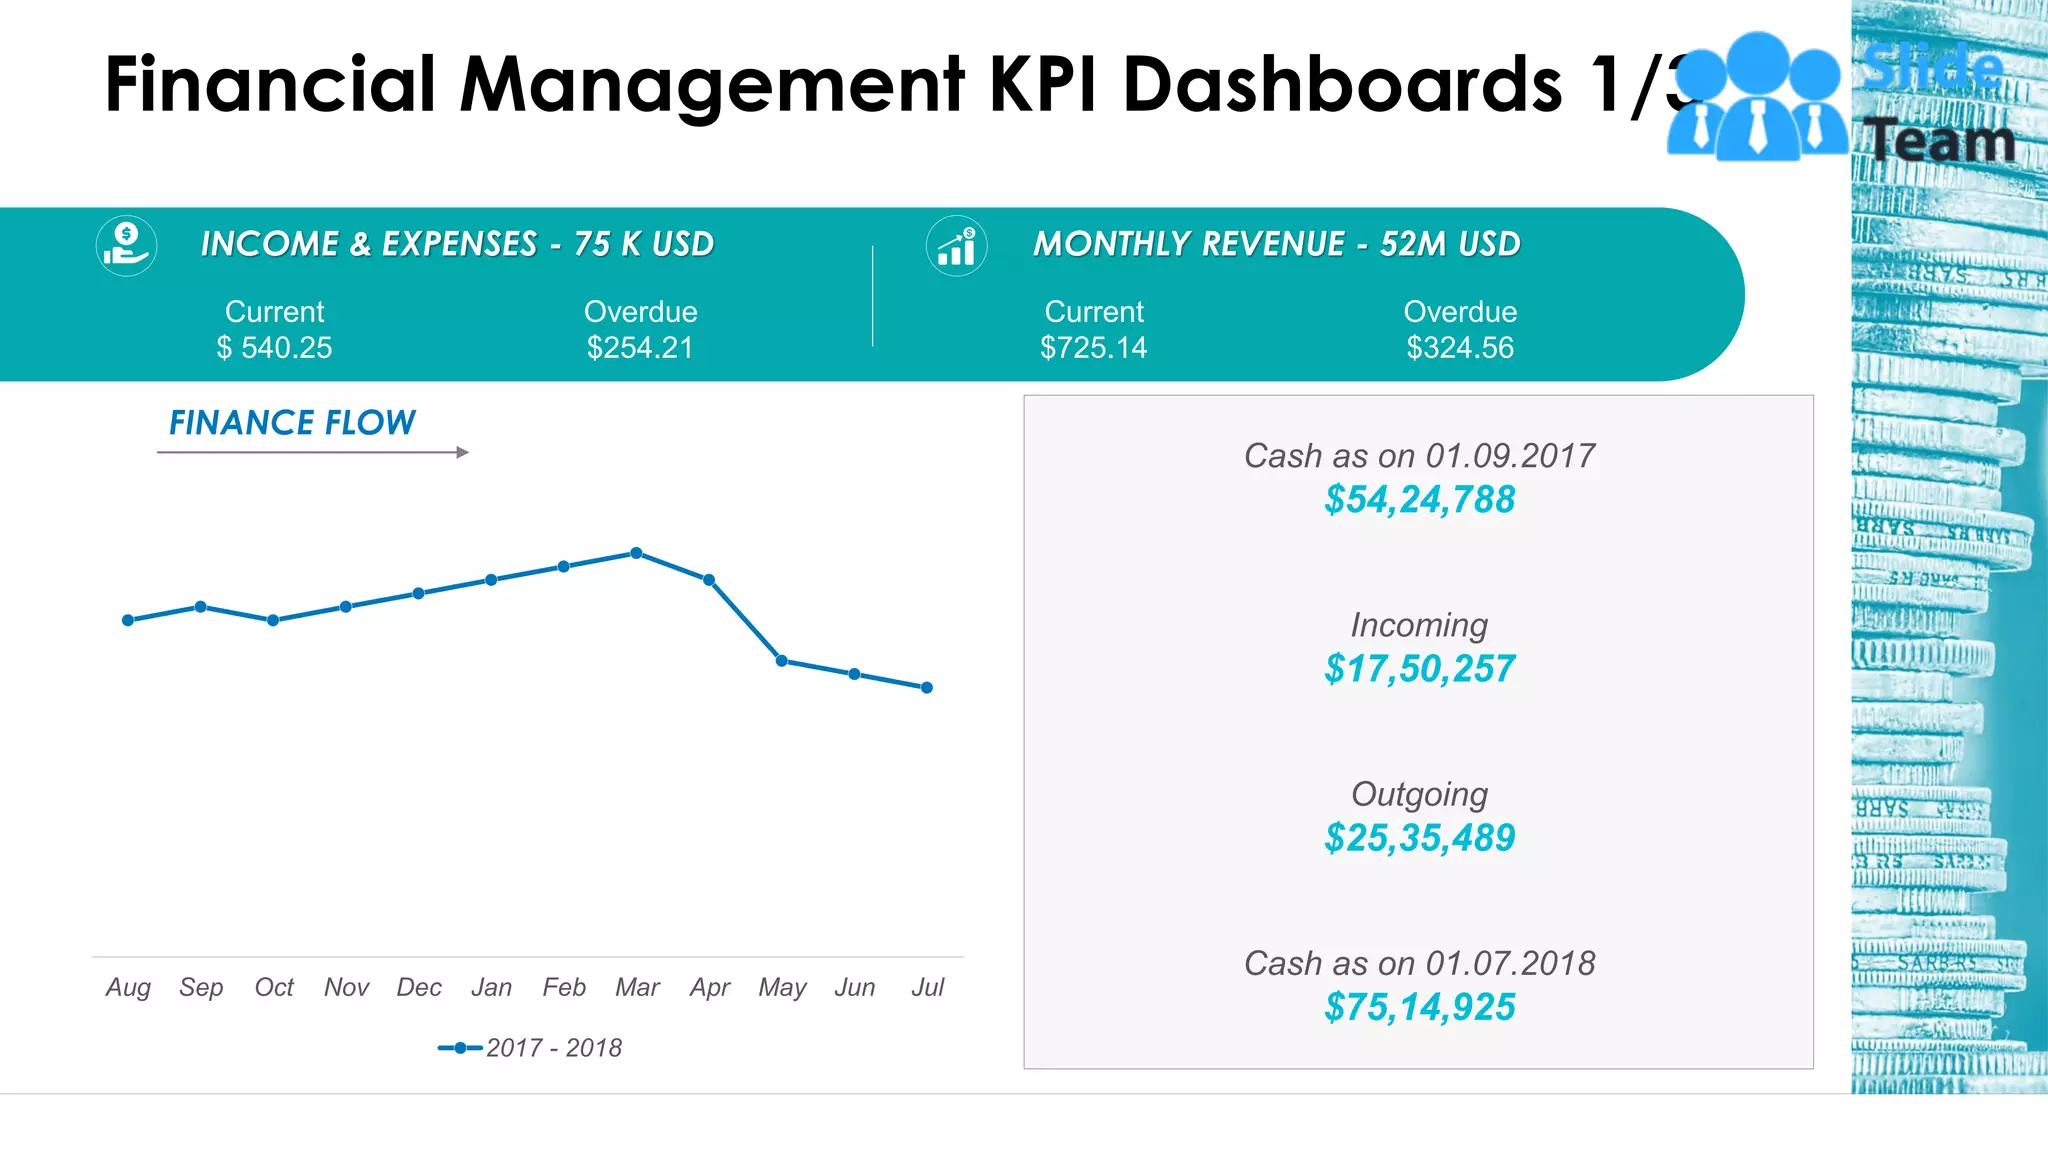


This document provides an outline and overview of topics related to financial management, including financial instruments, financial statements, cash flow, capital structure, working capital analysis, inventory management, the time value of money, and key performance indicators. The outline includes sections on financial instruments, financial statements, cash flow analysis, fixed capital analysis, capital structure and dividend policy, working capital analysis, inventory management, commodity exchange, financial risk management, the time value of money, and key performance indicators and dashboards.


