Download to read offline

![11
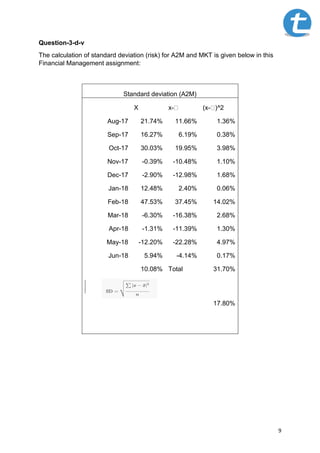
Question-3-d-vii
The calculation of expected return of A2M applying the CAPM model is given as
below:
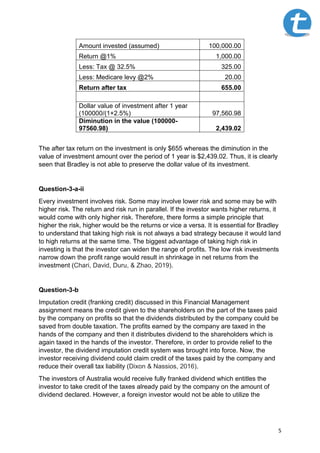
Where,
Ra = Expected return
Rrf = Risk free rate
Ba = Beta value of stock
Rm = Market return
Market return 9.55%
Risk free rate 2.29%
Beta 1.04
CAPM
[2.29%+(9.55%-
2.29%)*1.04] 9.84%
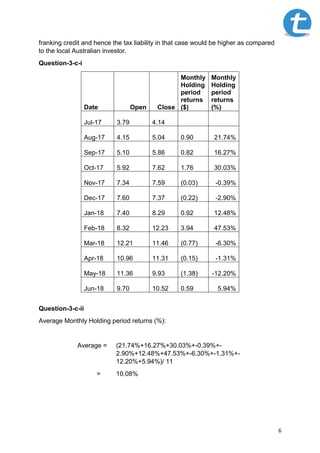
Question-3-d-viii
The SML chart for A2M is given below:
Figure 2: SML A2M](https://image.slidesharecdn.com/financial-management-assignment-questions-with-answers-200530113956/85/Financial-Management-assignment-Questions-Answers-11-320.jpg)

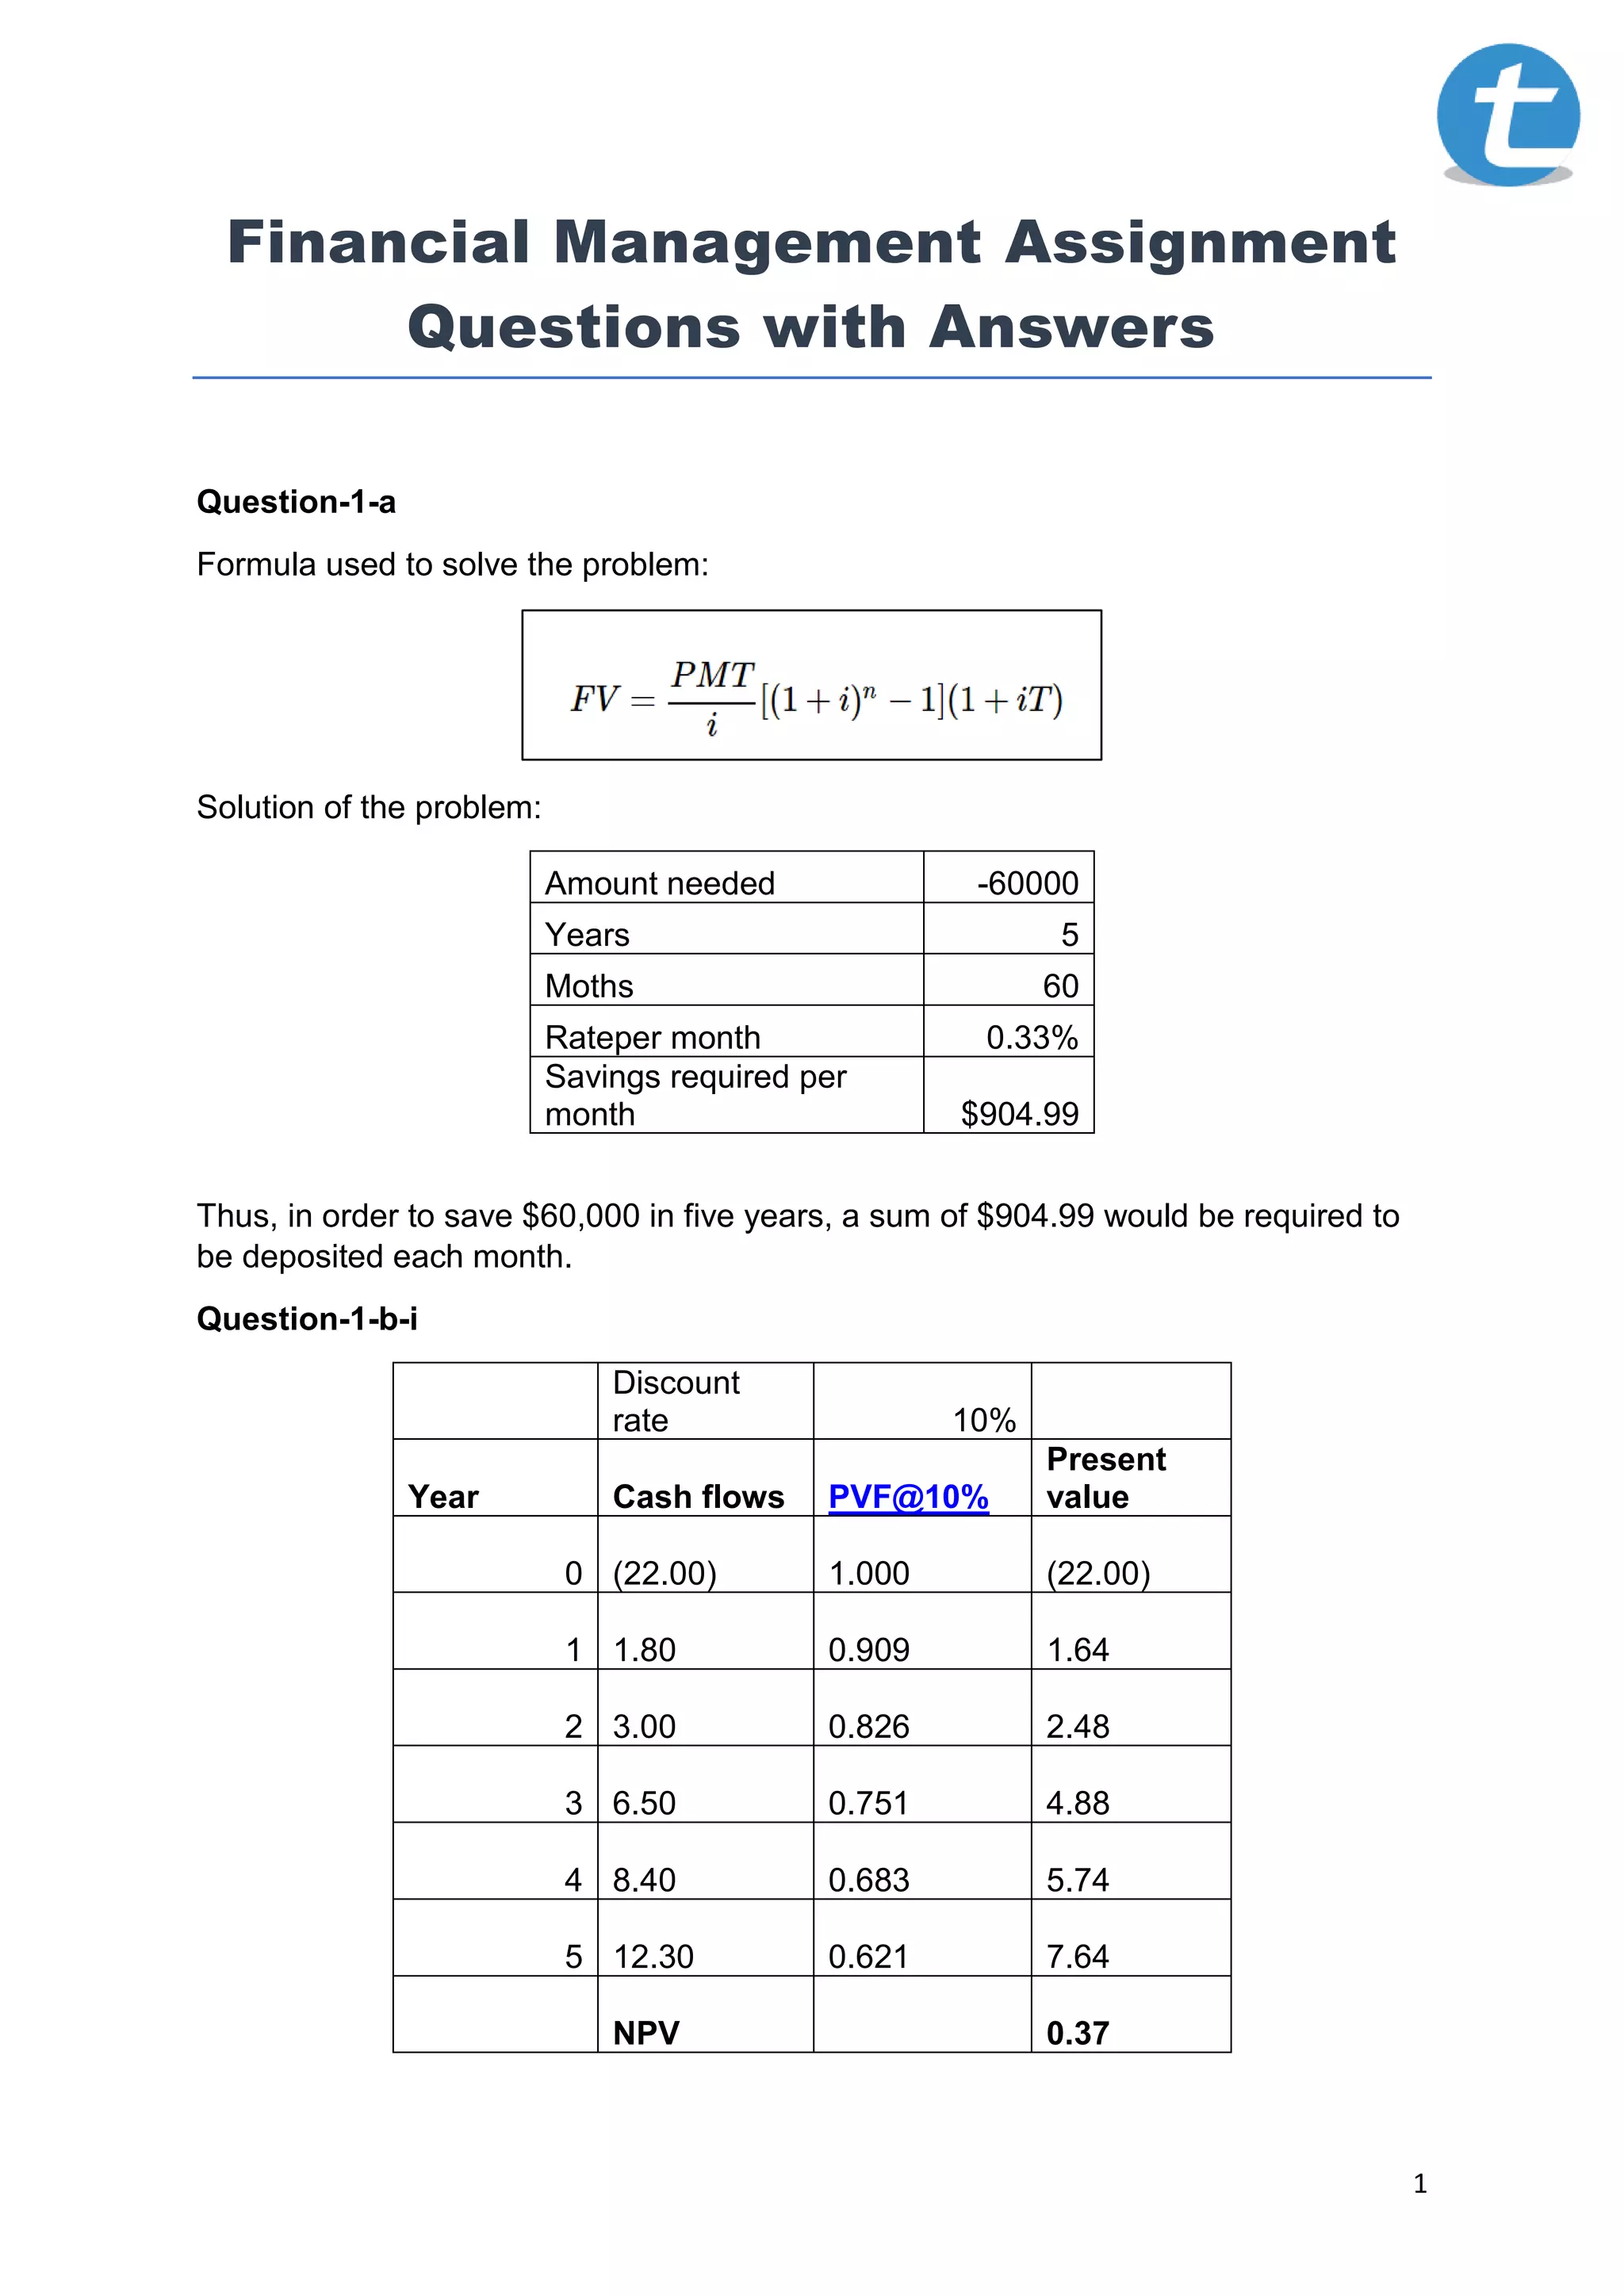
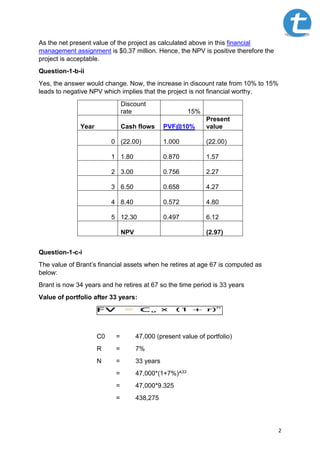
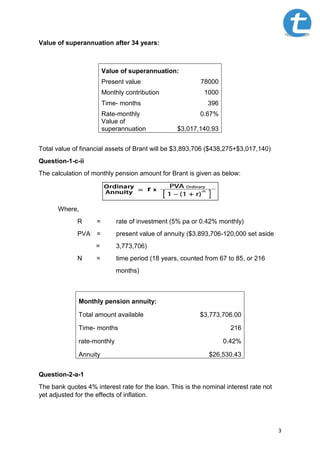
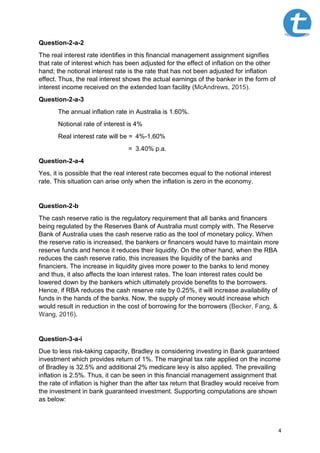
This document contains solutions to various financial management assignment questions. It includes calculations to determine the monthly savings required to accumulate $60,000 over 5 years, NPV calculations at different discount rates, computing future values of investments and superannuation, calculating monthly pension amounts, real vs nominal interest rates, effects of changing cash reserve ratios, risk-return tradeoffs of different investments, imputation credits, monthly/annual returns of stocks, standard deviation and beta calculations using CAPM model, and constructing a portfolio with expected return. Formulas and step-by-step workings are provided for all calculations.


![Budget: What is it? [Organization of Money] - PowerPoint:](https://cdn.slidesharecdn.com/ss_thumbnails/budgetwhatisit-101007182949-phpapp01-thumbnail.jpg?width=640&height=640&fit=bounds)


![Million Dollar Savings Plan Ten Years[1]](https://cdn.slidesharecdn.com/ss_thumbnails/milliondollarsavingsplantenyears1-12588307801213-phpapp01-thumbnail.jpg?width=640&height=640&fit=bounds)


