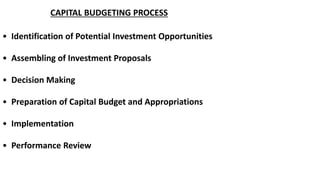
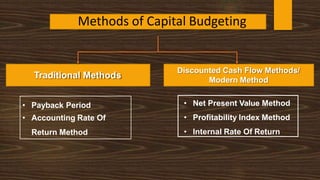
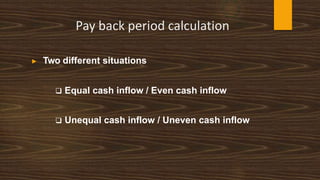
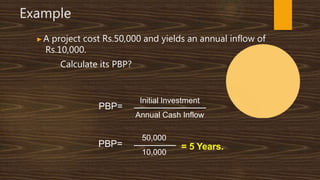
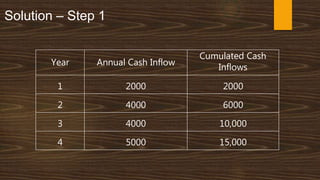
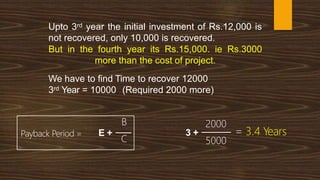
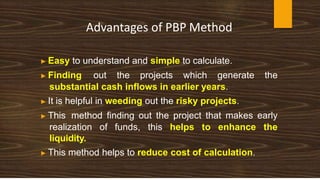
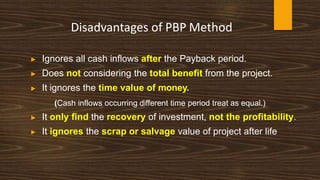
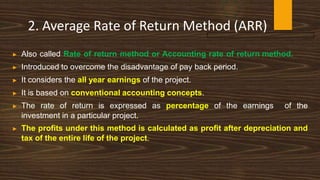
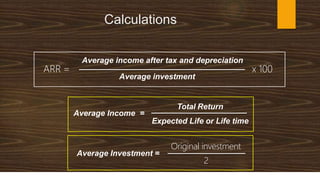
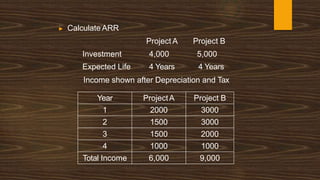
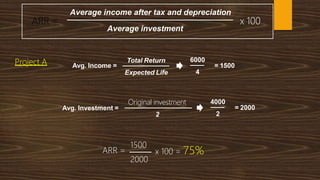
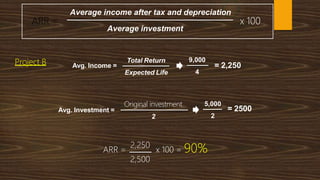
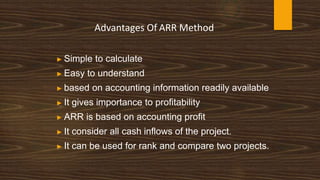
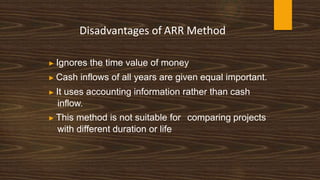
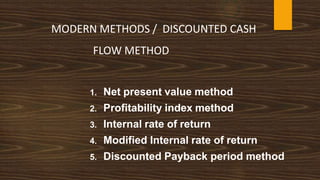
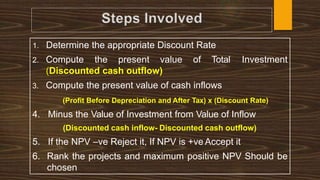
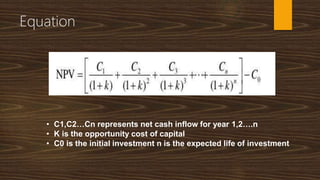
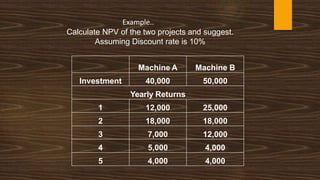
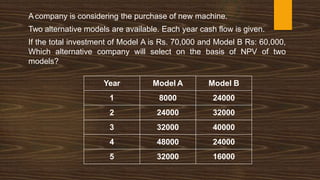
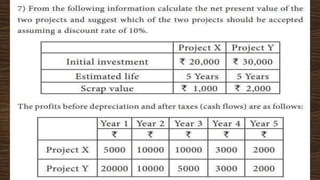
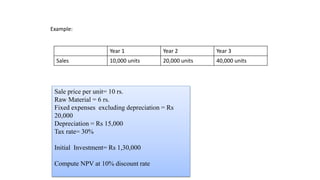
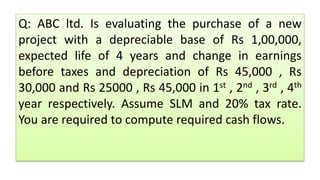
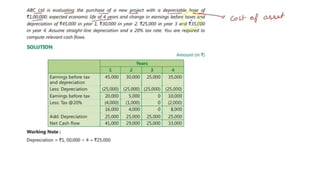
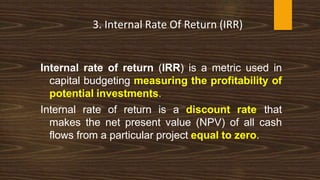
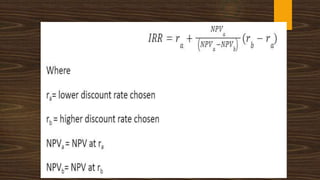
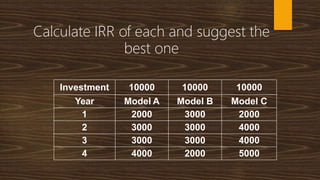
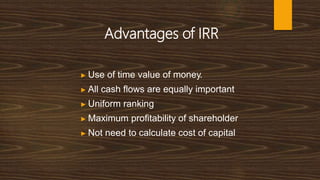
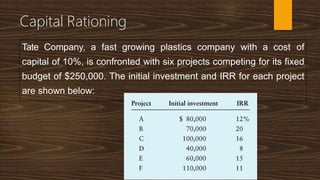
.
▶Investment Decision
— Capital Budgeting Techniques
— Pay Back Method
— Accounting Rate Of Return
— NPV
— IRR
— Discounted Pay Back Method
— Capital Rationing
— Risk Adjusted Techniques Of Capital Budgeting.
— Capital Budgeting Practices.
What is an Investment?
▶ In an economic sense, an investment is the
purchase of goods that are not consumed
today but are used in the future to create wealth.
▶ In finance, an investment is a monetary
asset purchased with the idea that the asset will
provide income in the future or will later be sold
at a higher price for a profit.
Investment Analysis
Investment analysis, defined as the process
of evaluating an investment for profitability
and risk, ultimately has the purpose of
measuring how the given investment is a
good fit for a portfolio.
What is Capital Budgeting?
▶ Capital budgeting is the planning process
used to determine whether an organization’s
long term investments such as new
machinery, replacement machinery, new
plants, new products, and research
development projects are worth the funding
of cash through the firm’s capitalization
structure.
Definition- Capital Budgeting
“Capital budgeting is long term planning
for making and financing proposed
capital outlays”
- Charles T
Horngreen.
Features Of Capital Budgeting
a. Potentially large anticipated benefits
b. A relatively high degree of risk
c. Relatively long time period between the initial
outlay and the anticipated return. (Long
term return/ Benefits)
d. They are irreversible in nature
Need for Capital Budgeting
 Large investments
 Irreversible nature
 Difficulties of investment decision
 Long term effect on profitability
 To avoid over investment and under investments.
CAPITAL BUDGETING PROCESS
• Identification of Potential Investment Opportunities
• Assembling of Investment Proposals
• Decision Making
• Preparation of Capital Budget and Appropriations
• Implementation
• Performance Review
Methods of Capital Budgeting
Traditional Methods
Discounted Cash Flow Methods/
Modern Method
• Payback Period
• Accounting Rate Of
Return Method
• Net Present Value Method
• Profitability Index Method
• Internal Rate Of Return
Pay Back Period Method
It refers to the period in which the project will
generate the necessary cash to recover the
initial investment.
▶ Also called “Pay Out Or Pay Off Period
Method”
▶ It does not take the effect of time value of
money.
▶ The selection of the project is based on the
earning capacity of a project.
▶ It emphasizes more on annual cash inflows, economic
life of the project and original investment.
▶It involves simple calculation, selection or rejection of the
project can be made easily, results obtained is more
reliable, best method for evaluating high risk projects.
▶Under this method projects are ranked on the basis of
length of payback period
Pay back period calculation
▶ Two different situations
 Equal cash inflow / Even cash inflow
 Unequal cash inflow / Uneven cash inflow
Initial Investment
Annual Cash Inflow
Note: Annual cash inflow is the annual earnings
(Profit before depreciation and after tax)
1. Equal Cash Inflow / Even Cash Inflow
Pay Back Period =
2. Un Even Cash Inflow
Payback Period =
B
E +
C
Where,
E = No. of years immediately preceding the year of payback
B = Balance to be recovered
C = Cash flow during the year of recovery
Example
▶A project cost Rs.50,000 and yields an annual inflow of
Rs.10,000.
Calculate its PBP?
Initial Investment
Annual Cash Inflow
PBP=
50,000
10,000
PBP= = 5 Years.
Example
▶ Un even cash inflows
Determine PBP for a project which requires a cash outlay of
Rs.12,000 and generates cash inflows of Rs. 2000, Rs.4000,
Rs.4000 and Rs.5000 in the first, Second, third, fourth years
respectively.
Solution – Step 1
Year Annual Cash Inflow
Cumulated Cash
Inflows
1 2000 2000
2 4000 6000
3 4000 10,000
4 5000 15,000
Upto 3rd year the initial investment of Rs.12,000 is
not recovered, only 10,000 is recovered.
But in the fourth year its Rs.15,000. ie Rs.3000
more than the cost of project.
We have to find Time to recover 12000
3rd Year = 10000 (Required 2000 more)
2000
5000
3 +
B
C
E +
Payback Period = = 3.4 Years
Problem - 1
Capital cost of three models of machine is Rs. 90,000 each and
the estimated life is 4 years. Annual returns of each machine are
given below. Decide the model of machine to be chosen on the
basis of Pay back period.
Year Model A Model B Model C
1 20,000 30,000 35,000
2 30,000 40,000 35,000
3 50,000 50,000 35,000
4 50,000 20,000 35,000
Problem - 2
Initial outlay for each of the following projects is Rs. 15,000 &
standard payback is 3 years. Evaluate the projects and rank
them based on payback period
Year ProjectA Project B Project C Project D
1 5,000 3,500 2,500 8,000
2 5,000 4,000 2,500 6,000
3 5,000 4,500 2,500 6,000
4 5,000 6,000 2,500 5,000
5 5,000 6,000 2,500 5,000
Advantages of PBP Method
▶ Easy to understand and simple to calculate.
▶ Finding out the projects which generate the
substantial cash inflows in earlier years.
▶ It is helpful in weeding out the risky projects.
▶ This method finding out the project that makes early
realization of funds, this helps to enhance the
liquidity.
▶ This method helps to reduce cost of calculation.
Disadvantages of PBP Method
▶ Ignores all cash inflows after the Payback period.
▶ Does not considering the total benefit from the project.
▶ It ignores the time value of money.
(Cash inflows occurring different time period treat as equal.)
▶ It only find the recovery of investment, not the profitability.
▶ It ignores the scrap or salvage value of project after life
2. Average Rate of Return Method (ARR)
▶ Also called Rate of return method or Accounting rate of return method.
▶ Introduced to overcome the disadvantage of pay back period.
▶ It considers the all year earnings of the project.
▶ It is based on conventional accounting concepts.
▶ The rate of return is expressed as percentage of the earnings of the
investment in a particular project.
▶ The profits under this method is calculated as profit after depreciation and
tax of the entire life of the project.
Calculations
Average income after tax and depreciation
Average investment
ARR = x 100
Average Income =
Total Return
Expected Life or Life time
Average Investment =
Original investment
2
+ Additional W/C
If scrap value or additional working capital is given
Average Investment =
Original investment + SV
2
▶ Calculate ARR
Project A Project B
Investment 4,000 5,000
Expected Life 4 Years 4 Years
Income shown after Depreciation and Tax
Year ProjectA Project B
1 2000 3000
2 1500 3000
3 1500 2000
4 1000 1000
Total Income 6,000 9,000
Average income after tax and depreciation
Average investment
ARR = x 100
Project A Avg. Income =
Total Return
Expected Life
6000
4
= 1500
Avg. Investment =
Original investment
2
4000
2
= 2000
2000
ARR =
1500
x 100 = 75%
Average income after tax and depreciation
Average investment
ARR = x 100
Project B Avg. Income =
Total Return
Expected Life
9,000
4
= 2,250
Avg. Investment =
Original investment
2
5,000
2
= 2500
ARR =
2,250
x 100 = 90%
2,500
▶ Calculate ARR
ProjectA Project B
Investment 50,000 50,000
Expected Life 5 Years 5 Years
Scrap Value 7000 3000
Year Project A Project B
1 6,000 7,000
2 9,000 8,000
3 10,000 10,000
4 12,000 12,000
5 14,000 16,000
Total Income 51,000 53,000
Advantages Of ARR Method
▶ Simple to calculate
▶ Easy to understand
▶ based on accounting information readily available
▶ It gives importance to profitability
▶ ARR is based on accounting profit
▶ It consider all cash inflows of the project.
▶ It can be used for rank and compare two projects.
Disadvantages of ARR Method
▶ Ignores the time value of money
▶ Cash inflows of all years are given equal important.
▶ It uses accounting information rather than cash
inflow.
▶ This method is not suitable for comparing projects
with different duration or life
MODERN METHODS / DISCOUNTED CASH
FLOW METHOD
1. Net present value method
2. Profitability index method
3. Internal rate of return
4. Modified Internal rate of return
5. Discounted Payback period method
Net present value method
▶ It recognizes the impact of time value of money. It is
considered as the best method of evaluating the capital
investment proposal.
▶ It is widely used in practice.
▶ The cash inflow to be received at different period of time
will be discounted at a particular discount rate.
▶ The present values of the cash inflow are compared with
the original investment.
▶ The difference between the two will be used for accept or
reject criteria.
Cash
Outflow/
Investment
Future Cash
Inflow/
Return
Present Value
NPV= Discounted cash inflow - Discounted cash
outflow
Note1 : If only in the beginning initial
investment is made, then the discounted cash
outflow will be the same i.e., initial investment
Note2 : Cash inflow means profit before
depreciation and after tax
Acceptance Role
If NPV is
▶ Positive value
▶ Zero
▶ Negative Value
1. Determine the appropriate Discount Rate
2. Compute the present value of Total Investment
(Discounted cash outflow)
3. Compute the present value of cash inflows
(Profit Before Depreciation and After Tax) x (Discount Rate)
4. Minus the Value of Investment from Value of Inflow
(Discounted cash inflow- Discounted cash outflow)
5. If the NPV –ve Reject it, If NPV is +ve Accept it
6. Rank the projects and maximum positive NPV Should be
chosen
Equation
• C1,C2…Cn represents net cash inflow for year 1,2….n
• K is the opportunity cost of capital
• C0 is the initial investment n is the expected life of investment
Example..
Calculate NPV of the two projects and suggest.
Assuming Discount rate is 10%
Machine A Machine B
Investment 40,000 50,000
Yearly Returns
1 12,000 25,000
2 18,000 18,000
3 7,000 12,000
4 5,000 4,000
5 4,000 4,000
Machine - A
12000
(1+0.1)
18000
(1+0.1) 2
+
7000
(1+0.1) 3
+
5000
(1+0.1) 4
+
4000
(1+0.1)5
+ - 40,000
NPV =
NPV = 10,909 + 14,876 + 5,259 + 3415 + 2484 - 40,000
NPV = 36,943 - 40,000 = - 3,057
Machine - B
25000
(1+0.1)
18000
(1+0.1) 2
+
12000
(1+0.1) 3
+
4000
(1+0.1) 4
+
4000
(1+0.1)5
+ - 50,000
NPV =
NPV = 22,727 + 14,876 + 9016 + 2732 + 2484 - 50,000
NPV = 51835 - 50,000 = 1835
NPV
Machine A = - 3057
Machine B = 1835
Machine B is the best investment opportunity
A company is considering the purchase of new machine.
Two alternative models are available. Each year cash flow is given.
If the total investment of Model A is Rs. 70,000 and Model B Rs: 60,000,
Which alternative company will select on the basis of NPV of two
models?
Year Model A Model B
1 8000 24000
2 24000 32000
3 32000 40000
4 48000 24000
5 32000 16000
Example:
Year 1 Year 2 Year 3
Sales 10,000 units 20,000 units 40,000 units
Sale price per unit= 10 rs.
Raw Material = 6 rs.
Fixed expenses excluding depreciation = Rs
20,000
Depreciation = Rs 15,000
Tax rate= 30%
Initial Investment= Rs 1,30,000
Compute NPV at 10% discount rate
.
Q: ABC ltd. Is evaluating the purchase of a new
project with a depreciable base of Rs 1,00,000,
expected life of 4 years and change in earnings
before taxes and depreciation of Rs 45,000 , Rs
30,000 and Rs 25000 , Rs 45,000 in 1st , 2nd , 3rd , 4th
year respectively. Assume SLM and 20% tax rate.
You are required to compute required cash flows.
Advantages of NPV Method
▶ It consider the time value of money
▶ Converting future cash inflows to discounted present value.
▶ Consider entire life cash inflows
▶ Objective of maximizing owner’s wealth
▶ Can be estimated and compared to take a decision.
▶ It is based on profitability and liquidity.
Disadvantages of NPV Method
▶ Computation is difficult
▶ It is not easy to appropriate and determine discount rate.
▶ Difficulty to estimate cash inflows due to uncertainty
• The profitability index is an index that attempts to identify the
relationship between the costs and benefits of a
proposed project through the use of a ratio.
• Profitability index (PI), also known as profit investment
ratio (PIR) and value investment ratio (VIR), is the ratio of
payoff to investment of a proposed project.
Present value of cash inflow
Present value of cash outflow
PI is equal to or more than one, the proposal can be accepted
PI =
▶PI = 1
▶PI = > 1
▶PI = <1
Accept
Accept
Reject
Calculate PI of each project and suggest the best one.
Estimated discount rate is 12%
Project Co C1 C2 C3
A - 4,000 0 4,000 2,000
B - 4,000 2,000 2,000 0
C - 5,000 3,000 2,000 2,000
D - 5,000 2,000 3,000 2,000
Advantages Of Profitability Index (PI)
1. PI considers the time value of money.
2. PI considers analysis all cash flows of entire life.
3. PI makes the right in the case of different amount of
cash outlay of different project.
4. PI ascertains the exact rate of return of the project
Disadvantages Of Profitability Index(PI)
1. It is difficult to understand interest rate or discount
rate.
2. It is difficult to calculate if two projects having
different period of life.
Internal rate of return (IRR) is a metric used in
capital budgeting measuring the profitability of
potential investments.
Internal rate of return is a discount rate that
makes the net present value (NPV) of all cash
flows from a particular project equal to zero.
3. Internal Rate Of Return (IRR)
Discounted
Cash inflow
Discounted
Cash outflow 0
Discount Rate ?
IRR is that rate at which the sum of discounted cash inflow
equals the sum of discounted cash outflows
L =
P1 =
P2 =
Q =
D =
Lower discount rate
Present Value at lower (%) rate
Present Value at higher (%) rate
Actual investment
Difference in rate (%)
P1 – Q
IRR = L+ x D
P1 - P2
Calculate IRR of each and suggest the
best one
Investment 10000 10000 10000
Year Model A Model B Model C
1 2000 3000 2000
2 3000 3000 4000
3 3000 3000 4000
4 4000 2000 5000
Advantages of IRR
▶ Use of time value of money.
▶ All cash flows are equally important
▶ Uniform ranking
▶ Maximum profitability of shareholder
▶ Not need to calculate cost of capital
Disadvantages of IRR
▶ T
o understand IRR is difficult
▶ Not Helpful for comparing two different investment
▶ Unrealistic Assumption
Discounted Payback Period
▶ Payback period by considering time value of money.
▶ A project’s discounted payback period is the number
of years it takes for the net cash flows’ present values
to pay back the net investment.
▶ Shorter paybacks are better than longer paybacks.
Year Cash Flow
1 70,000
2 70,000
3 70,000
4 70,000
5 70,000
Example.
Investment 2,00,000
Opportunity cost : 10%
MIRR
• MIRR= (Future value/initial investment) 1/n -1
• Whereas FV=Present value(1+i)n
MODIFIED IRR
0 1 2 3 4 5 6
-120 -80 20 60 80 100 120
r=15% 115
-69.6 r =15% r =15% 105.76
PVC = 189.6 r =15% 91.26
r =15% 34.98
Terminal value (TV) = 467
PV = 189.6 MIRR = 16.2%
of TV
NPV 0
 Centre for Financial Management , Bangalore
More to Capital Budgeting
“
”
Capital Rationing
Capital Rationing
▶ Related to Capital Budgeting
▶ Related to Investment
▶ When
▶ More investment options are available
▶ But limited resources are available (Shortage of Finance)
▶ Need to choose the best options
▶ Helps to prioritise the options based on profitability
▶ Helping to select the appropriate projects
Capital Rationing
• Capital rationing situation refers to the choice of investment
proposal under financial constraints.
• Capital rationing is applied when a firm has a number of
acceptable investment proposal but the resource available
is restricted to certain extend
Capital Rationing providing answers to
▶The required fund?
▶Available Fund?
▶How to assign the available fund?
Steps in Capital Rationing
1. Ranking projects (By use of any profitability measures)
(NPV,IRR,PI)
2. Selecting projects in descanting order of profitability
until the budget exhausted
Factors Leading to Capital Rationing
🠊 Internal Factors
🠊Restriction by management
🠊T
op mgt. Philosophy towards
capital spending
🠊Fear about current commitments
🠊Fund from current operations
🠊Feasibility of acquiring new fund
🠊 External Factors
🠊External Factors
🠊Imperfection of capital market
🠊Govt. Regulations
Types of capital rationing
imposed by the
1. Soft capital rationing
▶ It is when restriction is
Management (Internal Factors)
2. Hard capital Rationing
▶It is when capital infusion is limited by external
sources (External Factors)
Advantages of capital rationing
1. Budget
2. No wastage
3. Fewer projects
4. Higher returns
5. More stability
1. Budget
• ▶Itintroduces a sense of strict budgeting of
corporate resources
2. No wastage
• ▶It prevents wastage of resources by not investing in
each and every new project available for investment
3. Fewer projects
• ▶
It ensures that less number of projects are
selected by imposing capital restrictions
4. Higher returns
▶ Invest only in projects where the expected return is high,
thus eliminating projects with lower returns in capital
5. More stability
▶ Since the company is selecting those projects where the
expected return is high, thus ensures stability for tough
times as well
▶ The required initial investment and Present value of inflows in
respect of 5 projects (A,B,C,D, and E) is given above. The total
funds available is Rs 13,00,000.
▶ Determine the optimal combination of projects under profitability
index
Project
Required initial
investment
Present value of
inflows
A 2,00,000 2,20,000
B 6,00,000 7,00,000
C 1,00,000 92,000
D 4,00,000 4,90,000
E 2,00,000 2,10,000
Project
Required
initial
investment
Present
value of
inflows
Profitability
Index
Ranking
Apportioning
available
capital
D 4,00,000 4,90,000 1.225 1 4,00,000
B 6,00,000 7,00,000 1.16667 2 6,00,000
A 2,00,000 2,20,000 1.1 3 2,00,000
E 2,00,000 2,10,000 1.05 4
1/2th of
Project E
C 1,00,000 92,000 0.92 5
Tate Company, a fast growing plastics company with a cost of
capital of 10%, is confronted with six projects competing for its fixed
budget of $250,000. The initial investment and IRR for each project
are shown below:
Capital Rationing

2.0 capital budgetingGOOD PRACTICAL.pptx

  • 1.
    . ▶Investment Decision — CapitalBudgeting Techniques — Pay Back Method — Accounting Rate Of Return — NPV — IRR — Discounted Pay Back Method — Capital Rationing — Risk Adjusted Techniques Of Capital Budgeting. — Capital Budgeting Practices.
  • 2.
    What is anInvestment? ▶ In an economic sense, an investment is the purchase of goods that are not consumed today but are used in the future to create wealth. ▶ In finance, an investment is a monetary asset purchased with the idea that the asset will provide income in the future or will later be sold at a higher price for a profit.
  • 3.
    Investment Analysis Investment analysis,defined as the process of evaluating an investment for profitability and risk, ultimately has the purpose of measuring how the given investment is a good fit for a portfolio.
  • 4.
    What is CapitalBudgeting? ▶ Capital budgeting is the planning process used to determine whether an organization’s long term investments such as new machinery, replacement machinery, new plants, new products, and research development projects are worth the funding of cash through the firm’s capitalization structure.
  • 5.
    Definition- Capital Budgeting “Capitalbudgeting is long term planning for making and financing proposed capital outlays” - Charles T Horngreen.
  • 6.
    Features Of CapitalBudgeting a. Potentially large anticipated benefits b. A relatively high degree of risk c. Relatively long time period between the initial outlay and the anticipated return. (Long term return/ Benefits) d. They are irreversible in nature
  • 7.
    Need for CapitalBudgeting  Large investments  Irreversible nature  Difficulties of investment decision  Long term effect on profitability  To avoid over investment and under investments.
  • 8.
    CAPITAL BUDGETING PROCESS •Identification of Potential Investment Opportunities • Assembling of Investment Proposals • Decision Making • Preparation of Capital Budget and Appropriations • Implementation • Performance Review
  • 9.
    Methods of CapitalBudgeting Traditional Methods Discounted Cash Flow Methods/ Modern Method • Payback Period • Accounting Rate Of Return Method • Net Present Value Method • Profitability Index Method • Internal Rate Of Return
  • 10.
    Pay Back PeriodMethod It refers to the period in which the project will generate the necessary cash to recover the initial investment. ▶ Also called “Pay Out Or Pay Off Period Method” ▶ It does not take the effect of time value of money. ▶ The selection of the project is based on the earning capacity of a project.
  • 11.
    ▶ It emphasizesmore on annual cash inflows, economic life of the project and original investment. ▶It involves simple calculation, selection or rejection of the project can be made easily, results obtained is more reliable, best method for evaluating high risk projects. ▶Under this method projects are ranked on the basis of length of payback period
  • 12.
    Pay back periodcalculation ▶ Two different situations  Equal cash inflow / Even cash inflow  Unequal cash inflow / Uneven cash inflow
  • 13.
    Initial Investment Annual CashInflow Note: Annual cash inflow is the annual earnings (Profit before depreciation and after tax) 1. Equal Cash Inflow / Even Cash Inflow Pay Back Period =
  • 14.
    2. Un EvenCash Inflow Payback Period = B E + C Where, E = No. of years immediately preceding the year of payback B = Balance to be recovered C = Cash flow during the year of recovery
  • 15.
    Example ▶A project costRs.50,000 and yields an annual inflow of Rs.10,000. Calculate its PBP? Initial Investment Annual Cash Inflow PBP= 50,000 10,000 PBP= = 5 Years.
  • 16.
    Example ▶ Un evencash inflows Determine PBP for a project which requires a cash outlay of Rs.12,000 and generates cash inflows of Rs. 2000, Rs.4000, Rs.4000 and Rs.5000 in the first, Second, third, fourth years respectively.
  • 17.
    Solution – Step1 Year Annual Cash Inflow Cumulated Cash Inflows 1 2000 2000 2 4000 6000 3 4000 10,000 4 5000 15,000
  • 18.
    Upto 3rd yearthe initial investment of Rs.12,000 is not recovered, only 10,000 is recovered. But in the fourth year its Rs.15,000. ie Rs.3000 more than the cost of project. We have to find Time to recover 12000 3rd Year = 10000 (Required 2000 more) 2000 5000 3 + B C E + Payback Period = = 3.4 Years
  • 19.
    Problem - 1 Capitalcost of three models of machine is Rs. 90,000 each and the estimated life is 4 years. Annual returns of each machine are given below. Decide the model of machine to be chosen on the basis of Pay back period. Year Model A Model B Model C 1 20,000 30,000 35,000 2 30,000 40,000 35,000 3 50,000 50,000 35,000 4 50,000 20,000 35,000
  • 20.
    Problem - 2 Initialoutlay for each of the following projects is Rs. 15,000 & standard payback is 3 years. Evaluate the projects and rank them based on payback period Year ProjectA Project B Project C Project D 1 5,000 3,500 2,500 8,000 2 5,000 4,000 2,500 6,000 3 5,000 4,500 2,500 6,000 4 5,000 6,000 2,500 5,000 5 5,000 6,000 2,500 5,000
  • 21.
    Advantages of PBPMethod ▶ Easy to understand and simple to calculate. ▶ Finding out the projects which generate the substantial cash inflows in earlier years. ▶ It is helpful in weeding out the risky projects. ▶ This method finding out the project that makes early realization of funds, this helps to enhance the liquidity. ▶ This method helps to reduce cost of calculation.
  • 22.
    Disadvantages of PBPMethod ▶ Ignores all cash inflows after the Payback period. ▶ Does not considering the total benefit from the project. ▶ It ignores the time value of money. (Cash inflows occurring different time period treat as equal.) ▶ It only find the recovery of investment, not the profitability. ▶ It ignores the scrap or salvage value of project after life
  • 23.
    2. Average Rateof Return Method (ARR) ▶ Also called Rate of return method or Accounting rate of return method. ▶ Introduced to overcome the disadvantage of pay back period. ▶ It considers the all year earnings of the project. ▶ It is based on conventional accounting concepts. ▶ The rate of return is expressed as percentage of the earnings of the investment in a particular project. ▶ The profits under this method is calculated as profit after depreciation and tax of the entire life of the project.
  • 24.
    Calculations Average income aftertax and depreciation Average investment ARR = x 100 Average Income = Total Return Expected Life or Life time Average Investment = Original investment 2
  • 25.
    + Additional W/C Ifscrap value or additional working capital is given Average Investment = Original investment + SV 2
  • 26.
    ▶ Calculate ARR ProjectA Project B Investment 4,000 5,000 Expected Life 4 Years 4 Years Income shown after Depreciation and Tax Year ProjectA Project B 1 2000 3000 2 1500 3000 3 1500 2000 4 1000 1000 Total Income 6,000 9,000
  • 27.
    Average income aftertax and depreciation Average investment ARR = x 100 Project A Avg. Income = Total Return Expected Life 6000 4 = 1500 Avg. Investment = Original investment 2 4000 2 = 2000 2000 ARR = 1500 x 100 = 75%
  • 28.
    Average income aftertax and depreciation Average investment ARR = x 100 Project B Avg. Income = Total Return Expected Life 9,000 4 = 2,250 Avg. Investment = Original investment 2 5,000 2 = 2500 ARR = 2,250 x 100 = 90% 2,500
  • 29.
    ▶ Calculate ARR ProjectAProject B Investment 50,000 50,000 Expected Life 5 Years 5 Years Scrap Value 7000 3000 Year Project A Project B 1 6,000 7,000 2 9,000 8,000 3 10,000 10,000 4 12,000 12,000 5 14,000 16,000 Total Income 51,000 53,000
  • 30.
    Advantages Of ARRMethod ▶ Simple to calculate ▶ Easy to understand ▶ based on accounting information readily available ▶ It gives importance to profitability ▶ ARR is based on accounting profit ▶ It consider all cash inflows of the project. ▶ It can be used for rank and compare two projects.
  • 31.
    Disadvantages of ARRMethod ▶ Ignores the time value of money ▶ Cash inflows of all years are given equal important. ▶ It uses accounting information rather than cash inflow. ▶ This method is not suitable for comparing projects with different duration or life
  • 32.
    MODERN METHODS /DISCOUNTED CASH FLOW METHOD 1. Net present value method 2. Profitability index method 3. Internal rate of return 4. Modified Internal rate of return 5. Discounted Payback period method
  • 33.
    Net present valuemethod ▶ It recognizes the impact of time value of money. It is considered as the best method of evaluating the capital investment proposal. ▶ It is widely used in practice. ▶ The cash inflow to be received at different period of time will be discounted at a particular discount rate. ▶ The present values of the cash inflow are compared with the original investment. ▶ The difference between the two will be used for accept or reject criteria.
  • 34.
  • 35.
    NPV= Discounted cashinflow - Discounted cash outflow Note1 : If only in the beginning initial investment is made, then the discounted cash outflow will be the same i.e., initial investment Note2 : Cash inflow means profit before depreciation and after tax
  • 36.
    Acceptance Role If NPVis ▶ Positive value ▶ Zero ▶ Negative Value
  • 37.
    1. Determine theappropriate Discount Rate 2. Compute the present value of Total Investment (Discounted cash outflow) 3. Compute the present value of cash inflows (Profit Before Depreciation and After Tax) x (Discount Rate) 4. Minus the Value of Investment from Value of Inflow (Discounted cash inflow- Discounted cash outflow) 5. If the NPV –ve Reject it, If NPV is +ve Accept it 6. Rank the projects and maximum positive NPV Should be chosen
  • 38.
    Equation • C1,C2…Cn representsnet cash inflow for year 1,2….n • K is the opportunity cost of capital • C0 is the initial investment n is the expected life of investment
  • 39.
    Example.. Calculate NPV ofthe two projects and suggest. Assuming Discount rate is 10% Machine A Machine B Investment 40,000 50,000 Yearly Returns 1 12,000 25,000 2 18,000 18,000 3 7,000 12,000 4 5,000 4,000 5 4,000 4,000
  • 40.
    Machine - A 12000 (1+0.1) 18000 (1+0.1)2 + 7000 (1+0.1) 3 + 5000 (1+0.1) 4 + 4000 (1+0.1)5 + - 40,000 NPV = NPV = 10,909 + 14,876 + 5,259 + 3415 + 2484 - 40,000 NPV = 36,943 - 40,000 = - 3,057
  • 41.
    Machine - B 25000 (1+0.1) 18000 (1+0.1)2 + 12000 (1+0.1) 3 + 4000 (1+0.1) 4 + 4000 (1+0.1)5 + - 50,000 NPV = NPV = 22,727 + 14,876 + 9016 + 2732 + 2484 - 50,000 NPV = 51835 - 50,000 = 1835
  • 42.
    NPV Machine A =- 3057 Machine B = 1835 Machine B is the best investment opportunity
  • 43.
    A company isconsidering the purchase of new machine. Two alternative models are available. Each year cash flow is given. If the total investment of Model A is Rs. 70,000 and Model B Rs: 60,000, Which alternative company will select on the basis of NPV of two models? Year Model A Model B 1 8000 24000 2 24000 32000 3 32000 40000 4 48000 24000 5 32000 16000
  • 45.
    Example: Year 1 Year2 Year 3 Sales 10,000 units 20,000 units 40,000 units Sale price per unit= 10 rs. Raw Material = 6 rs. Fixed expenses excluding depreciation = Rs 20,000 Depreciation = Rs 15,000 Tax rate= 30% Initial Investment= Rs 1,30,000 Compute NPV at 10% discount rate
  • 46.
    . Q: ABC ltd.Is evaluating the purchase of a new project with a depreciable base of Rs 1,00,000, expected life of 4 years and change in earnings before taxes and depreciation of Rs 45,000 , Rs 30,000 and Rs 25000 , Rs 45,000 in 1st , 2nd , 3rd , 4th year respectively. Assume SLM and 20% tax rate. You are required to compute required cash flows.
  • 48.
    Advantages of NPVMethod ▶ It consider the time value of money ▶ Converting future cash inflows to discounted present value. ▶ Consider entire life cash inflows ▶ Objective of maximizing owner’s wealth ▶ Can be estimated and compared to take a decision. ▶ It is based on profitability and liquidity.
  • 49.
    Disadvantages of NPVMethod ▶ Computation is difficult ▶ It is not easy to appropriate and determine discount rate. ▶ Difficulty to estimate cash inflows due to uncertainty
  • 50.
    • The profitabilityindex is an index that attempts to identify the relationship between the costs and benefits of a proposed project through the use of a ratio. • Profitability index (PI), also known as profit investment ratio (PIR) and value investment ratio (VIR), is the ratio of payoff to investment of a proposed project.
  • 51.
    Present value ofcash inflow Present value of cash outflow PI is equal to or more than one, the proposal can be accepted PI = ▶PI = 1 ▶PI = > 1 ▶PI = <1 Accept Accept Reject
  • 52.
    Calculate PI ofeach project and suggest the best one. Estimated discount rate is 12% Project Co C1 C2 C3 A - 4,000 0 4,000 2,000 B - 4,000 2,000 2,000 0 C - 5,000 3,000 2,000 2,000 D - 5,000 2,000 3,000 2,000
  • 53.
    Advantages Of ProfitabilityIndex (PI) 1. PI considers the time value of money. 2. PI considers analysis all cash flows of entire life. 3. PI makes the right in the case of different amount of cash outlay of different project. 4. PI ascertains the exact rate of return of the project
  • 54.
    Disadvantages Of ProfitabilityIndex(PI) 1. It is difficult to understand interest rate or discount rate. 2. It is difficult to calculate if two projects having different period of life.
  • 55.
    Internal rate ofreturn (IRR) is a metric used in capital budgeting measuring the profitability of potential investments. Internal rate of return is a discount rate that makes the net present value (NPV) of all cash flows from a particular project equal to zero. 3. Internal Rate Of Return (IRR)
  • 56.
    Discounted Cash inflow Discounted Cash outflow0 Discount Rate ? IRR is that rate at which the sum of discounted cash inflow equals the sum of discounted cash outflows
  • 57.
    L = P1 = P2= Q = D = Lower discount rate Present Value at lower (%) rate Present Value at higher (%) rate Actual investment Difference in rate (%) P1 – Q IRR = L+ x D P1 - P2
  • 58.
    Calculate IRR ofeach and suggest the best one Investment 10000 10000 10000 Year Model A Model B Model C 1 2000 3000 2000 2 3000 3000 4000 3 3000 3000 4000 4 4000 2000 5000
  • 59.
    Advantages of IRR ▶Use of time value of money. ▶ All cash flows are equally important ▶ Uniform ranking ▶ Maximum profitability of shareholder ▶ Not need to calculate cost of capital
  • 60.
    Disadvantages of IRR ▶T o understand IRR is difficult ▶ Not Helpful for comparing two different investment ▶ Unrealistic Assumption
  • 61.
    Discounted Payback Period ▶Payback period by considering time value of money. ▶ A project’s discounted payback period is the number of years it takes for the net cash flows’ present values to pay back the net investment. ▶ Shorter paybacks are better than longer paybacks.
  • 62.
    Year Cash Flow 170,000 2 70,000 3 70,000 4 70,000 5 70,000 Example. Investment 2,00,000 Opportunity cost : 10%
  • 63.
    MIRR • MIRR= (Futurevalue/initial investment) 1/n -1 • Whereas FV=Present value(1+i)n
  • 64.
    MODIFIED IRR 0 12 3 4 5 6 -120 -80 20 60 80 100 120 r=15% 115 -69.6 r =15% r =15% 105.76 PVC = 189.6 r =15% 91.26 r =15% 34.98 Terminal value (TV) = 467 PV = 189.6 MIRR = 16.2% of TV NPV 0  Centre for Financial Management , Bangalore
  • 65.
    More to CapitalBudgeting
  • 66.
  • 67.
    Capital Rationing ▶ Relatedto Capital Budgeting ▶ Related to Investment ▶ When ▶ More investment options are available ▶ But limited resources are available (Shortage of Finance) ▶ Need to choose the best options ▶ Helps to prioritise the options based on profitability ▶ Helping to select the appropriate projects
  • 68.
    Capital Rationing • Capitalrationing situation refers to the choice of investment proposal under financial constraints. • Capital rationing is applied when a firm has a number of acceptable investment proposal but the resource available is restricted to certain extend
  • 69.
    Capital Rationing providinganswers to ▶The required fund? ▶Available Fund? ▶How to assign the available fund?
  • 70.
    Steps in CapitalRationing 1. Ranking projects (By use of any profitability measures) (NPV,IRR,PI) 2. Selecting projects in descanting order of profitability until the budget exhausted
  • 71.
    Factors Leading toCapital Rationing 🠊 Internal Factors 🠊Restriction by management 🠊T op mgt. Philosophy towards capital spending 🠊Fear about current commitments 🠊Fund from current operations 🠊Feasibility of acquiring new fund 🠊 External Factors 🠊External Factors 🠊Imperfection of capital market 🠊Govt. Regulations
  • 72.
    Types of capitalrationing imposed by the 1. Soft capital rationing ▶ It is when restriction is Management (Internal Factors) 2. Hard capital Rationing ▶It is when capital infusion is limited by external sources (External Factors)
  • 73.
    Advantages of capitalrationing 1. Budget 2. No wastage 3. Fewer projects 4. Higher returns 5. More stability
  • 74.
    1. Budget • ▶Itintroducesa sense of strict budgeting of corporate resources 2. No wastage • ▶It prevents wastage of resources by not investing in each and every new project available for investment 3. Fewer projects • ▶ It ensures that less number of projects are selected by imposing capital restrictions
  • 75.
    4. Higher returns ▶Invest only in projects where the expected return is high, thus eliminating projects with lower returns in capital 5. More stability ▶ Since the company is selecting those projects where the expected return is high, thus ensures stability for tough times as well
  • 76.
    ▶ The requiredinitial investment and Present value of inflows in respect of 5 projects (A,B,C,D, and E) is given above. The total funds available is Rs 13,00,000. ▶ Determine the optimal combination of projects under profitability index Project Required initial investment Present value of inflows A 2,00,000 2,20,000 B 6,00,000 7,00,000 C 1,00,000 92,000 D 4,00,000 4,90,000 E 2,00,000 2,10,000
  • 77.
    Project Required initial investment Present value of inflows Profitability Index Ranking Apportioning available capital D 4,00,0004,90,000 1.225 1 4,00,000 B 6,00,000 7,00,000 1.16667 2 6,00,000 A 2,00,000 2,20,000 1.1 3 2,00,000 E 2,00,000 2,10,000 1.05 4 1/2th of Project E C 1,00,000 92,000 0.92 5
  • 78.
    Tate Company, afast growing plastics company with a cost of capital of 10%, is confronted with six projects competing for its fixed budget of $250,000. The initial investment and IRR for each project are shown below: Capital Rationing