SlideShare a Scribd company logo
1 of 11
1 | P a g e
P. SAIPRATHYUSHA
PONDICHERRY UNIVERSITY
DEPARTMENT OF COMMERCE
DU- PONT ANALYSIS
II SEMESTER
PREPARED BY: P. SAI PRATHYUSHA
1ST
M.COM BUSINESS FINANCE
2 | P a g e
P. SAIPRATHYUSHA
A STUDY OF FINANCIAL PERFORMANCE USING DU-PONT ANALYSIS IN
THE FMCG SECTOR.
*** P. SAI. PRATHYUSHA, 1ST M.COM BUSINESS FINANCE, DEPARTMENT OF COMMERCE,
SCHOOL OF MANAGEMENT, PONDICHERRY UNIVERSITY.
ABSTRACT
In this study we can see how the Du-Pont Analysis is used to evaluate the financial
performance of a company. To use the Du-Pont Analysis there is a three-step model
followed where the net profit margin, the assets turnover ratio and the financial leverage
is used. To apply the Du-Pont analysis I have selected two companies from the FMCG sector
and I have calculated the ROI using the Du- Pont Analysis.
INTRODUCTION
Performance evaluation of a company is usually related to how well a company can use its
assets and how well a company can generate profit by utilizing its assets. Performance
evaluations are one of the most important communication tools an organisation can use.
Performance evaluation benefits both the employee as well as the employer. It helps the
organisation in providing timely feedback, it recognises the quality performance of the
company and sets expectations for future.
Du Pont analysis is said to be an expression which breaks the Return on Investment (ROI)
into three parts. Du Pont analysis is one of the important tools for performance evaluation of
any company. For determining the financial position of a company and to know how well the
company performs its activities as well as the profitability and asset utilizing capacity of the
company, Du Pont analysis plays an important role.
Du Pont analysis easily measures return of equity related to the company for performance
evaluation. It analyses the company’s profitability and asset utilization. It measures overall
performance and efficiency of a company. This method is used to analyse companies past
financial performance and it also predicts the future trend of financial position.
The historical backgrounds of the two selected companies are as follows:
BACKGROUND
 Nestle India Ltd:
Nestle India Ltd is one of the biggest players in the FMCG sector. The company is
mainly engaged in the food business. Nestle India Ltd was established in India in the
year 1956. The company has various segments and products such as milk products,
nutrition, beverages, chocolates, confectionary. The company manufactures products
of truly international quality under the internationally famous names such as
NESCAFE, MAGGI, KIT-KAT, BAR-ONE, MILKMAID and NESTEA. Nestle India is a
responsible organisation and facilitates initiatives that help in order to improve the
quality of lives in the communities where it operates. The culture of innovation and
renovation within the company gives it a distinct advantage.
3 | P a g e
P. SAIPRATHYUSHA
 Britannia Industries Ltd:
It is an Indian food products corporation founded in the year 1892 and is one of India’s
100 most trusted brands. The company’s principal’s activity it to manufacture and sale
of biscuits,bread, rusk, cakes and dairy products.The company’s manufactures India’s
mostfavourite brands suchas Good day, Tiger, Nutri choice, Milk Bikis and Marie gold.
The company enjoys a large market share and is growing profitably. The company’s
revenue as of 2019 is Rs 10,672 crore (US $ 1.5 billion) with a market share of 38%.
The company’s sales grew at a compound annual rate of 16% and the operating profits
reached 18%.
STATEMENT OF PROBLEM
The Return on equity (ROE) lacks the quality of financial analysis which is better explained
through Du-Pont analysis. Du- Pont analysis gains an advantage over the ROE due to the risk
analysis which can be done with the help of Return on Investment.
PURPOSE OF STUDY
The purpose of this study is to evaluate the performance of two FMCG companies in India by
measuring ROCE using the Du Pont analysis. The study analyses the financial conditions of
the selected two FMCG companies in India.
REVIEW OF LITERATURE
Liesz (1999), in his study states that determining the reason for failure of small firms
is troublesome and to analyse the reason for failure, Du Pont analysis can be used and he
also stated that the Du Pont analysis can be used to evaluate the performance of the company.
He stated that in case the company wants to know its performance level, it is required that the
company calculates the asset turnover, profit margin and the financial leverage. In his study
he has mentioned that these ratios help the company to know the reasons for its failure.
Muhammad (2006), in his study has mentioned that the ROA has an impact on the
profitability, efficiency and the operating decisions of a firm. This helps in planning and control
which in-turn increases the ROA. He has also mentioned that the Du Pont model shift from
the ROA to ROE has been modified to make it as a powerful tool for the strategic decision
making within the organisation to increase the ROE.
Maria Zain (2008), In his study he mentions that the return on asset is an important
factor and is also an indicator to dictate how well the assets are used to generate revenue. He
mentions that the higher return on asset indicated that the company’s asset utilization is not
good enough to generate the revenue.
Maranville (2008), in his study he mentions that there is Du-Pont model that has
combination of five ratios in order to determine the ROE. He also mentions that scrutiny of the
annual statements of a company alone are not sufficient and the company requires to also
look at the operating decision (profitability and efficiency) and financing decisions (leverage).
He says that according to the recent evidence it has been shown that the modified Du-Pont
analysis can be used to find the causes for financial problems.
4 | P a g e
P. SAIPRATHYUSHA
Rogova (2014), in his study has said that the Du Pont analysis helped in effectively
revealing the factors of efficiency. In his study he found that a strong advantage of ROE was
the possibility of its disaggregation into different profitability ratios, with ROE giving the
indication of the profitability and efficiency from the shareholder’s point of view.
OBJECTIVES OF STUDY
 To understand the Du-Pont Analysis and the model used.
 To know the financial performance of Nestle India Ltd and Britannia Ltd
 To compare the financial performance of the selected companies using Du-Pont
analysis and see which company performs better among the two companies.
 To study how Du-Pont analysis helps in evaluating the financial performance of the
selected companies.
DU- PONT DEFINITION
Du- Pont analysis is a tool used for evaluating the financial performance of a company by
calculating the Return on Investment (ROI) by breaking the components into three. The three
components used in the calculation are profit margin, Asset turnover, and the leverage factor.
When the components of ROI are broken, it helps the investors to examine how effectively a
company performs in each area. To find the ROI through Du- Pont analysis, one must find the
net profit margin, Assets turnover ratio and the financial leverage. When we multiply all the
three, we get the required ROI.
Du-PONT IS USEFUL FOR WHOM
There are four beneficiaries from the Du-Pont analysis.
 It is useful for the company and it helps the business to understand how the segment
is contributing to the overall ROE of the company. In fact, this can be used as a reliable
indicator of the performance measurement of divisional managers.
 For the top management, this can be useful in making decisions such as the capital
allocation. The capital has to be allocated to the business which contributes most of
the ROE of the company with minimal risk. Increasing the ROE by increasing the
leverage is not a good idea.
 Du- Pont helps the analyst in tracking the stock to pin point the actual triggers that are
driving the performance of the company and whether these factors are useful or not.
This is what ultimately matters when it comes to valuation of the company.
 Lastly and finally, the fund managers will take a decision on comparative investments
based on the ROE analysis. Over a longer period of time it is the ROE that drives
valuations and also the P/E ratio re- rating. That only happens when the ROE boost is
sustainable. That is exactly what the Du-Pont analysis captures.
5 | P a g e
P. SAIPRATHYUSHA
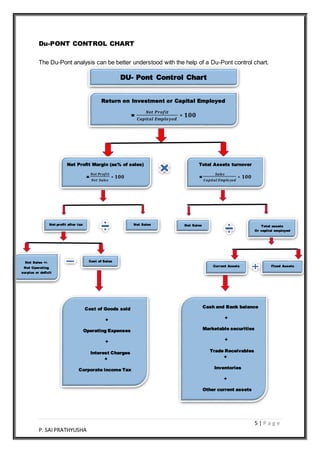
Du-PONT CONTROL CHART
The Du-Pont analysis can be better understood with the help of a Du-Pont control chart.
DU- Pont Control Chart
Return on Investment or Capital Employed
=
𝑵𝒆𝒕 𝑷𝒓𝒐𝒇𝒊𝒕
𝑪𝒂𝒑𝒊𝒕𝒂𝒍 𝑬𝒎𝒑𝒍𝒐𝒚𝒆𝒅
∗ 𝟏𝟎𝟎
Net Profit Margin (as% of sales)
=
𝑵𝒆𝒕 𝑷𝒓𝒐𝒇𝒊𝒕
𝑵𝒆𝒕 𝑺𝒂𝒍𝒆𝒔
∗ 𝟏𝟎𝟎
Total Assets turnover
=
𝑺𝒂𝒍𝒆𝒔
𝑪𝒂𝒑𝒊𝒕𝒂𝒍 𝑬𝒎𝒑𝒍𝒐𝒚𝒆𝒅
∗ 𝟏𝟎𝟎
Net profit after tax Net Sales Net Sales Total assets
Or capital employed
Net Sales +/-
Net Operating
surplus or deficit
Cost of Sales
`
Cost of Goods sold
+
Operating Expenses
+
Interest Charges
+
Corporate income Tax
Current Assets Fixed Assets
Cash and Bank balance
+
Marketable securities
+
Trade Receivables
+
Inventories
+
Other current assets
6 | P a g e
P. SAIPRATHYUSHA
METHODOLOGY USED
Methodology represents how the data is collected, analysed and used for the study. It is a
systematic and theoretical analysis of the methods applied to a field of study. It describes
about the DU- Pont decomposition and the formula used for measuring the financial
performance quantitative approach has been used in this study to obtain the results.
ROI has been calculated using the three step DU- Pont model and is explained below.
 THREE STEP DU- PONT MODEL
ROI using Du-Pont analysis is calculated as follows:
This three-step Du- Pont analysis, gives the organisation information about the performance
of the company, the profitability of the company, the asset management of the company and
the leverage creation of the company.
The higher the ROI, the higher is the growth of the company.
 NET PROFIT MARGIN (Step 1):
The Net Profit margin is the proportion of earnings of a company from its sales. This
will be different for different industries because the competitors play a role in the
earnings of a company and it has an impact on the earnings margin. This is the reason
why we should compare the profit margins only with its peer companies. The profit
margin gives a good sign of pricing strategy and growth of the company. The better
the profit margin, the better is the company. For increasing the profit margin, the
company should either increase its production or minimise the costs.
The formula used to calculate the Net Profit Margin is as follows:
 ASSET TURNOVER (step 2):
The asset turnover ratio measures how the company earns from its assets. Generally,
a low margin company have high asset turnover because they rely more in increase in
sales rather than the additional cost incurred in the asset. On the other hand, high
margin company have low asset turnover because they invest more in the assets
rather than the increase in the sales.
The formula used to calculate the Asset turnover is as follows:
 MULTIPLY (Step3):
Whenwe multiplythe Net ProfitMarginand the assets turnover, we get the required ROI.
ROI= Net Profit Margin * Asset Turnover
NET PROFIT MARGIN= NET PROFIT/SALES
ASSET TURNOVER = SALES/ TOTAL ASSETS
7 | P a g e
P. SAIPRATHYUSHA
 TOOLS USED
Calculations have been done using MS Excel and the tabular representation is done to present
the data.
To do the data analysis, secondary data has been collected. The data has been
collected from Bloomberg source. The two selected company’s (Nestle India Ltd and
Britannia Ltd) balance sheet and Income Statement as per GAAPhave been taken to do
the calculations. The data of 2 years (i.e., 2017-2019) have been collected to do the
study.
DATA ANALYSIS AND INTERPRETATION
Return on Equity (ROE):
ROE is one of the basic tests that is used by the company in knowing how effectively a
company’s management usesthe money of the investors. It will help the investors to know
whetherthe managementisgrowingthe company’svalue atan acceptable rate by usingthe
moneyof the investors.Thisratioalsomeasuresthe rate of return that the firmearnson the
shareholder’s equity. The shareholders equity is the denominator in the formula used. This
ratio influences the amount of firm’s debt in using the finance assets.
The formula used to calculate the Return on equity (ROE) is as follows
Usingthe above formula,the ROE hasbeen calculatedforthe two selected companies(i.e.,
Nestle India Ltd and Britannia Ltd) and the calculations are below
ROE calculations using the Du- Pont analysis is below:
ROE =
𝑵𝒆𝒕 𝑰𝒏𝒄𝒐𝒎𝒆
𝑺𝒂𝒍𝒆𝒔
*
𝑺𝒂𝒍𝒆𝒔
𝑨𝒔𝒔𝒆𝒕𝒔
*
𝑨𝒔𝒔𝒆𝒕𝒔
𝑬𝒒𝒖𝒊𝒕𝒚
=
𝑵𝒆𝒕 𝑰𝒏𝒄𝒐𝒎𝒆
𝑬𝒒𝒖𝒊𝒕𝒚
8 | P a g e
P. SAIPRATHYUSHA
ROE INTERPRETATION FOR NESTLE INDIA LTD:
 As per the calculation done above, we can clearly see that Nestle India Ltd has a ROE
of 16.64% in the FY 2017-2018 and 19.87% in the FY 2018-2019. It is clear that the
ROE of the company has increased over the year by 3.23%.
 The increase in the ROE of Nestle India Ltd shows that the investor’s money is put to
proper use by the management. A rising ROEsuggests that the company is increasing
its profit generation without needing much capital. An increase in the ROE also implies
that the company has increased its debt as we can see in the above table, the long-
term debt of the company has been increased from Rs 39,420 to Rs 44,143. So, this
means that the increase in the ROE by 3.23% is due to the increase in the long-term
debt by Rs 4,723.
ROE INTERPRETATION FOR BRITANNIA LTD:
 As per the calculation done and shown above, we can see that ROE of Britannia Ltd
is 19.36% for the FY 2017-2018 and 18.57% for the FY 2018-2019. We can see that
there is a decrease in the ROE by 0.79%.
 The decrease in the ROE of Britannia Ltd shows that the investors money is not put to
proper use by the management. The decrease in the ROE indicates that the company
is being mismanaged and that the company could be using the amount in reinvesting
the earnings into unproductive assets.
 The decrease in ROE is only 0.79% which shows that there is consistency in using the
investor’s amount.
Return on Investment (ROI):
ROI is a performance measure that is used to evaluate the efficiency of an investment or
to compare the efficiency of a number of different investments. ROI tries to directly
measure the amount of return on a particular investment., relative to the investment’s cost.
The purpose of ROI is to measure, per period, rate of return on money invested in an
economic entity in order to decide whether to undertake an investment or not. It is also
used as an indicator to compare the different investment portfolio. The investment with
largest ROI is usually preferred.
The formula used to calculate the Return on Investment (ROI) is as follows
Using the above formula, the ROI has been calculated for the two selected companies (i.e.,
Nestle India Ltd and Britannia Ltd) and the calculations are below
ROI = Profit Margin * Assets Turnover
Or
𝑵𝒆𝒕 𝑰𝒏𝒄𝒐𝒎𝒆
𝒔𝒂𝒍𝒆𝒔
*
𝑺𝒂𝒍𝒆𝒔
𝑪𝒂𝒑𝒊𝒕𝒂𝒍 𝑬𝒎𝒑𝒍𝒐𝒚𝒆𝒅
=
𝑵𝒆𝒕 𝑰𝒏𝒄𝒐𝒎𝒆
𝑪𝒂𝒑𝒊𝒕𝒂𝒍 𝑬𝒎𝒑𝒍𝒐𝒚𝒆𝒅
9 | P a g e
P. SAIPRATHYUSHA
ROI calculations using the Du- Pont analysis is below:
ROI INTERPRETATION FOR NESTLE INDIA LTD:
 As per the calculations shown above, we can see that the ROI of Nestle India Ltd
is 35.82% in the FY 2017-2018 and 43.74% in the FY 2018-2019. We can clearly
see that there is an increase in the ROI of the company from FY 2017-18 to FY
2018-19 by 7.92%.
 The increasein the ROIindicates that the company has utilized its assets in a good
way.
 As the company’s ROI is increasing over the year it is expected to increase in the
coming years and hence it is good to make an investment in this company.
ROI INTERPRETATION FOR BRITANNIA LTD:
 As per the calculations shown above, we can see that the ROI of Britannia Ltd is
29.37% in the FY 2017-2018 and 27.04% in the FY 2018-2019. Wecan clearly see
that there is a decrease in the ROI of the company over the year by 2.33%.
 The decrease in the ROI of the company over the year has indicated that the
company has not utilised its assets in a good way.
 As the ROI has decreased over the year, the investors should take caution before
investing in the company.
10 | P a g e
P. SAIPRATHYUSHA
DU-PONT ANALYSIS OF THE SELECTED TWO COMPANIES USING
CONTROL CHART
LIMITATIONS OF THE STUDY
There are some limitations of the Study. Du Pont analysis is used for performance evaluation
of the companies. When conducting the research some problems have been faced. For
evaluating performance have to choose a method that is appropriate. However, data should
be correct, otherwise calculation may be baffling. Sometimes the items to analyse could not
find appropriately as a result there may have some lacking in comparing among those
companies.
11 | P a g e
P. SAIPRATHYUSHA
There are some drawbacks of Du Pont decomposition also. Such as-
 The DuPont identity is an accounting identity and this model relies on accounting data,
which can be altered by companies to hide short-term weaknesses (even though this
is unethical).
 DuPont decomposition does not include the cost of capital.
 How much increase of debt will determine the negative or positive return to
shareholders is not recognized by this disaggregation.
FINDINGS AND CONCLUSIONS
 In the year 2017-2018, when we see the ROIand ROEof Nestle India Ltd and Britannia
Ltd, we can say that Nestle India Ltd has comparatively shown higher ratios when
compared to Britannia Ltd.
 In the year 2018-2019, when we see the ROIand ROEof Nestle India Ltd and Britannia
Ltd, we can say that again Nestle India Ltd has comparatively shown higher ratios
when compared to Britannia Ltd.
 Overall, Nestle India ltd has a higher ROIand ROE when comparedwith ROIand ROE
of Britannia Ltd.
 This implies that Nestle India Ltd will be able to generate more returns to the
shareholders on their funds and more return on their assets when compared to
Britannia Ltd.
 This indicates that the Nestle India Ltd company’s management is more efficient in
using the shareholder’s funds.
 The low ratios of Britannia Ltd could be due to the increase in long term debts which
is not good for a company.
 This analysis makes it easy for the investors to make their investment decision. It is
preferred that the investors invest in Britannia company because of its high returns that
it gives.
ROI and ROE are tools used by companies and organisations to know the ability of their
performance. ROI helps the company and the shareholders in knowing how well it is using the
assets to generate the returns or revenue. ROE helps the company and the shareholders in
knowing how efficiently it is using the shareholder’s funds and how much returns they can give
back to their shareholders.
Higher ratios in ROI and ROE indicates better performance of the company and the
growth of the firm.
In this study, Nestle India Ltd has higher ratios in ROI and ROE when compared to
Britannia Ltd and the company also shows more consistency. Britannia Ltd also can
improve its performance by using the shareholders amount in a proper way.
REFERENCES
 https://www.investopedia.com/terms/d/dupontanalysis.asp
 Soliman M (2008). The use of Du-Pont analysis by market participants. The accounting review, 83(3), 823-
853
 Zain, Maria (2008). How to use the profitability ratios. Journal of profitability ratio analysis
 Bleby, M. (2010). Pioneer to pay R 500 million fine í cancels dividend. Available at:
http://www.bdlive.co.za/ articles/2010/11/02/pioneer-to-pay-r500-million-fine---cancels-dividend
 Accounting Coach. (2015).what is the statement of financial position? Available at:
http://www.accounting coach.com/blog/what-is-the-statement-of-financial-position

More Related Content

What's hot

India's Foreign trade policy
India's Foreign trade policyIndia's Foreign trade policy
India's Foreign trade policyHarshit Ahuja
 
institutional support in Entrepreneurship
institutional support in Entrepreneurshipinstitutional support in Entrepreneurship
institutional support in EntrepreneurshipSahil Kamdar
 
Du Pont Presentation
Du Pont PresentationDu Pont Presentation
Du Pont PresentationRushit Shah
 
Environmental accounting
Environmental accountingEnvironmental accounting
Environmental accountingAkkiMaruthi
 
A study on performance evaluation of equity shares & mutual funds
A study on performance evaluation of equity shares & mutual fundsA study on performance evaluation of equity shares & mutual funds
A study on performance evaluation of equity shares & mutual fundsProjects Kart
 
India’s foreign trade
India’s foreign tradeIndia’s foreign trade
India’s foreign tradeRajalakshmi K
 
Comparative Analysis On Mutual Fund Scheme
Comparative Analysis On Mutual Fund SchemeComparative Analysis On Mutual Fund Scheme
Comparative Analysis On Mutual Fund Schememayank mulchandani
 
Scope of Business Research
Scope of Business ResearchScope of Business Research
Scope of Business ResearchSundar B N
 
Financial management unit 1
Financial management unit  1Financial management unit  1
Financial management unit 1Ratika Chawla
 
Balance Sheet Analysis
Balance Sheet AnalysisBalance Sheet Analysis
Balance Sheet AnalysisRavi Sekhar
 
A STUDY ON FUNDAMENTAL ANALYSIS OF BANKING SECTOR (WITH SPECIAL REFERENCE TO ...
A STUDY ON FUNDAMENTAL ANALYSIS OF BANKING SECTOR (WITH SPECIAL REFERENCE TO ...A STUDY ON FUNDAMENTAL ANALYSIS OF BANKING SECTOR (WITH SPECIAL REFERENCE TO ...
A STUDY ON FUNDAMENTAL ANALYSIS OF BANKING SECTOR (WITH SPECIAL REFERENCE TO ...IAEME Publication
 
A project report on working capital management
A project report on working capital managementA project report on working capital management
A project report on working capital managementProjects Kart
 
Fundamental analysis of pharma sector
Fundamental analysis of pharma sector Fundamental analysis of pharma sector
Fundamental analysis of pharma sector Rajesh Narayanan
 
Project Report on Financial Analysis by Nirbhay Kumar, MBA - 3rd Sem.,TMBU,B...
Project Report  on Financial Analysis by Nirbhay Kumar, MBA - 3rd Sem.,TMBU,B...Project Report  on Financial Analysis by Nirbhay Kumar, MBA - 3rd Sem.,TMBU,B...
Project Report on Financial Analysis by Nirbhay Kumar, MBA - 3rd Sem.,TMBU,B...Nirbhay Kumar
 
Role and functions of sebi
Role and functions of sebiRole and functions of sebi
Role and functions of sebiAnkur Yadav
 

What's hot (20)

India's Foreign trade policy
India's Foreign trade policyIndia's Foreign trade policy
India's Foreign trade policy
 
Ratio analysis project
Ratio analysis project Ratio analysis project
Ratio analysis project
 
institutional support in Entrepreneurship
institutional support in Entrepreneurshipinstitutional support in Entrepreneurship
institutional support in Entrepreneurship
 
Ratio analysis project presentation
Ratio analysis project presentationRatio analysis project presentation
Ratio analysis project presentation
 
Du Pont Presentation
Du Pont PresentationDu Pont Presentation
Du Pont Presentation
 
Environmental accounting
Environmental accountingEnvironmental accounting
Environmental accounting
 
A study on performance evaluation of equity shares & mutual funds
A study on performance evaluation of equity shares & mutual fundsA study on performance evaluation of equity shares & mutual funds
A study on performance evaluation of equity shares & mutual funds
 
India’s foreign trade
India’s foreign tradeIndia’s foreign trade
India’s foreign trade
 
PROJECT REPORT ON MUTUAL FUNDS
PROJECT REPORT ON MUTUAL FUNDS PROJECT REPORT ON MUTUAL FUNDS
PROJECT REPORT ON MUTUAL FUNDS
 
Comparative Analysis On Mutual Fund Scheme
Comparative Analysis On Mutual Fund SchemeComparative Analysis On Mutual Fund Scheme
Comparative Analysis On Mutual Fund Scheme
 
Scope of Business Research
Scope of Business ResearchScope of Business Research
Scope of Business Research
 
Export Import policy
Export Import policyExport Import policy
Export Import policy
 
Financial management unit 1
Financial management unit  1Financial management unit  1
Financial management unit 1
 
Balance Sheet Analysis
Balance Sheet AnalysisBalance Sheet Analysis
Balance Sheet Analysis
 
EXIM Policy.ppt
EXIM Policy.pptEXIM Policy.ppt
EXIM Policy.ppt
 
A STUDY ON FUNDAMENTAL ANALYSIS OF BANKING SECTOR (WITH SPECIAL REFERENCE TO ...
A STUDY ON FUNDAMENTAL ANALYSIS OF BANKING SECTOR (WITH SPECIAL REFERENCE TO ...A STUDY ON FUNDAMENTAL ANALYSIS OF BANKING SECTOR (WITH SPECIAL REFERENCE TO ...
A STUDY ON FUNDAMENTAL ANALYSIS OF BANKING SECTOR (WITH SPECIAL REFERENCE TO ...
 
A project report on working capital management
A project report on working capital managementA project report on working capital management
A project report on working capital management
 
Fundamental analysis of pharma sector
Fundamental analysis of pharma sector Fundamental analysis of pharma sector
Fundamental analysis of pharma sector
 
Project Report on Financial Analysis by Nirbhay Kumar, MBA - 3rd Sem.,TMBU,B...
Project Report  on Financial Analysis by Nirbhay Kumar, MBA - 3rd Sem.,TMBU,B...Project Report  on Financial Analysis by Nirbhay Kumar, MBA - 3rd Sem.,TMBU,B...
Project Report on Financial Analysis by Nirbhay Kumar, MBA - 3rd Sem.,TMBU,B...
 
Role and functions of sebi
Role and functions of sebiRole and functions of sebi
Role and functions of sebi
 

Similar to Financial analysis using DU- PONT ANALYSIS BY P. SAI PRATHYUSHA

Dupont analysis on Edelweiss financial services ltd.
Dupont analysis on Edelweiss financial services ltd.Dupont analysis on Edelweiss financial services ltd.
Dupont analysis on Edelweiss financial services ltd.Sandeep Patel
 
Ratio Analysis project
Ratio Analysis projectRatio Analysis project
Ratio Analysis projectD V A Subhash
 
ANALYSIS OF FINANCIAL PERFORMANCE OF THOMAS COOK (INDIA) LTD. USING RATIO ANA...
ANALYSIS OF FINANCIAL PERFORMANCE OF THOMAS COOK (INDIA) LTD. USING RATIO ANA...ANALYSIS OF FINANCIAL PERFORMANCE OF THOMAS COOK (INDIA) LTD. USING RATIO ANA...
ANALYSIS OF FINANCIAL PERFORMANCE OF THOMAS COOK (INDIA) LTD. USING RATIO ANA...Anirban Chakraborty
 
An Evaluation of the Financial Performance Analysis at Rane Brake Lining Limi...
An Evaluation of the Financial Performance Analysis at Rane Brake Lining Limi...An Evaluation of the Financial Performance Analysis at Rane Brake Lining Limi...
An Evaluation of the Financial Performance Analysis at Rane Brake Lining Limi...ijtsrd
 
A Study on Ratio Analysis at Accord Puducherry
A Study on Ratio Analysis at Accord PuducherryA Study on Ratio Analysis at Accord Puducherry
A Study on Ratio Analysis at Accord Puducherryijtsrd
 
FINANCIAL PERFORMANCE ANALYSIS OF BHARTI AIRTEL LIMITED
FINANCIAL PERFORMANCE ANALYSIS OF BHARTI AIRTEL LIMITEDFINANCIAL PERFORMANCE ANALYSIS OF BHARTI AIRTEL LIMITED
FINANCIAL PERFORMANCE ANALYSIS OF BHARTI AIRTEL LIMITEDyashmin khatun
 
punjab national bank
punjab national bankpunjab national bank
punjab national bankA S
 
Dividend distribution of ITC Ltd. by ratio analysis.
Dividend distribution of ITC Ltd. by ratio analysis.Dividend distribution of ITC Ltd. by ratio analysis.
Dividend distribution of ITC Ltd. by ratio analysis.DipanRajbanshi
 
Summer Training Report on Financial Performance Analysis for MBA
 Summer Training Report on Financial Performance Analysis for MBA Summer Training Report on Financial Performance Analysis for MBA
Summer Training Report on Financial Performance Analysis for MBAMegha Bansal
 
STRATEGIC MANAGEMENTCH8: IMPLEMENTING STRATEGIES : MARKETING, FINANCE/ACCOUNT...
STRATEGIC MANAGEMENTCH8: IMPLEMENTING STRATEGIES : MARKETING, FINANCE/ACCOUNT...STRATEGIC MANAGEMENTCH8: IMPLEMENTING STRATEGIES : MARKETING, FINANCE/ACCOUNT...
STRATEGIC MANAGEMENTCH8: IMPLEMENTING STRATEGIES : MARKETING, FINANCE/ACCOUNT...astridatmalem
 
Financial performance analysis
Financial performance analysisFinancial performance analysis
Financial performance analysisTalhaKhan255
 
FINANCIAL PERFORMANCE ANALYSIS by Yogini shah
FINANCIAL PERFORMANCE ANALYSIS by Yogini shah FINANCIAL PERFORMANCE ANALYSIS by Yogini shah
FINANCIAL PERFORMANCE ANALYSIS by Yogini shah Aditya Bhatt
 
Financial Performance of Telecom Companies
Financial Performance of Telecom CompaniesFinancial Performance of Telecom Companies
Financial Performance of Telecom CompaniesIRJET Journal
 

Similar to Financial analysis using DU- PONT ANALYSIS BY P. SAI PRATHYUSHA (20)

Dupont analysis on Edelweiss financial services ltd.
Dupont analysis on Edelweiss financial services ltd.Dupont analysis on Edelweiss financial services ltd.
Dupont analysis on Edelweiss financial services ltd.
 
Deconstruction of ROE: An Implementation of DuPont Model on Selected Banglade...
Deconstruction of ROE: An Implementation of DuPont Model on Selected Banglade...Deconstruction of ROE: An Implementation of DuPont Model on Selected Banglade...
Deconstruction of ROE: An Implementation of DuPont Model on Selected Banglade...
 
Ratio Analysis project
Ratio Analysis projectRatio Analysis project
Ratio Analysis project
 
ANALYSIS OF FINANCIAL PERFORMANCE OF THOMAS COOK (INDIA) LTD. USING RATIO ANA...
ANALYSIS OF FINANCIAL PERFORMANCE OF THOMAS COOK (INDIA) LTD. USING RATIO ANA...ANALYSIS OF FINANCIAL PERFORMANCE OF THOMAS COOK (INDIA) LTD. USING RATIO ANA...
ANALYSIS OF FINANCIAL PERFORMANCE OF THOMAS COOK (INDIA) LTD. USING RATIO ANA...
 
An Evaluation of the Financial Performance Analysis at Rane Brake Lining Limi...
An Evaluation of the Financial Performance Analysis at Rane Brake Lining Limi...An Evaluation of the Financial Performance Analysis at Rane Brake Lining Limi...
An Evaluation of the Financial Performance Analysis at Rane Brake Lining Limi...
 
A Study on Ratio Analysis at Accord Puducherry
A Study on Ratio Analysis at Accord PuducherryA Study on Ratio Analysis at Accord Puducherry
A Study on Ratio Analysis at Accord Puducherry
 
G0391055060
G0391055060G0391055060
G0391055060
 
FINANCIAL PERFORMANCE ANALYSIS OF BHARTI AIRTEL LIMITED
FINANCIAL PERFORMANCE ANALYSIS OF BHARTI AIRTEL LIMITEDFINANCIAL PERFORMANCE ANALYSIS OF BHARTI AIRTEL LIMITED
FINANCIAL PERFORMANCE ANALYSIS OF BHARTI AIRTEL LIMITED
 
Du pont analysis
Du pont analysisDu pont analysis
Du pont analysis
 
AKUNTANSI
AKUNTANSIAKUNTANSI
AKUNTANSI
 
Performance Analysis through Financial Modelling
Performance Analysis through Financial ModellingPerformance Analysis through Financial Modelling
Performance Analysis through Financial Modelling
 
punjab national bank
punjab national bankpunjab national bank
punjab national bank
 
Dividend distribution of ITC Ltd. by ratio analysis.
Dividend distribution of ITC Ltd. by ratio analysis.Dividend distribution of ITC Ltd. by ratio analysis.
Dividend distribution of ITC Ltd. by ratio analysis.
 
Financial Analysis
Financial AnalysisFinancial Analysis
Financial Analysis
 
Summer Training Report on Financial Performance Analysis for MBA
 Summer Training Report on Financial Performance Analysis for MBA Summer Training Report on Financial Performance Analysis for MBA
Summer Training Report on Financial Performance Analysis for MBA
 
Ratio Analysis PPT.pptx
Ratio Analysis PPT.pptxRatio Analysis PPT.pptx
Ratio Analysis PPT.pptx
 
STRATEGIC MANAGEMENTCH8: IMPLEMENTING STRATEGIES : MARKETING, FINANCE/ACCOUNT...
STRATEGIC MANAGEMENTCH8: IMPLEMENTING STRATEGIES : MARKETING, FINANCE/ACCOUNT...STRATEGIC MANAGEMENTCH8: IMPLEMENTING STRATEGIES : MARKETING, FINANCE/ACCOUNT...
STRATEGIC MANAGEMENTCH8: IMPLEMENTING STRATEGIES : MARKETING, FINANCE/ACCOUNT...
 
Financial performance analysis
Financial performance analysisFinancial performance analysis
Financial performance analysis
 
FINANCIAL PERFORMANCE ANALYSIS by Yogini shah
FINANCIAL PERFORMANCE ANALYSIS by Yogini shah FINANCIAL PERFORMANCE ANALYSIS by Yogini shah
FINANCIAL PERFORMANCE ANALYSIS by Yogini shah
 
Financial Performance of Telecom Companies
Financial Performance of Telecom CompaniesFinancial Performance of Telecom Companies
Financial Performance of Telecom Companies
 

More from SaiLakshmi115

Interest Rate Parity By P. Sai Prathyusha (Pondicherry University)
Interest Rate Parity By P. Sai Prathyusha (Pondicherry University)Interest Rate Parity By P. Sai Prathyusha (Pondicherry University)
Interest Rate Parity By P. Sai Prathyusha (Pondicherry University)SaiLakshmi115
 
Forward point quotations by P. Sai Prathyusha( Pondicherry University) M.com ...
Forward point quotations by P. Sai Prathyusha( Pondicherry University) M.com ...Forward point quotations by P. Sai Prathyusha( Pondicherry University) M.com ...
Forward point quotations by P. Sai Prathyusha( Pondicherry University) M.com ...SaiLakshmi115
 
Technical Analysis basics P. SAI PRATHYUSHA ( PONDICHERRY UNIVERSITY) 1ST M.C...
Technical Analysis basics P. SAI PRATHYUSHA ( PONDICHERRY UNIVERSITY) 1ST M.C...Technical Analysis basics P. SAI PRATHYUSHA ( PONDICHERRY UNIVERSITY) 1ST M.C...
Technical Analysis basics P. SAI PRATHYUSHA ( PONDICHERRY UNIVERSITY) 1ST M.C...SaiLakshmi115
 
Reading of Charts P. SAI PRATHYUSHA ( PONDICHERRY UNIVERSITY) 1ST M.COM BUSIN...
Reading of Charts P. SAI PRATHYUSHA ( PONDICHERRY UNIVERSITY) 1ST M.COM BUSIN...Reading of Charts P. SAI PRATHYUSHA ( PONDICHERRY UNIVERSITY) 1ST M.COM BUSIN...
Reading of Charts P. SAI PRATHYUSHA ( PONDICHERRY UNIVERSITY) 1ST M.COM BUSIN...SaiLakshmi115
 
Introduction to Investment Management P. SAI PRATHYUSHA ( PONDICHERRY UNIVE...
Introduction to  Investment Management  P. SAI PRATHYUSHA ( PONDICHERRY UNIVE...Introduction to  Investment Management  P. SAI PRATHYUSHA ( PONDICHERRY UNIVE...
Introduction to Investment Management P. SAI PRATHYUSHA ( PONDICHERRY UNIVE...SaiLakshmi115
 
Elliots Wave Theory P. Sai Prathyusha
Elliots Wave Theory  P. Sai PrathyushaElliots Wave Theory  P. Sai Prathyusha
Elliots Wave Theory P. Sai PrathyushaSaiLakshmi115
 
Dow theory by P. Sai Prathyusha (1ST M.COM BUSINESS FINANCE)
Dow theory  by  P. Sai Prathyusha (1ST M.COM BUSINESS FINANCE)Dow theory  by  P. Sai Prathyusha (1ST M.COM BUSINESS FINANCE)
Dow theory by P. Sai Prathyusha (1ST M.COM BUSINESS FINANCE)SaiLakshmi115
 
ROLE OF NBFC IN FINANCIAL INCLUSION
ROLE OF NBFC IN FINANCIAL INCLUSIONROLE OF NBFC IN FINANCIAL INCLUSION
ROLE OF NBFC IN FINANCIAL INCLUSIONSaiLakshmi115
 
Micro finance- P. SAI PRATHYUSHA ([PONDICHERRY UNIVERSITY)
Micro finance- P. SAI PRATHYUSHA ([PONDICHERRY UNIVERSITY)Micro finance- P. SAI PRATHYUSHA ([PONDICHERRY UNIVERSITY)
Micro finance- P. SAI PRATHYUSHA ([PONDICHERRY UNIVERSITY)SaiLakshmi115
 
Issue management intermediaries- P. SAI PRATHYUSHA (PONDICHERRY UNIVERSITY)
Issue management intermediaries- P. SAI PRATHYUSHA (PONDICHERRY UNIVERSITY)Issue management intermediaries- P. SAI PRATHYUSHA (PONDICHERRY UNIVERSITY)
Issue management intermediaries- P. SAI PRATHYUSHA (PONDICHERRY UNIVERSITY)SaiLakshmi115
 
Non banking financial company- P. SAI PRATHYUSHA (PONDICHERRY UNIVERSITY)
Non banking financial company- P. SAI PRATHYUSHA (PONDICHERRY UNIVERSITY)Non banking financial company- P. SAI PRATHYUSHA (PONDICHERRY UNIVERSITY)
Non banking financial company- P. SAI PRATHYUSHA (PONDICHERRY UNIVERSITY)SaiLakshmi115
 
CREDIT RATING - P. SAI PRATHYUSHA (PONDICHERRY UNIVERSITY)
CREDIT RATING - P. SAI PRATHYUSHA (PONDICHERRY UNIVERSITY)CREDIT RATING - P. SAI PRATHYUSHA (PONDICHERRY UNIVERSITY)
CREDIT RATING - P. SAI PRATHYUSHA (PONDICHERRY UNIVERSITY)SaiLakshmi115
 
FACTORING BY P. SAI PRATHYUSHA
FACTORING BY P. SAI PRATHYUSHAFACTORING BY P. SAI PRATHYUSHA
FACTORING BY P. SAI PRATHYUSHASaiLakshmi115
 
COMPANY ANALYSIS-HINDUSTAN UNILEVER LTD
COMPANY ANALYSIS-HINDUSTAN UNILEVER LTDCOMPANY ANALYSIS-HINDUSTAN UNILEVER LTD
COMPANY ANALYSIS-HINDUSTAN UNILEVER LTDSaiLakshmi115
 
CAPITAL BUDGETING - NPV , CAPM MODEL, IRR
CAPITAL BUDGETING - NPV , CAPM MODEL, IRRCAPITAL BUDGETING - NPV , CAPM MODEL, IRR
CAPITAL BUDGETING - NPV , CAPM MODEL, IRRSaiLakshmi115
 
RESERVE BANK OF INDIA AND ITS FUNCTIONS BY P. SAI PRATHYUSHA
RESERVE BANK OF INDIA AND ITS FUNCTIONS BY P. SAI PRATHYUSHARESERVE BANK OF INDIA AND ITS FUNCTIONS BY P. SAI PRATHYUSHA
RESERVE BANK OF INDIA AND ITS FUNCTIONS BY P. SAI PRATHYUSHASaiLakshmi115
 

More from SaiLakshmi115 (16)

Interest Rate Parity By P. Sai Prathyusha (Pondicherry University)
Interest Rate Parity By P. Sai Prathyusha (Pondicherry University)Interest Rate Parity By P. Sai Prathyusha (Pondicherry University)
Interest Rate Parity By P. Sai Prathyusha (Pondicherry University)
 
Forward point quotations by P. Sai Prathyusha( Pondicherry University) M.com ...
Forward point quotations by P. Sai Prathyusha( Pondicherry University) M.com ...Forward point quotations by P. Sai Prathyusha( Pondicherry University) M.com ...
Forward point quotations by P. Sai Prathyusha( Pondicherry University) M.com ...
 
Technical Analysis basics P. SAI PRATHYUSHA ( PONDICHERRY UNIVERSITY) 1ST M.C...
Technical Analysis basics P. SAI PRATHYUSHA ( PONDICHERRY UNIVERSITY) 1ST M.C...Technical Analysis basics P. SAI PRATHYUSHA ( PONDICHERRY UNIVERSITY) 1ST M.C...
Technical Analysis basics P. SAI PRATHYUSHA ( PONDICHERRY UNIVERSITY) 1ST M.C...
 
Reading of Charts P. SAI PRATHYUSHA ( PONDICHERRY UNIVERSITY) 1ST M.COM BUSIN...
Reading of Charts P. SAI PRATHYUSHA ( PONDICHERRY UNIVERSITY) 1ST M.COM BUSIN...Reading of Charts P. SAI PRATHYUSHA ( PONDICHERRY UNIVERSITY) 1ST M.COM BUSIN...
Reading of Charts P. SAI PRATHYUSHA ( PONDICHERRY UNIVERSITY) 1ST M.COM BUSIN...
 
Introduction to Investment Management P. SAI PRATHYUSHA ( PONDICHERRY UNIVE...
Introduction to  Investment Management  P. SAI PRATHYUSHA ( PONDICHERRY UNIVE...Introduction to  Investment Management  P. SAI PRATHYUSHA ( PONDICHERRY UNIVE...
Introduction to Investment Management P. SAI PRATHYUSHA ( PONDICHERRY UNIVE...
 
Elliots Wave Theory P. Sai Prathyusha
Elliots Wave Theory  P. Sai PrathyushaElliots Wave Theory  P. Sai Prathyusha
Elliots Wave Theory P. Sai Prathyusha
 
Dow theory by P. Sai Prathyusha (1ST M.COM BUSINESS FINANCE)
Dow theory  by  P. Sai Prathyusha (1ST M.COM BUSINESS FINANCE)Dow theory  by  P. Sai Prathyusha (1ST M.COM BUSINESS FINANCE)
Dow theory by P. Sai Prathyusha (1ST M.COM BUSINESS FINANCE)
 
ROLE OF NBFC IN FINANCIAL INCLUSION
ROLE OF NBFC IN FINANCIAL INCLUSIONROLE OF NBFC IN FINANCIAL INCLUSION
ROLE OF NBFC IN FINANCIAL INCLUSION
 
Micro finance- P. SAI PRATHYUSHA ([PONDICHERRY UNIVERSITY)
Micro finance- P. SAI PRATHYUSHA ([PONDICHERRY UNIVERSITY)Micro finance- P. SAI PRATHYUSHA ([PONDICHERRY UNIVERSITY)
Micro finance- P. SAI PRATHYUSHA ([PONDICHERRY UNIVERSITY)
 
Issue management intermediaries- P. SAI PRATHYUSHA (PONDICHERRY UNIVERSITY)
Issue management intermediaries- P. SAI PRATHYUSHA (PONDICHERRY UNIVERSITY)Issue management intermediaries- P. SAI PRATHYUSHA (PONDICHERRY UNIVERSITY)
Issue management intermediaries- P. SAI PRATHYUSHA (PONDICHERRY UNIVERSITY)
 
Non banking financial company- P. SAI PRATHYUSHA (PONDICHERRY UNIVERSITY)
Non banking financial company- P. SAI PRATHYUSHA (PONDICHERRY UNIVERSITY)Non banking financial company- P. SAI PRATHYUSHA (PONDICHERRY UNIVERSITY)
Non banking financial company- P. SAI PRATHYUSHA (PONDICHERRY UNIVERSITY)
 
CREDIT RATING - P. SAI PRATHYUSHA (PONDICHERRY UNIVERSITY)
CREDIT RATING - P. SAI PRATHYUSHA (PONDICHERRY UNIVERSITY)CREDIT RATING - P. SAI PRATHYUSHA (PONDICHERRY UNIVERSITY)
CREDIT RATING - P. SAI PRATHYUSHA (PONDICHERRY UNIVERSITY)
 
FACTORING BY P. SAI PRATHYUSHA
FACTORING BY P. SAI PRATHYUSHAFACTORING BY P. SAI PRATHYUSHA
FACTORING BY P. SAI PRATHYUSHA
 
COMPANY ANALYSIS-HINDUSTAN UNILEVER LTD
COMPANY ANALYSIS-HINDUSTAN UNILEVER LTDCOMPANY ANALYSIS-HINDUSTAN UNILEVER LTD
COMPANY ANALYSIS-HINDUSTAN UNILEVER LTD
 
CAPITAL BUDGETING - NPV , CAPM MODEL, IRR
CAPITAL BUDGETING - NPV , CAPM MODEL, IRRCAPITAL BUDGETING - NPV , CAPM MODEL, IRR
CAPITAL BUDGETING - NPV , CAPM MODEL, IRR
 
RESERVE BANK OF INDIA AND ITS FUNCTIONS BY P. SAI PRATHYUSHA
RESERVE BANK OF INDIA AND ITS FUNCTIONS BY P. SAI PRATHYUSHARESERVE BANK OF INDIA AND ITS FUNCTIONS BY P. SAI PRATHYUSHA
RESERVE BANK OF INDIA AND ITS FUNCTIONS BY P. SAI PRATHYUSHA
 

Recently uploaded

A Critique of the Proposed National Education Policy Reform
A Critique of the Proposed National Education Policy ReformA Critique of the Proposed National Education Policy Reform
A Critique of the Proposed National Education Policy ReformChameera Dedduwage
 
Call Girls in Dwarka Mor Delhi Contact Us 9654467111
Call Girls in Dwarka Mor Delhi Contact Us 9654467111Call Girls in Dwarka Mor Delhi Contact Us 9654467111
Call Girls in Dwarka Mor Delhi Contact Us 9654467111Sapana Sha
 
1029 - Danh muc Sach Giao Khoa 10 . pdf
1029 -  Danh muc Sach Giao Khoa 10 . pdf1029 -  Danh muc Sach Giao Khoa 10 . pdf
1029 - Danh muc Sach Giao Khoa 10 . pdfQucHHunhnh
 
Presentation by Andreas Schleicher Tackling the School Absenteeism Crisis 30 ...
Presentation by Andreas Schleicher Tackling the School Absenteeism Crisis 30 ...Presentation by Andreas Schleicher Tackling the School Absenteeism Crisis 30 ...
Presentation by Andreas Schleicher Tackling the School Absenteeism Crisis 30 ...EduSkills OECD
 
The basics of sentences session 2pptx copy.pptx
The basics of sentences session 2pptx copy.pptxThe basics of sentences session 2pptx copy.pptx
The basics of sentences session 2pptx copy.pptxheathfieldcps1
 
microwave assisted reaction. General introduction
microwave assisted reaction. General introductionmicrowave assisted reaction. General introduction
microwave assisted reaction. General introductionMaksud Ahmed
 
URLs and Routing in the Odoo 17 Website App
URLs and Routing in the Odoo 17 Website AppURLs and Routing in the Odoo 17 Website App
URLs and Routing in the Odoo 17 Website AppCeline George
 
Accessible design: Minimum effort, maximum impact
Accessible design: Minimum effort, maximum impactAccessible design: Minimum effort, maximum impact
Accessible design: Minimum effort, maximum impactdawncurless
 
Grant Readiness 101 TechSoup and Remy Consulting
Grant Readiness 101 TechSoup and Remy ConsultingGrant Readiness 101 TechSoup and Remy Consulting
Grant Readiness 101 TechSoup and Remy ConsultingTechSoup
 
The Most Excellent Way | 1 Corinthians 13
The Most Excellent Way | 1 Corinthians 13The Most Excellent Way | 1 Corinthians 13
The Most Excellent Way | 1 Corinthians 13Steve Thomason
 
Software Engineering Methodologies (overview)
Software Engineering Methodologies (overview)Software Engineering Methodologies (overview)
Software Engineering Methodologies (overview)eniolaolutunde
 
Student login on Anyboli platform.helpin
Student login on Anyboli platform.helpinStudent login on Anyboli platform.helpin
Student login on Anyboli platform.helpinRaunakKeshri1
 
Sanyam Choudhary Chemistry practical.pdf
Sanyam Choudhary Chemistry practical.pdfSanyam Choudhary Chemistry practical.pdf
Sanyam Choudhary Chemistry practical.pdfsanyamsingh5019
 
Arihant handbook biology for class 11 .pdf
Arihant handbook biology for class 11 .pdfArihant handbook biology for class 11 .pdf
Arihant handbook biology for class 11 .pdfchloefrazer622
 
1029-Danh muc Sach Giao Khoa khoi 6.pdf
1029-Danh muc Sach Giao Khoa khoi  6.pdf1029-Danh muc Sach Giao Khoa khoi  6.pdf
1029-Danh muc Sach Giao Khoa khoi 6.pdfQucHHunhnh
 
Introduction to ArtificiaI Intelligence in Higher Education
Introduction to ArtificiaI Intelligence in Higher EducationIntroduction to ArtificiaI Intelligence in Higher Education
Introduction to ArtificiaI Intelligence in Higher Educationpboyjonauth
 
Contemporary philippine arts from the regions_PPT_Module_12 [Autosaved] (1).pptx
Contemporary philippine arts from the regions_PPT_Module_12 [Autosaved] (1).pptxContemporary philippine arts from the regions_PPT_Module_12 [Autosaved] (1).pptx
Contemporary philippine arts from the regions_PPT_Module_12 [Autosaved] (1).pptxRoyAbrique
 

Recently uploaded (20)

A Critique of the Proposed National Education Policy Reform
A Critique of the Proposed National Education Policy ReformA Critique of the Proposed National Education Policy Reform
A Critique of the Proposed National Education Policy Reform
 
Call Girls in Dwarka Mor Delhi Contact Us 9654467111
Call Girls in Dwarka Mor Delhi Contact Us 9654467111Call Girls in Dwarka Mor Delhi Contact Us 9654467111
Call Girls in Dwarka Mor Delhi Contact Us 9654467111
 
1029 - Danh muc Sach Giao Khoa 10 . pdf
1029 -  Danh muc Sach Giao Khoa 10 . pdf1029 -  Danh muc Sach Giao Khoa 10 . pdf
1029 - Danh muc Sach Giao Khoa 10 . pdf
 
Presentation by Andreas Schleicher Tackling the School Absenteeism Crisis 30 ...
Presentation by Andreas Schleicher Tackling the School Absenteeism Crisis 30 ...Presentation by Andreas Schleicher Tackling the School Absenteeism Crisis 30 ...
Presentation by Andreas Schleicher Tackling the School Absenteeism Crisis 30 ...
 
The basics of sentences session 2pptx copy.pptx
The basics of sentences session 2pptx copy.pptxThe basics of sentences session 2pptx copy.pptx
The basics of sentences session 2pptx copy.pptx
 
microwave assisted reaction. General introduction
microwave assisted reaction. General introductionmicrowave assisted reaction. General introduction
microwave assisted reaction. General introduction
 
URLs and Routing in the Odoo 17 Website App
URLs and Routing in the Odoo 17 Website AppURLs and Routing in the Odoo 17 Website App
URLs and Routing in the Odoo 17 Website App
 
Accessible design: Minimum effort, maximum impact
Accessible design: Minimum effort, maximum impactAccessible design: Minimum effort, maximum impact
Accessible design: Minimum effort, maximum impact
 
Grant Readiness 101 TechSoup and Remy Consulting
Grant Readiness 101 TechSoup and Remy ConsultingGrant Readiness 101 TechSoup and Remy Consulting
Grant Readiness 101 TechSoup and Remy Consulting
 
The Most Excellent Way | 1 Corinthians 13
The Most Excellent Way | 1 Corinthians 13The Most Excellent Way | 1 Corinthians 13
The Most Excellent Way | 1 Corinthians 13
 
Software Engineering Methodologies (overview)
Software Engineering Methodologies (overview)Software Engineering Methodologies (overview)
Software Engineering Methodologies (overview)
 
Student login on Anyboli platform.helpin
Student login on Anyboli platform.helpinStudent login on Anyboli platform.helpin
Student login on Anyboli platform.helpin
 
Sanyam Choudhary Chemistry practical.pdf
Sanyam Choudhary Chemistry practical.pdfSanyam Choudhary Chemistry practical.pdf
Sanyam Choudhary Chemistry practical.pdf
 
Arihant handbook biology for class 11 .pdf
Arihant handbook biology for class 11 .pdfArihant handbook biology for class 11 .pdf
Arihant handbook biology for class 11 .pdf
 
INDIA QUIZ 2024 RLAC DELHI UNIVERSITY.pptx
INDIA QUIZ 2024 RLAC DELHI UNIVERSITY.pptxINDIA QUIZ 2024 RLAC DELHI UNIVERSITY.pptx
INDIA QUIZ 2024 RLAC DELHI UNIVERSITY.pptx
 
TataKelola dan KamSiber Kecerdasan Buatan v022.pdf
TataKelola dan KamSiber Kecerdasan Buatan v022.pdfTataKelola dan KamSiber Kecerdasan Buatan v022.pdf
TataKelola dan KamSiber Kecerdasan Buatan v022.pdf
 
Mattingly "AI & Prompt Design: The Basics of Prompt Design"
Mattingly "AI & Prompt Design: The Basics of Prompt Design"Mattingly "AI & Prompt Design: The Basics of Prompt Design"
Mattingly "AI & Prompt Design: The Basics of Prompt Design"
 
1029-Danh muc Sach Giao Khoa khoi 6.pdf
1029-Danh muc Sach Giao Khoa khoi  6.pdf1029-Danh muc Sach Giao Khoa khoi  6.pdf
1029-Danh muc Sach Giao Khoa khoi 6.pdf
 
Introduction to ArtificiaI Intelligence in Higher Education
Introduction to ArtificiaI Intelligence in Higher EducationIntroduction to ArtificiaI Intelligence in Higher Education
Introduction to ArtificiaI Intelligence in Higher Education
 
Contemporary philippine arts from the regions_PPT_Module_12 [Autosaved] (1).pptx
Contemporary philippine arts from the regions_PPT_Module_12 [Autosaved] (1).pptxContemporary philippine arts from the regions_PPT_Module_12 [Autosaved] (1).pptx
Contemporary philippine arts from the regions_PPT_Module_12 [Autosaved] (1).pptx
 

Financial analysis using DU- PONT ANALYSIS BY P. SAI PRATHYUSHA

  • 1. 1 | P a g e P. SAIPRATHYUSHA PONDICHERRY UNIVERSITY DEPARTMENT OF COMMERCE DU- PONT ANALYSIS II SEMESTER PREPARED BY: P. SAI PRATHYUSHA 1ST M.COM BUSINESS FINANCE
  • 2. 2 | P a g e P. SAIPRATHYUSHA A STUDY OF FINANCIAL PERFORMANCE USING DU-PONT ANALYSIS IN THE FMCG SECTOR. *** P. SAI. PRATHYUSHA, 1ST M.COM BUSINESS FINANCE, DEPARTMENT OF COMMERCE, SCHOOL OF MANAGEMENT, PONDICHERRY UNIVERSITY. ABSTRACT In this study we can see how the Du-Pont Analysis is used to evaluate the financial performance of a company. To use the Du-Pont Analysis there is a three-step model followed where the net profit margin, the assets turnover ratio and the financial leverage is used. To apply the Du-Pont analysis I have selected two companies from the FMCG sector and I have calculated the ROI using the Du- Pont Analysis. INTRODUCTION Performance evaluation of a company is usually related to how well a company can use its assets and how well a company can generate profit by utilizing its assets. Performance evaluations are one of the most important communication tools an organisation can use. Performance evaluation benefits both the employee as well as the employer. It helps the organisation in providing timely feedback, it recognises the quality performance of the company and sets expectations for future. Du Pont analysis is said to be an expression which breaks the Return on Investment (ROI) into three parts. Du Pont analysis is one of the important tools for performance evaluation of any company. For determining the financial position of a company and to know how well the company performs its activities as well as the profitability and asset utilizing capacity of the company, Du Pont analysis plays an important role. Du Pont analysis easily measures return of equity related to the company for performance evaluation. It analyses the company’s profitability and asset utilization. It measures overall performance and efficiency of a company. This method is used to analyse companies past financial performance and it also predicts the future trend of financial position. The historical backgrounds of the two selected companies are as follows: BACKGROUND  Nestle India Ltd: Nestle India Ltd is one of the biggest players in the FMCG sector. The company is mainly engaged in the food business. Nestle India Ltd was established in India in the year 1956. The company has various segments and products such as milk products, nutrition, beverages, chocolates, confectionary. The company manufactures products of truly international quality under the internationally famous names such as NESCAFE, MAGGI, KIT-KAT, BAR-ONE, MILKMAID and NESTEA. Nestle India is a responsible organisation and facilitates initiatives that help in order to improve the quality of lives in the communities where it operates. The culture of innovation and renovation within the company gives it a distinct advantage.
  • 3. 3 | P a g e P. SAIPRATHYUSHA  Britannia Industries Ltd: It is an Indian food products corporation founded in the year 1892 and is one of India’s 100 most trusted brands. The company’s principal’s activity it to manufacture and sale of biscuits,bread, rusk, cakes and dairy products.The company’s manufactures India’s mostfavourite brands suchas Good day, Tiger, Nutri choice, Milk Bikis and Marie gold. The company enjoys a large market share and is growing profitably. The company’s revenue as of 2019 is Rs 10,672 crore (US $ 1.5 billion) with a market share of 38%. The company’s sales grew at a compound annual rate of 16% and the operating profits reached 18%. STATEMENT OF PROBLEM The Return on equity (ROE) lacks the quality of financial analysis which is better explained through Du-Pont analysis. Du- Pont analysis gains an advantage over the ROE due to the risk analysis which can be done with the help of Return on Investment. PURPOSE OF STUDY The purpose of this study is to evaluate the performance of two FMCG companies in India by measuring ROCE using the Du Pont analysis. The study analyses the financial conditions of the selected two FMCG companies in India. REVIEW OF LITERATURE Liesz (1999), in his study states that determining the reason for failure of small firms is troublesome and to analyse the reason for failure, Du Pont analysis can be used and he also stated that the Du Pont analysis can be used to evaluate the performance of the company. He stated that in case the company wants to know its performance level, it is required that the company calculates the asset turnover, profit margin and the financial leverage. In his study he has mentioned that these ratios help the company to know the reasons for its failure. Muhammad (2006), in his study has mentioned that the ROA has an impact on the profitability, efficiency and the operating decisions of a firm. This helps in planning and control which in-turn increases the ROA. He has also mentioned that the Du Pont model shift from the ROA to ROE has been modified to make it as a powerful tool for the strategic decision making within the organisation to increase the ROE. Maria Zain (2008), In his study he mentions that the return on asset is an important factor and is also an indicator to dictate how well the assets are used to generate revenue. He mentions that the higher return on asset indicated that the company’s asset utilization is not good enough to generate the revenue. Maranville (2008), in his study he mentions that there is Du-Pont model that has combination of five ratios in order to determine the ROE. He also mentions that scrutiny of the annual statements of a company alone are not sufficient and the company requires to also look at the operating decision (profitability and efficiency) and financing decisions (leverage). He says that according to the recent evidence it has been shown that the modified Du-Pont analysis can be used to find the causes for financial problems.
  • 4. 4 | P a g e P. SAIPRATHYUSHA Rogova (2014), in his study has said that the Du Pont analysis helped in effectively revealing the factors of efficiency. In his study he found that a strong advantage of ROE was the possibility of its disaggregation into different profitability ratios, with ROE giving the indication of the profitability and efficiency from the shareholder’s point of view. OBJECTIVES OF STUDY  To understand the Du-Pont Analysis and the model used.  To know the financial performance of Nestle India Ltd and Britannia Ltd  To compare the financial performance of the selected companies using Du-Pont analysis and see which company performs better among the two companies.  To study how Du-Pont analysis helps in evaluating the financial performance of the selected companies. DU- PONT DEFINITION Du- Pont analysis is a tool used for evaluating the financial performance of a company by calculating the Return on Investment (ROI) by breaking the components into three. The three components used in the calculation are profit margin, Asset turnover, and the leverage factor. When the components of ROI are broken, it helps the investors to examine how effectively a company performs in each area. To find the ROI through Du- Pont analysis, one must find the net profit margin, Assets turnover ratio and the financial leverage. When we multiply all the three, we get the required ROI. Du-PONT IS USEFUL FOR WHOM There are four beneficiaries from the Du-Pont analysis.  It is useful for the company and it helps the business to understand how the segment is contributing to the overall ROE of the company. In fact, this can be used as a reliable indicator of the performance measurement of divisional managers.  For the top management, this can be useful in making decisions such as the capital allocation. The capital has to be allocated to the business which contributes most of the ROE of the company with minimal risk. Increasing the ROE by increasing the leverage is not a good idea.  Du- Pont helps the analyst in tracking the stock to pin point the actual triggers that are driving the performance of the company and whether these factors are useful or not. This is what ultimately matters when it comes to valuation of the company.  Lastly and finally, the fund managers will take a decision on comparative investments based on the ROE analysis. Over a longer period of time it is the ROE that drives valuations and also the P/E ratio re- rating. That only happens when the ROE boost is sustainable. That is exactly what the Du-Pont analysis captures.
  • 5. 5 | P a g e P. SAIPRATHYUSHA Du-PONT CONTROL CHART The Du-Pont analysis can be better understood with the help of a Du-Pont control chart. DU- Pont Control Chart Return on Investment or Capital Employed = 𝑵𝒆𝒕 𝑷𝒓𝒐𝒇𝒊𝒕 𝑪𝒂𝒑𝒊𝒕𝒂𝒍 𝑬𝒎𝒑𝒍𝒐𝒚𝒆𝒅 ∗ 𝟏𝟎𝟎 Net Profit Margin (as% of sales) = 𝑵𝒆𝒕 𝑷𝒓𝒐𝒇𝒊𝒕 𝑵𝒆𝒕 𝑺𝒂𝒍𝒆𝒔 ∗ 𝟏𝟎𝟎 Total Assets turnover = 𝑺𝒂𝒍𝒆𝒔 𝑪𝒂𝒑𝒊𝒕𝒂𝒍 𝑬𝒎𝒑𝒍𝒐𝒚𝒆𝒅 ∗ 𝟏𝟎𝟎 Net profit after tax Net Sales Net Sales Total assets Or capital employed Net Sales +/- Net Operating surplus or deficit Cost of Sales ` Cost of Goods sold + Operating Expenses + Interest Charges + Corporate income Tax Current Assets Fixed Assets Cash and Bank balance + Marketable securities + Trade Receivables + Inventories + Other current assets
  • 6. 6 | P a g e P. SAIPRATHYUSHA METHODOLOGY USED Methodology represents how the data is collected, analysed and used for the study. It is a systematic and theoretical analysis of the methods applied to a field of study. It describes about the DU- Pont decomposition and the formula used for measuring the financial performance quantitative approach has been used in this study to obtain the results. ROI has been calculated using the three step DU- Pont model and is explained below.  THREE STEP DU- PONT MODEL ROI using Du-Pont analysis is calculated as follows: This three-step Du- Pont analysis, gives the organisation information about the performance of the company, the profitability of the company, the asset management of the company and the leverage creation of the company. The higher the ROI, the higher is the growth of the company.  NET PROFIT MARGIN (Step 1): The Net Profit margin is the proportion of earnings of a company from its sales. This will be different for different industries because the competitors play a role in the earnings of a company and it has an impact on the earnings margin. This is the reason why we should compare the profit margins only with its peer companies. The profit margin gives a good sign of pricing strategy and growth of the company. The better the profit margin, the better is the company. For increasing the profit margin, the company should either increase its production or minimise the costs. The formula used to calculate the Net Profit Margin is as follows:  ASSET TURNOVER (step 2): The asset turnover ratio measures how the company earns from its assets. Generally, a low margin company have high asset turnover because they rely more in increase in sales rather than the additional cost incurred in the asset. On the other hand, high margin company have low asset turnover because they invest more in the assets rather than the increase in the sales. The formula used to calculate the Asset turnover is as follows:  MULTIPLY (Step3): Whenwe multiplythe Net ProfitMarginand the assets turnover, we get the required ROI. ROI= Net Profit Margin * Asset Turnover NET PROFIT MARGIN= NET PROFIT/SALES ASSET TURNOVER = SALES/ TOTAL ASSETS
  • 7. 7 | P a g e P. SAIPRATHYUSHA  TOOLS USED Calculations have been done using MS Excel and the tabular representation is done to present the data. To do the data analysis, secondary data has been collected. The data has been collected from Bloomberg source. The two selected company’s (Nestle India Ltd and Britannia Ltd) balance sheet and Income Statement as per GAAPhave been taken to do the calculations. The data of 2 years (i.e., 2017-2019) have been collected to do the study. DATA ANALYSIS AND INTERPRETATION Return on Equity (ROE): ROE is one of the basic tests that is used by the company in knowing how effectively a company’s management usesthe money of the investors. It will help the investors to know whetherthe managementisgrowingthe company’svalue atan acceptable rate by usingthe moneyof the investors.Thisratioalsomeasuresthe rate of return that the firmearnson the shareholder’s equity. The shareholders equity is the denominator in the formula used. This ratio influences the amount of firm’s debt in using the finance assets. The formula used to calculate the Return on equity (ROE) is as follows Usingthe above formula,the ROE hasbeen calculatedforthe two selected companies(i.e., Nestle India Ltd and Britannia Ltd) and the calculations are below ROE calculations using the Du- Pont analysis is below: ROE = 𝑵𝒆𝒕 𝑰𝒏𝒄𝒐𝒎𝒆 𝑺𝒂𝒍𝒆𝒔 * 𝑺𝒂𝒍𝒆𝒔 𝑨𝒔𝒔𝒆𝒕𝒔 * 𝑨𝒔𝒔𝒆𝒕𝒔 𝑬𝒒𝒖𝒊𝒕𝒚 = 𝑵𝒆𝒕 𝑰𝒏𝒄𝒐𝒎𝒆 𝑬𝒒𝒖𝒊𝒕𝒚
  • 8. 8 | P a g e P. SAIPRATHYUSHA ROE INTERPRETATION FOR NESTLE INDIA LTD:  As per the calculation done above, we can clearly see that Nestle India Ltd has a ROE of 16.64% in the FY 2017-2018 and 19.87% in the FY 2018-2019. It is clear that the ROE of the company has increased over the year by 3.23%.  The increase in the ROE of Nestle India Ltd shows that the investor’s money is put to proper use by the management. A rising ROEsuggests that the company is increasing its profit generation without needing much capital. An increase in the ROE also implies that the company has increased its debt as we can see in the above table, the long- term debt of the company has been increased from Rs 39,420 to Rs 44,143. So, this means that the increase in the ROE by 3.23% is due to the increase in the long-term debt by Rs 4,723. ROE INTERPRETATION FOR BRITANNIA LTD:  As per the calculation done and shown above, we can see that ROE of Britannia Ltd is 19.36% for the FY 2017-2018 and 18.57% for the FY 2018-2019. We can see that there is a decrease in the ROE by 0.79%.  The decrease in the ROE of Britannia Ltd shows that the investors money is not put to proper use by the management. The decrease in the ROE indicates that the company is being mismanaged and that the company could be using the amount in reinvesting the earnings into unproductive assets.  The decrease in ROE is only 0.79% which shows that there is consistency in using the investor’s amount. Return on Investment (ROI): ROI is a performance measure that is used to evaluate the efficiency of an investment or to compare the efficiency of a number of different investments. ROI tries to directly measure the amount of return on a particular investment., relative to the investment’s cost. The purpose of ROI is to measure, per period, rate of return on money invested in an economic entity in order to decide whether to undertake an investment or not. It is also used as an indicator to compare the different investment portfolio. The investment with largest ROI is usually preferred. The formula used to calculate the Return on Investment (ROI) is as follows Using the above formula, the ROI has been calculated for the two selected companies (i.e., Nestle India Ltd and Britannia Ltd) and the calculations are below ROI = Profit Margin * Assets Turnover Or 𝑵𝒆𝒕 𝑰𝒏𝒄𝒐𝒎𝒆 𝒔𝒂𝒍𝒆𝒔 * 𝑺𝒂𝒍𝒆𝒔 𝑪𝒂𝒑𝒊𝒕𝒂𝒍 𝑬𝒎𝒑𝒍𝒐𝒚𝒆𝒅 = 𝑵𝒆𝒕 𝑰𝒏𝒄𝒐𝒎𝒆 𝑪𝒂𝒑𝒊𝒕𝒂𝒍 𝑬𝒎𝒑𝒍𝒐𝒚𝒆𝒅
  • 9. 9 | P a g e P. SAIPRATHYUSHA ROI calculations using the Du- Pont analysis is below: ROI INTERPRETATION FOR NESTLE INDIA LTD:  As per the calculations shown above, we can see that the ROI of Nestle India Ltd is 35.82% in the FY 2017-2018 and 43.74% in the FY 2018-2019. We can clearly see that there is an increase in the ROI of the company from FY 2017-18 to FY 2018-19 by 7.92%.  The increasein the ROIindicates that the company has utilized its assets in a good way.  As the company’s ROI is increasing over the year it is expected to increase in the coming years and hence it is good to make an investment in this company. ROI INTERPRETATION FOR BRITANNIA LTD:  As per the calculations shown above, we can see that the ROI of Britannia Ltd is 29.37% in the FY 2017-2018 and 27.04% in the FY 2018-2019. Wecan clearly see that there is a decrease in the ROI of the company over the year by 2.33%.  The decrease in the ROI of the company over the year has indicated that the company has not utilised its assets in a good way.  As the ROI has decreased over the year, the investors should take caution before investing in the company.
  • 10. 10 | P a g e P. SAIPRATHYUSHA DU-PONT ANALYSIS OF THE SELECTED TWO COMPANIES USING CONTROL CHART LIMITATIONS OF THE STUDY There are some limitations of the Study. Du Pont analysis is used for performance evaluation of the companies. When conducting the research some problems have been faced. For evaluating performance have to choose a method that is appropriate. However, data should be correct, otherwise calculation may be baffling. Sometimes the items to analyse could not find appropriately as a result there may have some lacking in comparing among those companies.
  • 11. 11 | P a g e P. SAIPRATHYUSHA There are some drawbacks of Du Pont decomposition also. Such as-  The DuPont identity is an accounting identity and this model relies on accounting data, which can be altered by companies to hide short-term weaknesses (even though this is unethical).  DuPont decomposition does not include the cost of capital.  How much increase of debt will determine the negative or positive return to shareholders is not recognized by this disaggregation. FINDINGS AND CONCLUSIONS  In the year 2017-2018, when we see the ROIand ROEof Nestle India Ltd and Britannia Ltd, we can say that Nestle India Ltd has comparatively shown higher ratios when compared to Britannia Ltd.  In the year 2018-2019, when we see the ROIand ROEof Nestle India Ltd and Britannia Ltd, we can say that again Nestle India Ltd has comparatively shown higher ratios when compared to Britannia Ltd.  Overall, Nestle India ltd has a higher ROIand ROE when comparedwith ROIand ROE of Britannia Ltd.  This implies that Nestle India Ltd will be able to generate more returns to the shareholders on their funds and more return on their assets when compared to Britannia Ltd.  This indicates that the Nestle India Ltd company’s management is more efficient in using the shareholder’s funds.  The low ratios of Britannia Ltd could be due to the increase in long term debts which is not good for a company.  This analysis makes it easy for the investors to make their investment decision. It is preferred that the investors invest in Britannia company because of its high returns that it gives. ROI and ROE are tools used by companies and organisations to know the ability of their performance. ROI helps the company and the shareholders in knowing how well it is using the assets to generate the returns or revenue. ROE helps the company and the shareholders in knowing how efficiently it is using the shareholder’s funds and how much returns they can give back to their shareholders. Higher ratios in ROI and ROE indicates better performance of the company and the growth of the firm. In this study, Nestle India Ltd has higher ratios in ROI and ROE when compared to Britannia Ltd and the company also shows more consistency. Britannia Ltd also can improve its performance by using the shareholders amount in a proper way. REFERENCES  https://www.investopedia.com/terms/d/dupontanalysis.asp  Soliman M (2008). The use of Du-Pont analysis by market participants. The accounting review, 83(3), 823- 853  Zain, Maria (2008). How to use the profitability ratios. Journal of profitability ratio analysis  Bleby, M. (2010). Pioneer to pay R 500 million fine í cancels dividend. Available at: http://www.bdlive.co.za/ articles/2010/11/02/pioneer-to-pay-r500-million-fine---cancels-dividend  Accounting Coach. (2015).what is the statement of financial position? Available at: http://www.accounting coach.com/blog/what-is-the-statement-of-financial-position