SlideShare a Scribd company logo
1 of 57
Download to read offline
National Thermal Power Corporation (NTPC)
Summer Internship Report on
FINANCIAL ANALYSIS OF NATIONAL THERMAL
POWER CORPORATION
AT
NATIONAL THERMAL POWER CORPORATION
(NTPC) KAHALGAON
(In partial fulfillment of MBA Course)
For the period
15th
June to 30st
July, 2017
Under the guidance of
Mrs. Shweta Jaiswal
(FINANCE)
UNIVERSITY DEPARTMENT OF COMMERCE &
BUSSINESS ADMINISTRATION
Submitted by
Nirbhay Kumar
Class Roll no. - 13
University Roll no. - 05
Academic Session: 2016-2018
Master of Business Administration (Finance)
National Thermal Power Corporation (NTPC)
DECLARATION
I, Nirbhay Kumar Class Roll No 13, University Roll No.05 student of MBA-Finance
Management (2016-18) at National Thermal Power Corporation (NTPC) Training Institute,
Kahalgaon, Bhagalpur hereby declare that the Summer Training Report entitled “Financial
Analysis of NTPC AT NTPC, Kahalgaon.” is an original work and the same has not been
submitted to any other Institute for the award of any other degree.
A Seminar presentation of the Training Report was made on
________________________and the suggestions as approved by the faculty were duly
incorporated.
Presentation In-Charge Signature of the Candidate
(Faculty)
Countersigned
Director/Principal of the Institute
National Thermal Power Corporation (NTPC)
ACKNOWLEDGEMENT
It is my pleasure to be indebted to various people, who directly or indirectly
contributed in the development of this work and who influenced my thinking,
behavior, and acts during the course of study.
I express my sincere gratitude to Prof.(Dr.) Pawan Kumar Poddar, Head of
the Department, Department of Business Administration, TMBU, Bhagalpur for
providing me an opportunity to undergo summer training at NTPC,
I am thankful to Mr. K. Barman, Senior Manager, Book & Budget Section,
NTPC for his support, cooperation, and motivation provided to me during the training
for constant inspiration, presence and blessings.
I also extend my sincere appreciation to Mrs. Shweta Jaiswal, Faculty Guide,
MBA, TMBU, Bhagalpur who provided her valuable suggestions and precious time in
accomplishing my project report.
Lastly, I would like to thank the almighty and my parents for their moral
support and my friends with whom I shared my day-to-day experience and received
lots of suggestions that improved my quality of work.
Nirbhay Kumar
M.B.A. Finance
2016-18
National Thermal Power Corporation (NTPC)
EXECUTIVE SUMMARY
This report is an analysis of the financial operations and performance of the company for the
period of March-2012 to March 2016. This report will provide an assessment and analysis of
the profitability, liquidity, performance and financial position of the NTPC using figures from
the financial statements for the March-2012 to March 2016. In the analysis, financial ratios
were used to gain a critical review of the specific areas of assessment of the company’s
performance. The ratios were able to provide a clear view of the overall performance of the
company. From the ratios we can say that the year 2016 has not been profitable mainly
because of high expenditures mainly rates and insurance. Gross Profit margin is very good
which implies that direct costs are properly monitored. The company has a healthy liquidity
position which means that it can rely on its current assets to finance the current liabilities and
does not have to commit to long term debts. However, it can be noticed that the future look
bright, firstly because of recovering losses and secondly because healthy financing structure
giving that it relies a heavily on debts. It has been recommended that the company should
look into ways of improving sales in period of low demand to improve profitability and also
increase financing to expand and grow the business. The analysis is limited mainly due to the
fact that it is based on financial statement, and hence no comparative study has been made
possible. Given the nature of the business, it would have been interesting to evaluate the
business by comparing with past years results and also with the industry benchmark.
National Thermal Power Corporation (NTPC)
5
LIST OF FIGURES
Figure 1- Installed Capacity by source 5
Figure 2- Solar Panel installed by NTPC 7
Figure 3- Providing Schooling Facility 7
Figure 4- Nuclear Power Plant Installed by NTPC 8
Figure 5- Providing Schooling Facility within campus for best education 8
Figure 6- Develop Green Belt by NTPC 9
Figure 7- Providing Health Care facility to Rural people 9
Figure 8- Nuclear Power & Solar Power Plant Installed by NTPC 10
Figure 9- Empowering women by providing training for self employment 10
Figure 10- Comparison of EPS & DPS 24
Figure 11- Comparison of ROA, ROE and ROCE 27
Figure 12- Enterprise Value – Capital Employed Ratio 36
Figure 13- Cash Flow 39
LIST OF TABLES
Table 1- Ratio Summery of last 5 years 37
Table 2—Cash Flow Statement of NTPS of last 5 years 40
National Thermal Power Corporation (NTPC)
6
TABLE OF CONENTS
CERTIFICATE I
ACKNOWLEDGEMENT II
EXECUTIVE SUMMARY III
LIST OF FIGURE IV
LIST OF TABLES IV
CHAPTER--I
INTRODUCTION
1.1 MEANING OF FINANCIAL ANALYSIS 1
1.2 HISTORY OF ELECTRICITY INDUSTRY IN INDIA 3
1.3 COMPANY PROFILE 6
1.4 BUSINESS PROFILE 12
1.5 CRITICAL ASSESSMENT AND EVELUATION OF THE ORGANIZATION (SWOT ANALYSIS) 14
1.6 COMPETITORS 16
CHAPTER--II
RESEARCH METHODOLOGY & RELEVANCE OF THE PROJECT
2.1 RESEARCH METHODOLOGY…………………………………………………………………………………………………..18
2.2 RATIO ANALYSIS……………………………………………………………………………………………………………….. 19
2.3 OBJECTIVES……………………………………………………………………………………………………………………….20
2.4 SIGNIFICANCE OF THE PROJECT………………………………………………………………………………………………20
2.5 CONCEPTUALIZATION…………………………………………………………………………………………………...……..21
National Thermal Power Corporation (NTPC)
7
CHAPTER—III
FINANCIAL ANALYSIS
3.1 INTRODUCTION TO FINANCIAL ANALYSIS ……………………………………. ………………..22
3.1.1 Meaning of Financial Analysis…………………………………………………………………………………………….22
3.1.2 Operational & Financial Ratio……………………………………………………………………………………………………………….. 22
3.1.3 Performance ratio……………………………………………………………………………………………………………………… 24
3.1.4 Valuation Ratio…………………………………………………………………………………………………………………………..28
CHAPTER--IV
FINDINGS OF THE PROJECT & COMPARITIVE ANALYSIS
4.1 FINDINGS OF THE PROJECT………………………………………………………………………………………….. 41
4.1.1 WORKING CAPITAL RATIO………………………………………………………………………………………. ....41
4.1.2 CURRENT RATIO……………………………………………………………………………………………………….42
.
4.1.3 ACID TEST RATIO (Liquid/Quick Ratio) …………………………………………………… ……………………..43
4.1.4 CASH RATIO…………………………………………………………………………………………………………….43
4.1.5 INVENTORY TURNOVER RATIO……………………………………………………………………………………44
4.1.6 DEBTOR TURNOVER RATIO…………………………………………………………………………………………44
4.1.7 CREDITOR TURNOVER RATIO………………………………………………………………………………………45
4.1.8 CURRENT ASSETS TO TOTAL ASSETS RATIO…………………………………………………………………….46
4.1.9 WORKING CAPITAL TURNOVER RATIO…………………………………………………………………………..46
CHAPTER--V
RESULTS & THE WAY FORWARD
5.1 RECOMMENDATIONS AND THE WAY FORWARD……………………………………………………………47
5.2 RESULTS AND CONCLUSIONS…………………………………………………………………………………………...49.
5.3 BIBLIOGRAPHY………………………………………………………………………………………………………………50
National Thermal Power Corporation (NTPC)
8
CHAPTER – I
INTRODUCTION
1.1 MEANING OF FINANCIAL ANALYSIS
Financial analysis (also referred to as financial statement analysis or accounting analysis or
Analysis of finance) refers to an assessment of the viability, stability and profitability of a
business, sub-business or project.
It is performed by professionals who prepare reports using ratios that make use of information
taken from financial statements and other reports. These reports are usually presented to top
management as one of their bases in making business decisions. Financial analysis may
determine if a business will:
 Continue or discontinue its main operation or part of its business;
 Make or purchase certain materials in the manufacture of its product;
 Acquire or rent/lease certain machineries and equipment in the production of its
goods;
 Issue stocks or negotiate for a bank loan to increase its working capital;
 Make decisions regarding investing or lending capital;
Make other decisions that allow management to make an informed selection on various
alternatives in the conduct of its business.
1.2. Goals :-
Financial analysts often assess the following elements of a firm:
1. Profitability - its ability to earn income and sustain growth in both the short- and long-term.
A company's degree of profitability is usually based on the income statement, which reports
on the company's results of operations;
2. Solvency - its ability to pay its obligation to creditors and other third parties in the long-
term;
National Thermal Power Corporation (NTPC)
9
3. Liquidity - its ability to maintain positive cash flow, while satisfying immediate
obligations;
Both 2 and 3 are based on the company's balance sheet, which indicates the financial
condition of a business as of a given point in time.
4. Stability - the firm's ability to remain in business in the long run, without having to sustain
significant losses in the conduct of its business. Assessing a company's stability requires the
use of both the income statement and the balance sheet, as well as other financial and non-
financial indicators. etc.
1.3. Methods :-
Financial analysts often compare financial ratios (of solvency, profitability, growth, etc.):
Past Performance - Across historical time periods for the same firm (the last 5 years for
example),
Future Performance - Using historical figures and certain mathematical and statistical
techniques, including present and future values, This extrapolation method is the main source
of errors in financial analysis as past statistics can be poor predictors of future prospects.
Comparative Performance - Comparison between similar firms.
These ratios are calculated by dividing a (group of) account balance(s), taken from the
balance sheet and / or the income statement, by another, for example :
 Net income / equity = return on equity (ROE)
 Net income / total assets = return on assets (ROA)
 Stock price / earnings per share = P/E ratio
Comparing financial ratios is merely one way of conducting financial analysis. Financial
ratios face several theoretical challenges:
They say little about the firm's prospects in an absolute sense. Their insights about relative
performance require a reference point from other time periods or similar firms.
One ratio holds little meaning. As indicators, ratios can be logically interpreted in at least two
ways. One can partially overcome this problem by combining several related ratios to paint a
more comprehensive picture of the firm's performance.
National Thermal Power Corporation (NTPC)
10
Seasonal factors may prevent year-end values from being representative. A ratio's values may
be distorted as account balances change from the beginning to the end of an accounting
period. Use average values for such accounts whenever possible.
Financial ratios are no more objective than the accounting methods employed. Changes in
accounting policies or choices can yield drastically different ratio values.
Fundamental analysis.
Financial analysts can also use percentage analysis which involves reducing a series of
figures as a percentage of some base amount. For example, a group of items can be expressed
as a percentage of net income. When proportionate changes in the same figure over a given
time period expressed as a percentage is known as horizontal analysis. Vertical or common-
size analysis, reduces all items on a statement to a “common size” as a percentage of some
base value which assists in comparability with other companies of different sizes. As a result,
all Income Statement items are divided by Sales, and all Balance Sheet items are divided by
Total Assets.
Another method is comparative analysis. This provides a better way to determine trends.
Comparative analysis presents the same information for two or more time periods and is
presented side-by-side to allow for easy analysis.
1.4. History of Electricity Industry in India
The first demonstration of an electric light in Calcutta (now Kolkata) was conducted on 24 July 1879 by
P.W. Fleury & Co. On 7 January 1897, Kilburn & Co secured the Calcutta electric lighting licence as
agents of the Indian Electric Co, which was registered in London on 15 January 1897. A month later, the
company was renamed the Calcutta Electric Supply Corporation. The control of the company was
transferred from London to Calcutta only in 1970. Enthused by the success of electricity in Calcutta, power
was thereafter introduced in Bombay (now Mumbai). Mumbai saw electric lighting demonstration for the
first time in 1882 at Crawford Market and the Bombay Electric Supply & Tramways Company (BEST) set
up a generating station in 1905 to provide electricity for the tramway.
The first hydroelectric installation in India was installed near a tea estate at Sidrapong for the Darjeeling
Municipality in 1897. The first electric street light in Asia was lit on 5 August 1905 in Bangalore. The first
electric train in the country ran on the Harbour Line between Bombay's Victoria Terminus and Kurla on 3
National Thermal Power Corporation (NTPC)
11
February 1925. On 18 August 2015, Cochin International Airport became the world's first fully solar
powered airport with the inauguration of a dedicated solar plant.
India began utilizing grid management on a regional basis in the 1960s. Individual State grids were
interconnected to form 5 regional grids covering mainland India. The grids were the Northern, Eastern,
Western, North Eastern and Southern Grids. These regional links were established to enable transmission
of surplus electricity between States in each region. In the 1990s, the Indian government began planning
for a national grid. Regional grids were initially interconnected by asynchronous HVDC back-to-back links
facilitating limited exchange of regulated power. The links were subsequently upgraded to high capacity
synchronous links.
The first interconnection of regional grids was established in October 1991 when the North Eastern and
Eastern grids were interconnected. The Western Grid was interconnected with the aforementioned grids in
March 2003. The Northern grid was also interconnected in August 2006, forming a Central Grid
synchronously connected operating at one frequency.[21]
The sole remaining regional grid, the Southern
Grid, was synchronously interconnected to the Central Grid on 31 December 2013 with the commissioning
of the 765 kV Raichur-Solapur transmission line, thereby establishing the National Grid.[21][22]
By the end of calendar year 2015, despite poor hydro electricity generation, India had become a power
surplus nation with huge electric power generation capacity idling for want of power demand. The calendar
year 2016 started with steep fall in the international price of energy commodities such as coal, diesel
oil, naphtha, bunker fuel and LNG which are used in electricity generation in India. Earlier many of the
power stations which are using fuels other than coal are unable to operate due to high cost of LNG and
petro products. This situation has changed due to glut in petroleum products globally. The prices are falling
to such an extent that these fuels have become cheaper to give competition for pit head coal based power
generators. Many of the stranded gas and liquid fuel based power stations would be competing with
indigenous coal based power stations in an electricity market where demand growth is not encouraging. All
the segments of the electricity sector such as fuel suppliers, fuel transporters (railways, harbors, pipelines,
etc.), electricity generators, electricity transmission companies and distribution companies would be facing
severe competition to cut down the prices and improve their operating efficiency in a final consumer
dictated market.[31]
Due to tepid growth in electricity consumption, coal stocks are continuously building up
at power stations as well as coal mines.
National Thermal Power Corporation (NTPC)
12
On March 29, 2017 the Central Electricity Authority stated that for the first time India has become net
exporter of electricity. India exported 5,798 GWh to neighbouring countries, against a total import of 5,585
GWh.
 Coal: 194,432.88 MW (58.9%)
 Large Hydro: 44,614.42 MW (13.5%)
 Small Hydro: 4,384.55 MW (1.3%)
 Wind Power: 32,508.17 MW (9.8%)
 Solar Power: 13,114.85 MW (4.0%)
 Biomass: 8,295.78 MW (2.5%)
 Nuclear: 6,780 MW (2.1%)
 Gas: 25,185.38 MW (7.6%)
 Diesel: 837.63 MW (0.3%)
Installed Capacity by Source
Coal
Large Hydro
Small Hydro
Wind power
Solar Power
Biomass
Nuclear
Gas
Diesel
National Thermal Power Corporation (NTPC)
13
1.5. COMPANY PROFILE
NTPC Ltd., formerly known as National Thermal Power Corporation Limited, is
an Indian Public Sector Undertaking, engaged in the business of generation of electricity and
allied activities. It is a company incorporated under the Companies Act 1956 and a
"Government Company" within the meaning of the act. The headquarters of the company is
situated at New Delhi. NTPC's core business is generation and sale of electricity to state-
owned power distribution companies and State Electricity Boards in India. The company also
undertakes consultancy and turnkey project contracts that involve engineering, project
management, construction management and operation and management of power plants.
The company has also ventured into oil and gas exploration and coal mining activities. It is
the largest power company in India with an electric power generating capacity of 51,410
MW. Although the company has approx. 16% of the total national capacity it contributes to
over 25% of total power generation due to its focus on operating its power plants at higher
efficiency levels (approx. 80.2% against the national PLF rate of 64.5%).NTPC currently
produces 25 billion units of electricity per month.
It was founded by Government of India in 1975, which now holds 69.74% of its equity shares
on 30.06.2016 ]
(after divestment of its stake in 2004, 2010, 2013, 2014 & 2016)
In May 2010, NTPC was conferred Maharatna status by the Union Government of India. It is
ranked 300th in the Forbes Global 2000 for 2016.
In October 2005, the company's name was changed from "National Thermal Power
Corporation Limited" to "NTPC Limited".[10]
The primary reason for this change was the
company's foray into hydro and nuclear based power generation along with backward
integration by coal mining. In 2006, it entered into an agreement with Government of Sri
Lanka to set up two units of 250 MW each in Trincomalee in Sri Lanka. During 2008 and
2011, NTPC entered into Joint Ventures with BHEL, Bharat Forge, NHPC, Coal
India, SAIL, NMDC and NPCIL to expand its business of power generation. By the end of
2010, its installed capacity crossed 31,000 MW.
The company in 2009 joined forces with other state enterprises Rashtriya Ispat Nigam, Steel
Authority of India, Coal India, National Minerals Development Corporation and National
Thermal Power Corporation to invest in coal mining operations through a joint venture
vehicle named International Coal Ventures Private Limited (ICVL). In July 2014 ICVL
acquired a 65 percent stake in the Benga coal mine in Mozambique from the Rio Tinto
Group.
National Thermal Power Corporation (NTPC)
14
1.5.1 Vision & Mission
Figure 2. :- Solar Panel installed by NTPC
Vision
TO BE THE WORLD’S LEADING POWER COMPANY, ENERGIZING INDIA’S
GROWTH.
Mission
PROVIDE RELIABLE POWER AND RELATED SOLUTIONS IN AN ECONOMICAL,
EFFICIENT AND ENVIRONMENT FRIENDLY MANNER, DRIVEN BY INNOVATION
AND AGILITY.
Figure 3 :- Providing Schooling Facility
National Thermal Power Corporation (NTPC)
15
Core Values: ICOMIT
 Integrity
 Customer Focus
 Organisational Pride
 Mutual Respect & Trust
 Innovation & Learning
 Total Quality & Safety
Figure 4 :- Nuclear Power Plant Installed by NTPC

Figure 5 :- Providing Schooling Facility within campus for best education

National Thermal Power Corporation (NTPC)
16
Figure 6:- Develop Green Belt by NTPC

Figure 7 :- Providing Health Care facility to Rural people

National Thermal Power Corporation (NTPC)
17
Figure 8:- Nuclear Power & Solar Power Plant Installed by NTPC

Figure 9 :- Empowering women by providing training for self employment

National Thermal Power Corporation (NTPC)
18
1.5.2 The Mission – Excellence in NTPC Kahalgaon
“Develop and provide reliable power, related products and at competitive prices,
integrating multiple energy sources with innovative and eco-friendly technologies and
contribute to society.”
1.5.3 Statement of Values
NTPC believes that any business conduct can be ethical only when it rests on the nine cores
Values of Honesty, Integrity, Respect, Fairness, Purposefulness, Trust, Responsibility,
Citizenship and Caring. These values are not to be lost sight of by anyone at NATIONAL
THERMAL POWER CORPORATION (NTPC) Kahalgaon. Under any circumstances
irrespective of the goals that are intended to be achieved.
To them, means are as important as the ends.
1.5.4 Background
NTPC, formerly known as National Thermal Power Corporation , with a market cap of more
than $3 billion, was incorporated in 1929 and ranks amongst top performing Indian private
sector companies in the country. The company operates in three business segments:
Kahalgaon, Engineering, Procurement and Contracts (EPC) and Power. The company is the
largest private sector Kahalgaon developer on ownership basis and is having presence in all
high growth sectors viz; Roads, Railways, Sea Link, Cement and Airports. The company is
having 11 roads projects worth `120 billion under its portfolio Further, it is also having 3
Metro projects worth `170 billion, 1 sea link project of `46 billion, 2 cement projects in
Maharashtra and Madhya Pradesh worth `47 billion and 5 airports projects worth `5 billion.
NTPC Kahalgaon has also emerged as the leading player in India in the Engineering,
Procurement and Construction (EPC) segment of the power sector. NTPC is having a healthy
EPC order book of `212 billion spread across power, Roads and Transmission projects. In
addition to this, NTPC has also emerged as the largest private sector player in the utility
sector. Currently, it is having power generation capacity of 2340 MW and 37,000 MW
through NTPC Power. Under its Transmission segment, NTPC is having 5 projects worth `66
billion.
National Thermal Power Corporation (NTPC)
19
NTPC also owns 38% stake in NTPC Power (Thermal Power) with an aggregate investment
of `17.2 billion. R Power is likely to develop all future power generation assets in India and
overseas with having 600 MW of operational capacity and over 20,000 MW under execution.
Further, the company is targeting 5,000 MW of operating capacity by 2012. R Power is also
having largest coal resources of 4 billion tones.
1.5.5 SUBSIDIARY & ASSOCIATE COMPANIES
 NTPC Electric Supply Company Ltd.
 NTPC Vidyut Vyapar Nigam Ltd.
 Kanti Bijlee Utpadan Nigam Ltd.
 Bhartiya Rail Bijlee Company Ltd.
 Patratu Vidyut Utpadan Nigam Ltd.
 NTPC-SAIL Power Co. Pvt. Ltd
 Tamil Nadu Energy Co. Ltd.
 Aravali Power Co. Pvt. Ltd
 Mega Urja Nigam Pvt. Ltd.
1.6 BUSINESS PROFILE
1.6.1 Generation:
As the integrated power utility NTPC Kahalgaon has setup; a full-fledged generation division
having proven expertise in designing, engineering, erection, installation, commissioning,
operations and maintenance of power projects. The division implements project plans for in
house power projects and supports ventures undertaken by other affiliate companies. The
division is fully integrated and has in house capabilities to address every aspect of power
projects including:
 Mechanical
 Civil
 Electrical
 Instrumentation
 Environmental
National Thermal Power Corporation (NTPC)
20
The division also provides engineering consultancy to external agencies and projects
The 39102 MW Generation capacity of the Division comes from five projects:
• NTPC Kahalgaon - the 2340 MW multi fuel based thermal power station at Kahalgaon near
Bhagalpur, Bihar
• 8 MW Wind Farm Project at Jogimatti in the district of Chitradurga in Karnataka.
• BSES Kerala Limited: The 165 MW combined cycle power station at Kochi, Kerala.
• BSES Andhra Power Limited: The 220 MW combined cycle power plant at Samalkot in
Andhra Pradesh.
• Goa Power Station: The 48 MW naphtha based combined cycle power plant at Goa
NTPC (National Thermal Power Corporation) distributes more than 36 billion units of
electricity to over 30 million consumers across different parts of the country including
Mumbai and Delhi in an area that spans over 1, 24,300 sq. kms. It also generates 941 MW of
electricity, from its power stations located in Maharashtra, Andhra Pradesh, Kerala,
Karnataka and Goa. NTPC Kahalgaon has emerged as the leading player in India in the
Engineering, Procurement and Construction (EPC) segment of the power sector.
In the last few years, NTPC Kahalgaon has expanded its foot-print much beyond the power
sector. Currently, NTPC Kahalgaon group is engaged in the implementation of projects not
only in the fields of generation, transmission, distribution and trading of power but also in
other key infrastructural areas such as highways, roads, bridges, metro rail and other mass
rapid transit systems, special economic zones, real estate, airports, semen.
1.6.2 Distribution:
Distribution is the key to efficient and reliable power supply. Seven decades of experience
and continuous investment in modernizing its distribution Kahalgaon have helped the
company achieve the enviable distinction of operating its network with 99.93% reliability!
The efforts made towards achieving higher levels of efficiency have reduced distribution
losses to 12.01% - The lowest in the country!
National Thermal Power Corporation (NTPC)
21
NTPC Energy Limited's Kahalgaon operations cover a population of 5000 within an area of
about 384 sq. kilometers .NTPC Kahalgaon continually upgrades its distribution network.
This is accomplished through a process of decentralized operation in supply management to
maintain very high on-line reliability.
1.7. CRITICAL ASSESSMENT AND EVALUATION OF THE ORGANIZATION
(SWOT ANALYSIS)
Strengths:-
1. Good corporate image.
2. Complete range of product for transmission & distribution.
3. Established brand name with executive oriented program.
4. Strong & wide network of manpower across India.
Weakness:-
1. The procurement process in the companies is cumbersome and subject to auditing.
2. Low exposure to the needs & dynamics of distribution business.
3. Role clarity on the requirement of being an equipment supplier or a solution provider.
As there are very few supplier of equipment manufacturing plant.
Opportunities:-
1. Huge Investment leading to greater demand of goods and services.
2. Demand leading to Industry operating at full & over capacity.
3. Better price realization.
4. Early birds to lean faster and thus achieve repeat order. Policy to bid from ultra mega
power plant.
5. Vertical integration for supply chain management of coal by acquiring coal blogs.
Threats:-
1. Purchases preference may be extended to distribution sector.
2. Increase in number of small contractor leading to price war.
3. Emergence of competitors in the market like Schneider, Reliance, Tata etc.
National Thermal Power Corporation (NTPC)
22
4. Change in government policies for open trading or energy treading.
5. Reduce the time lag.
National Thermal Power Corporation (NTPC)
Department of Business Administration, TMBU, Academic year: 2016-18
SUGGESTION AND RECOMMENDATION TO THE ORGANIZATION
The performance of company is very weak in financial manner, Earning Per Share, ROA,
ROE, ROCE is reducing per year. It shows weak performance of the company
The Employee turnover is quite high. Many productive man hours are wasted in order to get
the new employee get accustomed to the working environment of the organization. The
company can look at the root cause of this issue and try to reduce their employee turnover.
No doubt, that retaining the talent is not an easy task for the private companies but a little
appreciation and remuneration can really boost the morale of the employees. With the rapid
change in the business environment and to keep its position in the sector, NTPC Kahalgaon
Limited should focus on these key success factors: -
Ensure optimum utilization of resources to enhance Return on Assets.
Make ensure higher rate of Return On Equity which motivate the investors.
EPS reduce year by year so company has to focus on reduction of cost that may be
increase in EPS.
Price to Book Ratio also reduce every year so, company make ensure market price
stable or increasing position by increasing DPS.
Organizational transformation for meeting the challenges due to changed
environment.
Wrestling growth opportunities in power sector business.
1.8. COMPETITORS
There are many power generation companies in India but some major competitors of NTPC
Kahalgaon in power generation sector are:
ESSAR Power ltd
Kirloskar Electric Company
Tata Power
Jaiprakash Hydro Power ltd
Some major players in power distribution sector are:
Brihanmumbai electricity supply & transport
Calcutta electricity supply corporation
Damodar valley corporation
Karnataka power corporation ltd
Torrent power
National Thermal Power Corporation (NTPC)
Department of Business Administration, TMBU, Academic year: 2016-18
Some major players in Kahalgaon sector are:
L&T Ltd
Punj Lloyd
LANCO INDIA
GMR Kahalgaon
Maytas Infra Limited
National Thermal Power Corporation (NTPC)
25
CHAPTER—II
RESEARCH METHODOLOGY & RELEVANCE OF THE PROJECT
2.1 RESEARCH METHODOLOGY
The previous chapter discussed the objectives of this study and in this chapter we will discuss
about the research methodology which is followed to carry out this project i.e. the universe, locale
of our study, Data Collection, data analysis and field experience.
As in organizations like NTPC, finance department is a large department, a thorough study of its
Financial Statement Analysis has been done broadly covering: Receivables Management, Cash
Management, and Inventory Management.
Universe of study: The universe of the study is Thermal power sector.
Locale of study: Locale of study is NTPC Kahalgaon ltd EPC division which mainly deals in
power sector projects.
Data collection:
The secondary data used is collected from the articles on Financial Analysis published in
magazines and from the various papers by Ernst and Young and Price Water House
Coopers & Websites also.
The secondary data is collected from the employees working in NTPC finance department.
An Interview was conducted with number of people working in Finance Department
particularly in Accounts and tax department.
Analysis of Data
The study is qualitative in nature and not much primary data is there. So no analytical tools have
been used in the preparation. The report has been prepared after doing a qualitative analysis of the
data collected. Some bar charts, graphs and pie charts are used to make the data more
understandable to the reader.
Field Experience
The research was a positive and enriching experience as it provided useful insights about the
current practices in Debt and Assets management and the process through which it is handled in
the real world. Besides this, there was immense learning about other facets of the organization and
corporate world as a whole.
Limitations
The study and analysis is based on the figures available in the annual report of the organization
published. Only some figures which are used by different departments will be made available as
they are confidential and cannot be provided by the organization. The availability of time was
limited for the analysis of the huge power project.
National Thermal Power Corporation (NTPC)
26
2.2. Ratio Analysis:-
A ratio analysis is a quantitative analysis of information contained in a company’s financial
statements. Ratio analysis is based on line items in financial statements like the balance sheet,
income statement and cash flow statement; the ratios of one item – or a combination of items
- to another item or combination are then calculated. Ratio analysis is used to evaluate
various aspects of a company’s operating and financial performance such as its efficiency,
liquidity, profitability and solvency. The trend of these ratios over time is studied to check
whether they are improving or deteriorating. Ratios are also compared across different
companies in the same sector to see how they stack up, and to get an idea of comparative
valuations. Ratio analysis is a cornerstone of fundamental analysis.
While there are numerous financial ratios, most investors are familiar with a few key ratios,
particularly the ones that are relatively easy to calculate. Some of these ratios include the
current ratio, return on equity, the debt-equity ratio, the dividend payout ratio and the
price/earnings (P/E) ratio.
For a specific ratio, most companies have values that fall within a certain range. A company
whose ratio falls outside the range may be regarded as grossly undervalued or overvalued,
depending on the ratio.
For example, if the average P/E ratio of all companies in the S&P 500 index is 20, with the
majority of companies having a P/E between 15 and 25, a stock with a single-digit P/E would
be considered undervalued, while one with a P/E of 50 would be considered overvalued. Of
course, this ratio would typically only be considered as a starting point, with further analysis
required to identify if these stocks are really as undervalued or overvalued as the P/E ratios
suggest.
As well, ratios are usually only comparable across companies in the same sector, since an
acceptable ratio in one industry may be regarded as too high in another. For example,
companies in sectors such as utilities typically have a high debt-equity ratio, but a similar
ratio for a technology company may be regarded as unsustainably high.
Ratio analysis can provide an early warning of a potential improvement or deterioration in a
company’s financial situation or performance. Analysts engage in extensive number-
crunching of the financial data in a company’s quarterly financial reports for any such hints.
National Thermal Power Corporation (NTPC)
27
Successful companies generally have solid ratios in all areas, and any hints of weakness in
one area may spark a significant sell-off in the stock. Certain ratios are closely scrutinized
because of their relevance to a certain sector, as for instance inventory turnover for the retail
sector and days sales outstanding (DSOs) for technology companies.
2.3 OBJECTIVE
To study of financial statement of NTPC at NTPC Kahalgaon. which includes
 Net income / equity = return on equity (ROE)
 Net income / total assets = return on assets (ROA)
 Stock price / earnings per share = P/E ratio
The aim is to learn how to manage capital needs of the organization and to learn the different
ways through which theoretical learning is applied practically in the organization. The
project is aimed to learn and gain knowledge of the day to day working of the organization as
to how does the different decision are taken and on what basis. The project will help in
gaining the knowledge of different steps of raising the funds and their effective utilization to
ensure adequate availability of funds. The various analysis will help the management to
assess the performance, financial strength and weakness of the company.
2.4. SIGNIFICANCE OF THE PROJECT
Financial Analysis is the process of identifying the financial strengths and weaknesses of the
firm by properly establishing relationships between the items of the balance sheet and the
profit & loss account. Financial analysis can be undertaken by management of the firm, viz.
Owners, creditors, investors and others. Ratio analysis is a powerful tool of financial
analysis. A ratio is defined as “the indicated quotient of two mathematical expressions” and
as “the Relationship between two or more things”.
Ratios help to summaries large quantities of financial data and to make qualitative judgment
about the firm’s financial performance.
National Thermal Power Corporation (NTPC)
28
2.5 CONCEPTUALIZATION
Ratio Analysis is a form of Financial Statement Analysis that is used to obtain a quick
indication of a firm's financial performance in several key areas. The ratios are categorized as
Short-term Solvency Ratios, Debt Management Ratios, Asset Management Ratios,
Profitability Ratios, and Market Value Ratios.
Ratio Analysis as a tool possesses several important features. The data, which are provided
by financial statements, are readily available. The computation of ratios facilitates the
comparison of firms which differ in size. Ratios can be used to compare a firm's financial
performance with industry averages. In addition, ratios can be used in a form of trend
analysis to identify areas where performance has improved or deteriorated over time.
Because Ratio Analysis is based upon Accounting information, its effectiveness is limited by
the distortions which arise in financial statements due to such things as Historical Cost
Accounting and inflation. Therefore, Ratio Analysis should only be used as a first step in
financial analysis, to obtain a quick indication of a firm's performance and to identify areas
which need to be investigated further.
The pages below present the most widely used ratios in each of the categories given above.
Please keep in mind that there is not universal agreement as to how many of these ratios
should be calculated. You may find that different books use slightly different formulas for the
computation of many ratios. Therefore, if you are comparing a ratio that you calculated with
a published ratio or an industry average, make sure that you use the same formula as used in
the calculation of the published ratio.
Concepts
 Short-term Solvency Ratios
 Debt Management Ratios
 Asset Management Ratios
 Profitability Ratios
 Market Value Ratios
 Equations


National Thermal Power Corporation (NTPC)
29
CHAPTER-III
FINANCIAL ANALYSIS
3.1 INTRODUCTION TO FINANCIAL ANALYSIS
Financial analysis is the process of evaluating businesses, projects, budgets and other
finance-related entities to determine their performance and suitability. Typically, financial
analysis is used to analyze whether an entity is stable, solvent, liquid or profitable enough to
warrant a monetary investment. When looking at a specific company, a financial analyst
conducts analysis by focusing on the income statement, balance sheet and cash flow
statement.
Financial analysis is used to evaluate economic trends, set financial policy, build long-term
plans for business activity, and identify projects or companies for investment. This is done
through the synthesis of financial numbers and data.
One of the most common ways to analyze financial data is to calculate ratios from the data to
compare against those of other companies or against the company's own historical
performance. For example, return on assets (ROA) is a common ratio used to determine how
efficient a company is at using its assets and as a measure of profitability. This ratio could be
calculated for several similar companies and compared as part of a larger analysis.
Operational and financial Ratios:-
1. Earning Per Share Ratio:-
Earnings per share (EPS) is the portion of a company's profit allocated to each outstanding
share of common stock. Earnings per share serves as an indicator of a company's
profitability.
Calculated as:
Earnings Per Share (EPS)
When calculating, it is more accurate to use a weighted average number of shares outstanding
over the reporting term, because the number of shares outstanding can change over time.
National Thermal Power Corporation (NTPC)
30
However, data sources sometimes simplify the calculation by using the number of shares
outstanding at the end of the period.
Diluted EPS expands on basic EPS by including the shares of convertibles or warrants
outstanding in the outstanding shares number.
Earnings per share is generally considered to be the single most important variable in
determining a share's price. It is also a major component used to calculate the price-to-
earnings valuation ratio.
Dividend Per Share - DPS
Dividend per share (DPS) is the sum of declared dividends issued by a company for
every ordinary share outstanding. Dividend per share (DPS) is the total dividends paid
out by a business, including interim dividends, divided by the number of
outstanding ordinary shares issued. A company's DPS is usually derived using the
dividend paid in the most recent quarter, which is also used to calculate the dividend
yield. DPS can be calculated by using the following formula:
D - Sum of dividends over a period (usually 1 year)
SD - Special, one time dividends
S - Shares outstanding for the period
Dividends over the entire year, not including any special dividends, must be added
together for a proper calculation of DPS, including interim dividends. Special
dividends are dividends which are only expected to be issued once and are not
included. Interim dividends are dividends distributed to shareholders that have been
declared and paid before a company has determined its annual earnings.
National Thermal Power Corporation (NTPC)
31
Figure 10- Comparison of EPS & DPS
PERFORMANCE RATIO:-
 Return On Assets - ROA
Return on assets (ROA) is an indicator of how profitable a company is relative to its total
assets. ROA gives an idea as to how efficient management is at using its assets to
generate earnings. Calculated by dividing a company's annual earnings by its total assets,
ROA is displayed as a percentage. Sometimes this is referred to as "return on
investment".
The formula for return on assets is:
Note: Some investors add interest expense back into net income when performing this
calculation because they'd like to use operating returns before cost of borrowing.
 Return On Equity - ROE
0
2
4
6
8
10
12
14
16
18
2011-12 2012-13 2013-14 2014-15 2015-16
EPS
DPS
National Thermal Power Corporation (NTPC)
32
Return on equity (ROE) is the amount of net income returned as a percentage
of shareholders equity. Return on equity measures a corporation's profitability by
revealing how much profit a company generates with the money shareholders have
invested.
ROE is expressed as a percentage and calculated as:
Return on Equity = Net Income/Shareholder's Equity
Net income is for the full fiscal year (before dividends paid to common stock holders but
after dividends to preferred stock.) Shareholder's equity does not include preferred shares.
Also known as "return on net worth" (RONW).
Looking for stocks with the highest return on equity? Find out which online broker is best
for you by reading Investopedia's reviews.
The ROE is useful for comparing the profitability of a company to that of other firms in
the same industry.
There are several variations on the formula that investors may use:
1. Investors wishing to see the return on common equity may modify the formula above
by subtracting preferred dividends from net income and subtracting preferred equity from
shareholders' equity, giving the following: return on common equity (ROCE) = net
income - preferred dividends / common equity.
2. Return on equity may also be calculated by dividing net income
by average shareholders' equity. Average shareholders' equity is calculated by adding the
shareholders' equity at the beginning of a period to the shareholders' equity at period's end
and dividing the result by two.
3. Investors may also calculate the change in ROE for a period by first using the
shareholders' equity figure from the beginning of a period as a denominator to determine
the beginning ROE. Then, the end-of-period shareholders' equity can be used as the
National Thermal Power Corporation (NTPC)
33
denominator to determine the ending ROE. Calculating both beginning and ending ROEs
allows an investor to determine the change in profitability over the period.
Things to Remember
 If new shares are issued then use the weighted average of the number of shares
throughout the year.
 For high growth companies you should expect a higher ROE.
 Averaging ROE over the past 5 to 10 years can give you a better idea of the
historical growth.
 Return On Capital Employed (ROCE)
Return on capital employed (ROCE) is a financial ratio that measures a company's
profitability and the efficiency with which its capital is employed. ROCE is calculated as:
ROCE = Earnings Before Interest and Tax (EBIT) / Capital Employed
“Capital Employed” as shown in the denominator is the sum of shareholders' equity and debt
liabilities; it can be simplified as (Total Assets – Current Liabilities). Instead of using capital
employed at an arbitrary point in time, analysts and investors often calculate ROCE based on
“Average Capital Employed,” which takes the average of opening and closing capital
employed for the time period.
A higher ROCE indicates more efficient use of capital. ROCE should be higher than the
company’s capital cost; otherwise it indicates that the company is not employing its capital
effectively and is not generating shareholder value.
BREAKING DOWN 'Return On Capital Employed (ROCE)'
ROCE is a useful metric for comparing profitability across companies based on the amount
of capital they use. Consider two companies, Alpha and Beta, which operate in the same
industry sector. Alpha has EBIT of $5 million on sales of $100 million in a given year,
while Beta has EBIT of $7.5 million on sales of $100 million in the same year. On the face, it
may appear that Beta should be the superior investment, since it has an EBIT margin of 7.5%
compared with 5% for Alpha. But before making an investment decision, look at the capital
employed by both companies. Let’s assume that Alpha has total capital of $25 million and
Beta has total capital of $50 million. In this case, Alpha’s ROCE of 20% is superior
National Thermal Power Corporation (NTPC)
34
to Beta’s ROCE of 15%, which means that Alpha does a better job of deploying its capital
than Beta.
ROCE is especially useful when comparing the performance of companies in capital-
intensive sectors such as utilities and telecoms. This is because unlike return on
equity (ROE), which only analyzes profitability related to a company’s common equity,
ROCE considers debt and other liabilities as well. This provides a better indication
of financial performance for companies with significant debt.
Adjustments may sometimes be required to get a truer depiction of ROCE. A company may
occasionally have an inordinate amount of cash on hand, but since such cash is not actively
employed in the business, it may need to be subtracted from the “Capital Employed” figure to
get a more accurate measure of ROCE.
For a company, the ROCE trend over the years is also an important indicator of performance.
In general, investors tend to favor companies with stable and rising ROCE numbers over
companies where ROCE is volatile and bounces around from one year to the next.
Figure 11- Comparison of ROA, ROE and ROCE
 Price-Earnings Ratio - P/E Ratio:-
The price-earnings ratio (P/E ratio) is the ratio for valuing a company that measures its
current share price relative to its per-share earnings. The price-earnings ratio is also
sometimes known as the price multiple or the earnings multiple.
0
2
4
6
8
10
12
14
16
18
2011-12 2012-13 2013-14 2014-15 2015-16
ROA
ROE
ROCE
National Thermal Power Corporation (NTPC)
35
The P/E ratio can be calculated as:
Price-Earnings Ratio = Market Value per Share / Earnings per Share
EPS is most often derived from the last four quarters. This form of the price-earnings ratio is
called trailing P/E, which may be calculated by subtracting a company’s share value at the
beginning of the 12-month period from its value at the period’s end, adjusting for stock
splits if there have been any. Sometimes, price-earnings can also be taken from analysts’
estimates of earnings expected during the next four quarters. This form of price-earnings is
also called projected or forward P/E. A third, less common variation uses the sum of the last
two actual quarters and the estimates of the next two quarters.
 VALUATION RATIOS:-
 Personal Consumption Expenditures - PCE
Personal consumption expenditures (PCE), or the PCE Index, measure price
changes of consumer goods and services. Expenditures noted on the index include actual
expenditures and expenditures that are attributed to households in the United States; data
that pertains to services, durables and non-durables is measured through the index.
Sharing similarities with the Consumer Price Index (CPI), the PCE is part of the personal
income report issued by the Bureau of Economic Analysis of the Department of
Commerce.
BREAKING DOWN 'Personal Consumption Expenditures - PCE'
The PCE is often considered predictable, and many analysts prefer to utilize the CPI
because of its widely touted ability to aid in determining economic stability or lack
thereof, due largely to the fixed basket of goods used.
Inflation
In the matter of gauging inflation, and the overall economic stability of the U.S., the
Federal Reserve prefers not to lean on the go-to barometer of economic health. Because
the CPI is the most well-known economic indicator, the PCE is largely forgotten. The
Fed, however, prefers the PCE index when reviewing economic conditions and charting a
course of action that impacts inflation and employment.
The main reason for this is the range of expenditures included in the PCE. While the CPI
helps clearly depict shifts or changes in consumer expenditures, it only reveals changes in
National Thermal Power Corporation (NTPC)
36
those expenditures that fall within the pre-established fixed basket. The PCE, on the other
hand, includes a great variety of expenses in homes across the country.
The PCE is also weighted by data acquired through business surveys, which tend to be
more reliable than the consumer surveys utilized by the CPI.
Also, the PCE makes use of a formula that allows for changes in consumer behavior,
changes occurring in the short term, an adjustment for which the regulation CPI formula
doesn’t make room. These factors, combined, result in a more comprehensive inflation
metric; the Fed depends upon the nuances the PCE reveals, because even a small amount
of inflation is regarded as an indication of a growing and healthy economy.
Durables vs Non-Durables
The PCE is broken down into two large categories: goods and services. The major
component of these two – goods – is then further broken down into durables and non-
durables. Durable goods are items that last a household more than three years and
typically carry larger price tags. Examples include cars, televisions, refrigerators,
furniture and other similar items. Non-durable goods are labeled ‘transitory,’ meaning
their life expectancy is typically not more than three years. These items are also generally
much less costly and include products such as makeup, gasoline and clothing.
 Price-To-Book Ratio - P/B Ratio
The price-to-book ratio (P/B Ratio) is a ratio used to compare a stock's market value to
its book value. It is calculated by dividing the current closing price of the stock by the
latest quarter's book value per share.
Also known as the "price-equity ratio".
Calculated as:
P/B Ratio = Market Price per Share / Book Value per Share
where Book Value per Share = (Total Assets - Total Liabilities) / Number of shares
outstanding
National Thermal Power Corporation (NTPC)
37
A lower P/B ratio could mean that the stock is undervalued. However, it could also mean
that something is fundamentally wrong with the company. As with most ratios, be aware
that this varies by industry.
This ratio also gives some idea of whether you're paying too much for what would be left
if the company went bankrupt immediately.
For more, check out Digging Into Book Value
BREAKING DOWN 'Price-To-Book Ratio - P/B Ratio
The P/B ratio reflects the value that market participants attach to a company's equity
relative to its book value of equity. A stock's market value is a forward-looking metric
that reflects a company's future cash flows. The book value of equity is an accounting
measure that is based on the historic cost principle, and reflects past issuances of equity,
augmented by any profits or losses, and reduced by dividends and share buybacks.
The Differences between the Market and Book Value of Equity
Due to accounting conventions on treatment of certain costs, the market value of equity is
typically higher than the book value of a company, producing a P/B ratio above 1. Under
certain circumstances of financial distress, bankruptcy or expected plunges in earnings
power, a company's P/B ratio can dive below 1. Because accounting principles do not
recognize brand value and other intangible assets, unless they are derived through
acquisitions, all costs associated with creating intangible assets are expensed
immediately. For example, research and development (R&D) costs must be expensed,
reducing a company's book value. However, these R&D outlays can create unique
production processes for a company, or result in patents that can bring royalty revenues
going forward. While accounting principles favor a conservative approach in capitalizing
costs, market participants may raise the stock price as a result of such R&D efforts,
resulting in wide differences between the market and book values of equity.
Advantages and Disadvantages to the P/B Ratio
Investors find the P/B ratio useful because the book value of equity provides a relatively
stable and intuitive metric that can be easily compared to the market price. Also, the P/B
National Thermal Power Corporation (NTPC)
38
ratio can be used for firms with positive book values and negative earnings since negative
earnings render price-to-earnings ratios useless, and there are fewer companies with
negative book values than companies with negative earnings. However, when accounting
standards applied by firms vary, P/B ratios may not be comparable, especially for
companies from different countries. Also, P/B ratios can be less useful for services and
information technology companies with little tangible assets on their balance sheets.
Finally, the book value can become negative as a result of a long series of negative
earnings, making the P/B ratio useless for relative valuation purposes.
 Yield :-
The yield is the income return on an investment, such as the interest or dividends received
from holding a particular security. The yield is usually expressed as an annual percentage
rate based on the investment's cost, current market value or face value. Yields may be
considered known or anticipated depending on the security in question as certain
securities may experience fluctuations in value.
BREAKING DOWN 'Yield'
The yield of an investment is tied to the risk associated with the aforementioned
investment. The higher the risk is considered to be, the higher the associated yield
potential. Except in the most secure investments, such as zero coupon bonds, a yield is
not a guarantee. Instead, the listed yield is functionally an estimate of the future
performance of the investment. Generally, the risks associated with stocks are considered
higher than those associated with bonds. This can lead stocks to have a higher yield
potential when compared to many bonds currently on the market.
Stock Yields
In regards to a stock, there are two stock dividend yields. If you buy a stock for $30 (cost
basis) and its current price and annual dividend are $33 and $1, respectively, the cost
yield will be 3.3% ($1/$30) and the current yield will be 3% ($1/$33).
Bond Yields
Bonds have multiple yield options depending on the exact nature of the investment.
The coupon is the bond interest rate fixed at issuance. The current yield is the bond
interest rate as a percentage of the current price of the bond. The yield to maturity is an
National Thermal Power Corporation (NTPC)
39
estimate of what an investor will receive if the bond is held to its maturity date. Non-
taxable municipal bondswill also have a tax-equivalent (TE) yield determined by the
investor's tax bracket.
Mutual Fund Yields
Mutual funds have two primary forms of yields for consideration. The dividend yields are
expressed as an annual percentage measure of the income that was earned by the
fund's portfolio. The associated income is derived from the dividends and interest
generated by the included investments. Additionally, dividend yields are based on the net
income received after the fund's associated expenses have been paid, or at a minimum,
accounted for.
The SEC yield is based on the yields reported by particular companies as required by the
Securities and Exchange Commission (SEC) and is based on an assumption that all
associated securities are held until maturity. Additionally, the assumption exists that all
income generated is reinvested. Like dividend yields, SEC yields also account for the
presence of required fees associated with the fund, and allocates funds to them
accordingly before determining the actual yield.
 Enterprise-Value-To-Sales - EV/Sales
Enterprise-value-to-sales is a valuation measure that compares the enterprise value (EV)
of a company to the company's sales. EV-to-sales gives investors a quantifiable metric of
how much it costs to purchase the company's sales. This measure is an expansion of the
price-to-sales (P/S) valuation, which uses market capitalization instead of enterprise
value.
BREAKING DOWN 'Enterprise-Value-To-Sales - EV/Sales'
EV-to-sales is perceived to be more accurate than P/S because market capitalization does
not take a company's debt into account as well as enterprise value, and the debt needs to
be paid back at some point. Generally, a lower the EV-to-sales means that a company is
believed to be more attractive or undervalued. The EV-to-sales measure can be negative
when the cash in the company is greater than the market capitalization and debt structure,
signaling that the company can essentially be bought with its own cash.
National Thermal Power Corporation (NTPC)
40
The EV-to-sales measure can be slightly deceptive. A high EV-to-sales can be a sign that
investors believe the future sales will greatly increase. A lower EV-to-sales can signal
that the future sales prospects are not very attractive. Compare the EV-to-sales to that of
other companies in the industry, and look deeper into the company you are analyzing.
EV-to-sales values usually are between 1 and 3.
Enterprise-Value-To-Sales Calculation and Example:-
The calculation of EV-to-sales is simply the enterprise value of the company divided by
its sales. The enterprise value of a company is calculated using the following simplified
formula:
As an example, assume a company reports sales for the year of 70 million. The company
has 10 million of short-term liabilities on the books and 25 million of long-term
liabilities. It has 90 million worth of assets, of which 20% is cash. Lastly, the company
has 5 million shares of common stock outstanding and the current price of the stock is
RS.25 per share. Using this scenario, the company's enterprise value is:
EV = (5,000,000 x 25) + (10,000,000 + 25,000,000) - (90,000,000 x 0.2) = 125,000,000 +
35,000,000 - 18,000,000 = 142,000,000
Next, to find the EV-to-sales, simply take the EV and divided by sales. In this example,
the EV-to-sales is:
EV-to-sales = 142,000,000 / 70,000,000 = 2.03
A slightly more complicated version of enterprise value with a few more variables is
sometimes used. The more complicated version's formula is:
EV = market capitalization + debt + preferred shared capital + minority interest - cash -
cash equivalents
 Enterprise value/EBITDA
National Thermal Power Corporation (NTPC)
41
Enterprise value/EBITDA (more commonly referred to by the acronym EV/EBITDA) is a
popular valuation multiple used in the finance industry to measure the value of a company. It
is the most widely used valuation multiple based on enterprise value and is often used in
conjunction with, or as an alternative to, the P/E ratio (Price/Earnings ratio) to determine
the fair market value of a company.
An advantage of this multiple is that it is capital structure-neutral, and, therefore, this
multiple can be used to directly compare companies with different levels of debt.[1]
The EV/EBITDA multiple requires prudent use for companies with low profit margins (i.e.,
for an EBITDA estimate to be reasonably accurate, the company under evaluation must have
legitimate profitability).
Often, an industry average EV/EBITDA multiple is calculated on a sample
of listed companies to use for comparison to the company of interest (i.e., as a benchmark).
An example of such an index is one that provides an average EV/EBITDA multiple on a wide
sample of transactions on private companies in the Eurozone.[2]
The reciprocate multiple EBITDA/EV is used as a measure of cash return on investment.
 EBIT/EV Multiple
The EBIT/EV multiple is a financial ratio used to measure a company's return on
investment. While the EBIT/EV ratio is not very commonly used, it does have certain
advantages in comparing companies. First, using EBIT as a measure of profitability
eliminates the potential distorting effects of differences in tax rates. Secondly, using
EBIT/EV normalizes for the effects of different capital structures.
BREAKING DOWN 'EBIT/EV Multiple'
The EBIT/EV ratio can provide a better comparison than a more conventional net
income/equity ratio. A downside to this ratio is that it does not normalize for depreciation
and amortization costs. Thus, there are still potential distorting effects when companies
use differing methods in accounting for fixed assets.
 Enterprise Value (EV)
Enterprise Value, or EV for short, is a measure of a company's total value, often used as a
more comprehensive alternative to equity market capitalization. The market capitalization
National Thermal Power Corporation (NTPC)
42
of a company is simply its share price multiplied by the number of shares a company has
outstanding. Enterprise value is calculated as the market capitalization plus debt, minority
interest and preferred shares, minus total cash and cash equivalents. Often times,
the minority interest and preferred equity is effectively zero, although this need not be the
case.
 EV = market value of common stock + market value of preferred equity + market
value of debt + minority interest - cash and investments.
 Capital Employed:-
Capital employed, also known as funds employed, is the total amount of capital used for
the acquisition of profits. It is the value of all the assets employed in a business and can
be calculated by adding fixed assets to working capital or subtracting current
liabilities from total assets. By employing capital, you make an investment.
BREAKING DOWN 'Capital Employed'
Capital employed is a frequently used term but is very difficult to define because there are
so many contexts in which it can be used. All definitions generally refer to the investment
required for a business to function. It refers to the value of assets used in the operation of
a business. Put simply, it is a measure of the value of assets minus current liabilities. Both
of these measures can be found on the balance sheet. A current liability is the portion of
debt that must be paid back within one year. In this way, capital employed is a more
accurate estimate of total assets. Like return on assets, investors use return on capital
employed to get an approximation for what their return might be in the future.
National Thermal Power Corporation (NTPC)
43
Figure 12- Enterprise Value – Capital Employed Ratio
0
0.2
0.4
0.6
0.8
1
1.2
2011-12 2012-13 2013-14 2014-15 2015-16
Enterprise Value/Capital Employed
Enterprise Value/Capital
Employed
National Thermal Power Corporation (NTPC)
44
RATIO ANALYSIS
Parameters MAR'16
(₹ Cr.)
MAR'15
(₹ Cr.)
MAR'14
(₹ Cr.)
MAR'13
(₹ Cr.)
MAR'12
(₹ Cr.)
Operational & Financial Ratios:
Earnings Per Share (Rs) 12.42 12.48 13.31 15.30 11.19
DPS(Rs) 3.35 2.50 5.75 5.75 4.00
Book NAV/Share(Rs) 107.67 99.03 104.08 97.49 87.22
Performance Ratios:
ROA(%) 4.79 5.27 6.15 7.88 6.53
ROE(%) 12.02 12.29 13.21 16.57 13.24
ROCE(%) 7.56 8.30 11.18 14.06 11.97
Valuation Parameters:
PER(x) 10.37 11.81 9.01 9.28 14.54
PCE(x) 6.78 7.99 6.54 7.31 11.17
Price / Book(x) 1.20 1.49 1.15 1.46 1.87
Yield(%) 2.60 1.70 4.79 4.05 2.46
EV / Net Sales(x) 2.79 2.68 2.12 2.43 2.74
EV / Core EBITDA(x) 10.49 10.69 7.40 7.89 10.06
EV / EBIT(x) 14.76 14.60 9.26 8.62 12.06
EV / CE(x) 0.88 0.96 0.82 0.93 1.14
M Cap / Sales 1.51 1.66 1.37 1.78 2.16
Growth Ratio:
Core Operating Income Growth 13.97 13.02 31.74 10.52 22.52
Operating Profit Growth 2.33 -10.96 1.82 19.91 5.66
Net Profit Growth -0.47 -6.23 -13.03 36.81 1.33
BVPS Growth 8.73 -4.85 6.75 11.77 6.65
Advances Growth 0.00 0.00 0.00 0.00 0.00
EPS Growth(%) -0.47 -6.23 -13.03 36.82 1.33
National Thermal Power Corporation (NTPC)
45
 Cash Flow:-
Cash flow is the net amount of cash and cash-equivalents moving into and out of a business.
Positive cash flow indicates that a company's liquid assets are increasing, enabling it to
settle debts, reinvest in its business, return money to shareholders, pay expenses and provide
a buffer against future financial challenges. Negative cash flow indicates that a company's
liquid assets are decreasing. Net cash flow is distinguished from net income, which
includes accounts receivable and other items for which payment has not actually been
received. Cash flow is used to assess the quality of a company's income, that is, how liquid it
is, which can indicate whether the company is positioned to remain solvent.
BREAKING DOWN 'Cash Flow'
The accrual accounting method allows companies to count their chickens before they hatch,
so to speak, by considering credit as part of a company's income. "Accounts receivable" and
"settlement due from customers" can appear as line items in the assets portion of a
company's balance sheet, but these items do not represent completed transactions, for which
payment has been received. They do not, therefore, count as cash. (Note that the credit vs.
cash distinction is not the same as it is in everyday terminology; proceeds from credit card
transactions are considered cash once they are transferred.)
The opposite can also be true. A company may be receiving massive inflows of cash, but
only because it is selling off its long-term assets. A company that is selling itself for parts
may be building up liquidity, but it is limiting its potential for growth in the long term, and
perhaps setting itself up to fail. In the same vein, a company may be taking in cash by
issuing bonds and taking on unsustainable levels of debt. For these reasons it is necessary to
view a company's cash flow statement, balance sheet and income statement together.
Cash Flow Statement
Often called the "statement of cash flows," the cash flow statement indicates whether a
company's income is languishing in the form of IOUs – not a sustainable situation in the long
term – or is translating into cash flow. Even very profitable companies, as measured by
their net incomes, can become insolvent if they do not have the cash and cash-equivalents to
settle short-term liabilities. If a company's profit is tied up in accounts receivable, prepaid
expenses and inventory, it may not have the liquidity to survive a downturn in its business or
National Thermal Power Corporation (NTPC)
46
a lawsuit. Cash flow determines the quality of a company's income; if net cash flow is less
than net income, that could be a cause for concern.
Cash flow statements are divided into three categories: operating cash flow, investing cash
flow and financing cash flow. Operating cash flows are those related to a company's
operations, that is, its day-to-day business. Investing cash flows relate to its investments in
businesses through acquisition; in long-term assets, such as towers for a telecom provider;
and in securities. Financing cash flows relate to a company's investors and
creditors: dividends paid to stockholders would be recorded here, as would cash proceeds
from issuing bonds.
Figure 13:- Cash Flow
.
-25000
-20000
-15000
-10000
-5000
0
5000
10000
15000
20000
2011-12 2012-13 2013-14 2014-15 2015-16
Opening cash
Cash flow from operating
activity
Cash flow from investing activity
Cash flow from financing activity
Closing Cash & equivalent
National Thermal Power Corporation (NTPC)
47
Cash Flow Statement
Parameters MAR'16
(₹ Cr.)
MAR'15
(₹ Cr.)
MAR'14
(₹ Cr.)
MAR'13
(₹ Cr.)
MAR'12
(₹ Cr.)
Net Profit Before Taxes 10,058.67 10,546.65 13,904.65 16,578.63 12,326.16
Adjustments for Expenses
& Provisions
8,657.47 6,374.52 4,675.71 2,409.25 1,663.06
Adjustments for Liabilities &
Assets
-2,876.89 -766.54 -291.92 -597.13 -2,207.08
Cash Flow from operating
activities
14,503.53 14,234.70 15,732.18 15,495.17 10,709.85
Cash Flow from investing
activities
-
18,422.65
-
14,562.60
-
13,979.71
-
14,016.89
-7,880.54
Cash Flow from financing
activities
-4,436.38 -1,878.08 -3,308.99 -752.41 -2,869.08
Effect of exchange
fluctuation on translation
reserve
0.00 0.00 0.00 0.00 0.00
-8,355.50 -2,205.98 -1,556.52 725.87 -39.77
Opening Cash & Cash
Equivalents
13,105.41 15,311.37 16,867.70 16,141.83 16,181.60
Cash & Cash Equivalent on
Amalgamation / Take over /
Merger
0.00 0.00 0.00 0.00 0.00
Cash & Cash Equivalent of
Subsidiaries under
liquidations
0.00 0.00 0.00 0.00 0.00
Translation adjustment on
reserves / op cash balalces
frgn subsidiaries
0.00 0.00 0.00 0.00 0.00
Effect of Foreign Exchange
Fluctuations
0.08 0.02 0.19 0.00 0.00
Closing Cash & Cash
Equivalent
4,749.99 13,105.41 15,311.37 16,867.70 16,141.83
National Thermal Power Corporation (NTPC)
48
CHAPTER-IV
FACTS OF THE PROJECT & COMPARITIVE ANALYSIS
4.1 FACTS
In order to determine Financial position of NTPC on the front of procurement and utilization
of funds, we have accumulated data for the last five years and tried to analyze the going of
NTPC on various fronts of Financial. In this way, we’ll be able to better understand the
nature of change (if any) in the working capital situation of the organization.
So first we’ll look at various working capital ratios for the past five years and examine the
findings.
4.1.1 WORKING CAPITAL RATIO
The difference between current assets and current liabilities excluding short term bank
borrowing is called net working capital (NWC). Net Working Capital is sometimes used as a
measure of a firm’s liquidity.
Net Working Capital = Current Assets-Current Liabilities
Net Working Capital Ratio= Net Working Capital
Net Assets
Net working capital measures the firm’s potential reservoir of funds.
Analysis:
As it is shown in the graph, the following observations can be made:
 A company having a higher NWC ratio has a greater ability to meet its current
obligations. From a conservative position of 2012 where the ratio was as high as 0.42,
it has now settled at 0.10 which is slightly on the lower side As this ratio represents a
firm’s potential reservoir of funds, a declining trend should be taken seriously and
 appropriate remedial measures need to be taken so as to avert a more troubled
situation
National Thermal Power Corporation (NTPC)
49
4.1.2 CURRENT RATIO
Current ratio is calculated by dividing current assets by current liabilities:
Current Ratio = Current Assets
Current Liabilities
Current assets include cash and those assets that can be converted into cash within a year,
such as marketable securities, debtors, inventories, loans and advances. All the obligations
maturing within a year are included in current liabilities.
Current liabilities include creditors, bills payable, accrued expenses, short term bank loan,
income tax liability and long-term debt maturing in the current year.
Significance
 It indicates the availability of current assets in rupees for every one rupee of current
liability. A ratio of greater than one means that the firm has more current assets than
current claims against them. In India, the conventional rule is to have a ratio of 1.33
(internationally it is 2).
 The current ratio represents the margin of safety for the creditors. The higher the
current ratio, the greater the margin of safety; the larger the amount of current assets
in relation to current liabilities, the more the firm’s ability to meet its current
obligations.
Analysis
For the year 2012, NTPC had a current ratio of 2.99 which got offset during the
subsequent years reaching as low as 0.95 in 2014.The situation got better in 2015 with a
ratio of 1.49 but again it has become critical with a ratio of 1.09 at the end of FY 2016.
A company with a falling current ratio needs to take strict actions otherwise in longer
run, the firm can found themselves in a difficult situation to clear their current
liabilities.
National Thermal Power Corporation (NTPC)
50
.
4.1.3 ACID RATIO TEST (Liquid/Quick Ratio)
This ratio establishes the relationship between quick or liquid assets and current liabilities.
Quick Ratio = Current Assets - Inventors
Current Liabilities
An asset is liquid if it can be converted into cash immediately without a loss of value. E.g.
Cash, Debtors, Bills receivable and marketable securities. Inventories are considered to be
less liquid as it requires time for realizing into cash, their value also has tendency to fluctuate.
Significance
Generally a quick ratio of 1:1 is considered to represent a satisfactory current financial
condition. This test is more significant as compare to current ratio to fulfill the firm’s
obligations.
NTPC has a quick ratio of 1.06 at the end of FY2016 which is consistent with the current
ratio for the same year. Generally a quick ratio of 1:1 is considered to represent a satisfactory
current financial situation, but it does not imply a sound financial position. It should be kept
in mind that all debtors may not be liquid, and cash may be immediately needed to pay
operating expenses. Thus a company with a high value of quick ratio can suffer from
shortage of funds if it has slow paying, doubtful and long duration outstanding debtors. On
other hand, a company with a low value of quick ratio may really be operating with
prosperity and paying its obligations in time if it has been turning over its inventories
efficiently.
4.1.4 CASH RATIO
It shows the relationship between absolute liquid or super quick current assets and liabilities.
Absolute liquid assets include cash, bank balances, and marketable securities. Since cash is
the most liquid asset, a financial analyst may examine cash ratio and its equivalent to current
liabilities. Trade investments or marketable securities are equivalent of cash; therefore, they
may be included in the computation of cash ratio.
Cash Ratio = Cash + Marketable Securities
Current Liabilities
National Thermal Power Corporation (NTPC)
51
The situation of 2012 is never recommended to have that much cash sitting idle with the
company. In the subsequent years the company has put the cash up to use by investing it in
different projects thus maintaining a cash ratio of 4-5%.
1) There is nothing to be worried about the lack of cash if the company has reserve
borrowing power. In India, firms have credit limits sanctioned from banks, and can
easily draw cash.
4.1.5 INVENTORY TURNOVER RATIO
Inventory turnover is calculated by dividing the cost of goods sold by the average inventory.
This ratio indicates the efficiency of the firm in producing and selling its product, by
indicating the number of times the inventory has been converted into sales during the period.
1. This ratio indicates the efficiency of the firm with which it manages and utilizes its
assets, the speed with which the assets are converted into sales. As is evident from the
graph, NTPC has managed to outperform its previous year performances consistently.
2. This comes out as a good sign of the efficiency of the management in converting its
assets into sales. The ratio also implies continuous improvement in the operations of
the company.
4.1.6 DEBTOR’S TURNOVER
A Firm sells goods for cash and credit. Credit is used as a marketing tool by a no. of
companies. When the firm extends credits to its customers, debtors (accounts receivables)
are created. Debtors are convertible into cash over a short period of time, therefore included
in the current assets.
Debtor’s turnover is found by dividing credit sales by average debtors. Average debtors are
nothing but the average of the opening and closing balances of debtors.
Average Debtor = Debtors at the beginning of the year + Debtors at the end of the year
2
Debtors Turnover = Net Sale
Average Debtors
Net credit sales consist of gross credit sales minus sales return.
When the information about credit sales, opening and closing balances of trade debtors is not
available then the ratio can be calculated by dividing total sales by closing balances of trade
debtors.
Debtors Turnover Ratio = Total sales
Trade Debtors
Significance:
National Thermal Power Corporation (NTPC)
52
Debtors Turnover indicates the number of times debtors turnover each year. Generally, the
higher the value of debtors turnover, the more efficient the management of the company.
Analysis:
1) As stated earlier, the higher the value of debtors turnover, the more efficient the
management of the company. But as it is evident from the graph that the ratio is
dipping with each successive year, it serves as a sign of caution for the management
to look after.
2) Also, this ratio must be seen in conjunction with the creditors‟ turnover ratio. Being a
Capital intensive company, it is still considered if your debtors‟ turnover is fairly
good in comparison with creditors‟ turnover. But nonetheless the management should
keep a vigil eye.
4.1.7 CREDITORS TURNOVER
Creditors’ turnover ratio indicates the number of times sundry creditors have been paid
during a year. It is calculated to judge the requirements of cash for paying sundry creditors. It
is calculated by dividing the net credit purchases by average creditors.
Creditors Turnover = Trade Creditor Purchases
Average Creditors
Average Creditors = Opening Balance of Creditors + Closing Balance of Creditors
2
Net credit purchases consist of gross credit purchases minus purchase return.
When the information about credit purchases, opening and closing balances of trade creditors
is not available then the ratio is calculated by dividing total purchases by the closing balance
of trade creditors.
Credit Turnover Ratio = Total Purchases
Total Trade Creditors
Significance:
A high creditor’s turnover ratio or a lower credit period ratio signifies that the creditors are
being paid promptly. This situation enhances the credit worthiness of the company. However
a very favorable ratio to this effect also shows that the business is not taking the full
advantage of the credit facilities allowed by the creditors. We can interpret this ratio in
exactly the same way as the debtors’ turnover ratio.
Analysis:
As is evident, the company has tried to maintain a moderate creditor’s ratio so as to avail the
full advantage of the credit facility as well as to maintain its rapport with its creditors. The
ratio at the end of FY2016 stands at 4.23 as compared to the debtors‟ turnover ratio of 2.58 in
the same financial year.
National Thermal Power Corporation (NTPC)
53
4.1.8 CURRENT ASSETS TO TOTAL ASSETS RATIO
This ratio depicts the relationship between the current assets and the total assets. The
total assets of a company comprises of both net fixed assets and current assets.
Total Assets = Net Fixed Assets + Current Assets
Significance:
As the working capital management of a company depends upon its current assets, it is of
great significance to know how much of the total assets are current. The level of current
assets helps us to keep our business afloat
1) NTPC during the last five years has managed to keep a pretty healthy current assets
ratio with an average of 50%. For an Kahalgaon company such levels of current assets
help to carry on daily operations without any difficulty and projects completed
without such glitches also results in huge cost savings thus ultimately resulting in
higher profits.
2) A high ratio also guarantees that the company would never default on its
current obligations thus maintaining a steady relationship with its suppliers.
4.1.9 WORKING CAPITAL TURNOVER RATIO
It shows the relationship between the working capital and sales.
Working Capital Turnover = Sales
Working Capital
The firm should maintain a steady working capital position. It should have adequate working
capital to run its business operations. Both excessive and inadequate working capital
positions are dangerous from a firm’s point of view excessive working capital means holding
costs and idle funds which earn no profits for the firms. Paucity of working capital not only
impairs firm’s profitability but also results in production inefficiencies and interruptions and
also sales disruption.
From the above two graphs, the relationship between working capital and net sales is
depicted. If we look at the results of the second graph, for FY 2016 the ratio of WC to sales is
0.24 i.e. for one rupee of sales, the company needs Rs 0.24 of net current assets (working
capital). This gap will be met from bank borrowings and long term sources of funds.
National Thermal Power Corporation (NTPC)
54
CHAPTER – V
RECOMMENDATIONS AND THE WAY FORWARD
The following recommendations are made to the authorities at NTPC Kahalgaon in order to
maintain and improve on their current performance. The recommendations made are based
purely on my understanding of the situation. Some of the major things which I would like the
authorities to take notice of include:
 Optimum Utilization of resources:- NTPC has to focus on optimum utilization of
resources that ensure the rational return on capital employed. It is found that during
the course of analysis the ROA, ROE and ROCE continuously reduce by last five
years.
 Dividend –Per- Share- During the course of Financial Analysis it is also found that
rate of DPS is low as compare to ‘Earning Per share’ which may be discourage the
investors to invest their money in NTPC.
 Followed in India. Current ratio indicates the ability of a company to stay a floater
respective of the prevailing market situations. Internationally, a current ratio of 2:1 is
accepted. The investors also seek this ratio in order to examine whether the company
has adequate current resources so that it does not default on its obligations and is able
to generate sufficient returns to maximize shareholder’s money.
 Debtor’s turnover ratio needs a tune up as against creditor’s turnover. This ratio
helps to examine whether the management of the concerned organization is not being
complacent in recovery of its debts on time. Generally it is required that debtors
turnover ratio be high as compared to creditors turnover which implies that the firm is
generating sales adequate enough to cover its production cost. If we look at the
situation for NTPC, the ratios were fine enough until FY014 but then afterwards the
debtor’s turnover took a dip but because of adequate liquidity the management is able
to take care of its obligations as for now. But if a proper solution is not formulated
then it can become a huge problem which will affect not only the performance of the
firm but may also deteriorate the confidence of the investors in the company.
 The inventory turnover ratio for NTPC has been a success story for the last
couple of years so the management should do everything possible thing to maintain
National Thermal Power Corporation (NTPC)
55
this inclination in the coming years and try to encourage its human resources to keep
up the good work.
 With many a projects in line and at different levels of execution, it is required that
all the aspects are dealt with equal importance whether it is the case of long term
ratios or the short term ratios. The company has so many projects in line for which it
will require funds. With stellar performance in various sectors it has the confidence of
investors. So the management just need to continue on the good work.
 Up to now the Company enjoys the top end ratings of ‘AA+’ and ‘AA’ from
CRISIL and FITCH respectively. So the management must make sure that investor’s
confidence remains the same.
Some of the recent initiatives of NTPC are:
 company is also mulling to raise funds worth `3.6 billion via non-convertible
debentures.

In the metro segment, NTPC intends to increase the frequency of trains at the Airport
express metro link in Delhi and thereby increase the number of daily commuters to
50,000 passengers per day by the end of FY13E and to around 100,000 by FY15-
16E. Besides, the company has also qualified for Jaipur Metro Rail project Phase-I,
along with other three bidders.
 NTPC is presently working in the development of five power transmission projects
across the North-western part of the country. Of which, the WRSS project is likely to
see completion by the end of 2016, providing higher revenue visibility for FY17.
Meanwhile, the six EHV stations commissioned in Mumbai also ensure hassle free
power transmission in the city
National Thermal Power Corporation (NTPC)
56
CONCLUSION
Performance of the NTPC in the fields of earning per share decrease again and
again from last four continuous years i.e. (from 2013 to 2016) while dividend
per share was constant in 2013 to 2014 but in the F.Y. 14-15 is decreased by
56.52% when earning per share decrease only by 6.23% from previous years.
However, we can see that in year 2015-16 DPS increase by 34% from previous
year when EPS decrease by 0.48%. ROA decrease since 2012-13, which shows
the assets involved in the business not utilized properly and company has to
focus on it. It is also find that Return on Equity is reduce year over year since
FY 2012-13 that shows the performance of the company in the aspect of earning
is not good. We can see in the graph it clearly. Return of capital employed is
also reducing since F.Y.-2012-13 those stats that utilization of capital is not in
good position.
Enterprise value decreases as compare to capital Employed. We can see
that where in Financial Year 2011-12 EV/CE Ratio was 1.14, in Financial
Year 2012-13 decreases by 18.42% and in Financial Year 2013-14 decreases by
11.82 from previous years while next FY 2014-15 Enterprise value increase by
17.07% from previous year but in FY 2015-16 it again decrease by 8.33 %.
Therefore, it is concluded that performance of the company is not up to
the mark because of that company fails to ensure optimum utilization of
resources that result market price of equity shares are fluctuate every year.
Therefore, it suggested that company has to ensure optimum utilization of
resources that maximize the profit and help to increase Market price of shares
that also will improve the Enterprise value.
National Thermal Power Corporation (NTPC)
57
BIBLIOGRAPHY
INTERNET SITES
 www.ntpc.com
 www.Thermal power.com
 www.businessworld.in
 www.lancogroup.com
 www.gmrgroup.com
 www.larsentoubro.com
 www.wikipedia.org
 www.investopedia.com
NEWSPAPERS
 Financial express
 Economic Times
BOOKS, JOURNALS and REFERENCES:-
 Hrishikesh Bhattacharya, Working capital management - Strategies and techniques, Nov.
2014, published by Prentice Hall India
 Financial Management – I.M Pandey
 RP Rustagi’s ― Financial Management
 Trends in working capital management & its impact—K Padachi (2006)

 Impact of working capital management policies on profitability of a firm—S
Vishnanai (2007)
 An analysis of working capital management—V Ganeshan (2007)

 Effects of working capital management on SME profitability—PJ Gareia Tervel
(2007)
 International Journal of Economics and Finance—K Anagnostopoulos (2009)

 Relationship between working capital management and profitability—Amarjeet
Gill, Nahum Biger, NeilMathur (2010)
 African Journal on Finance and Management—WM Visemith (2004)
 Journal of Corporate Finance—Elsevier
 Asian Journal of Finance—K Saleem (2012)

More Related Content

What's hot

REPORT ON SUMMER TRAINING A FINANCIAL STATEMENT ANALYSIS AND INTERPRETATION...
 REPORT ON SUMMER TRAINING  A FINANCIAL STATEMENT ANALYSIS AND INTERPRETATION... REPORT ON SUMMER TRAINING  A FINANCIAL STATEMENT ANALYSIS AND INTERPRETATION...
REPORT ON SUMMER TRAINING A FINANCIAL STATEMENT ANALYSIS AND INTERPRETATION...priya bansal
 
MBA Finance Project Topics
MBA Finance Project TopicsMBA Finance Project Topics
MBA Finance Project TopicsMBA Dissertation
 
Financial Statment Analysis of TATA MOTORS
Financial Statment Analysis of TATA MOTORSFinancial Statment Analysis of TATA MOTORS
Financial Statment Analysis of TATA MOTORSHussain bohra
 
Working capital management project report mba
Working capital management project report mbaWorking capital management project report mba
Working capital management project report mbaBabasab Patil
 
A REPORT ON FINANCIAL ANALYSIS OF DABUR AND BRITANNIA
A REPORT ON FINANCIAL ANALYSIS OF DABUR AND BRITANNIAA REPORT ON FINANCIAL ANALYSIS OF DABUR AND BRITANNIA
A REPORT ON FINANCIAL ANALYSIS OF DABUR AND BRITANNIAM Diable
 
Summer Internship Report (Shekhar Chandra) (CA)
Summer Internship Report (Shekhar Chandra) (CA)Summer Internship Report (Shekhar Chandra) (CA)
Summer Internship Report (Shekhar Chandra) (CA)AakashBhalla2
 
A project report on comparative study of mutual funds in india
A project report on comparative study of mutual funds in indiaA project report on comparative study of mutual funds in india
A project report on comparative study of mutual funds in indiaProjects Kart
 
summer internship program report "Ratio analysis"
summer internship program report "Ratio analysis"summer internship program report "Ratio analysis"
summer internship program report "Ratio analysis"Ganesh Mourya
 
Capital Structure of Tata Motors
Capital Structure of Tata MotorsCapital Structure of Tata Motors
Capital Structure of Tata MotorsAkash Saha
 
A FINANCIAL STATEMENT ANALYSIS AND INTERPRETATION
A FINANCIAL STATEMENT ANALYSIS AND INTERPRETATIONA FINANCIAL STATEMENT ANALYSIS AND INTERPRETATION
A FINANCIAL STATEMENT ANALYSIS AND INTERPRETATIONBIJENDRAMAHATO
 
Synopsis on financial statement analysis
Synopsis on financial statement analysisSynopsis on financial statement analysis
Synopsis on financial statement analysissaurabh surve
 
Customer perception towards mutual funds
Customer perception towards mutual fundsCustomer perception towards mutual funds
Customer perception towards mutual fundsProjects Kart
 
Internship Project Report on RATIOS
Internship Project Report on RATIOSInternship Project Report on RATIOS
Internship Project Report on RATIOSM Diable
 
Summer training project for finance
Summer training project for financeSummer training project for finance
Summer training project for financejaiswal123456789
 
A Study of ratios as a Tool of Financial Statement Analysis GK Plastics Bhala...
A Study of ratios as a Tool of Financial Statement Analysis GK Plastics Bhala...A Study of ratios as a Tool of Financial Statement Analysis GK Plastics Bhala...
A Study of ratios as a Tool of Financial Statement Analysis GK Plastics Bhala...Avinash Labade
 
Capital budgeting full clear
Capital budgeting full clearCapital budgeting full clear
Capital budgeting full clearAkhilesh Kumar
 
A project report on analysis of financial statement of icici bank
A project report on analysis of financial statement of  icici bankA project report on analysis of financial statement of  icici bank
A project report on analysis of financial statement of icici bankProjects Kart
 

What's hot (20)

REPORT ON SUMMER TRAINING A FINANCIAL STATEMENT ANALYSIS AND INTERPRETATION...
 REPORT ON SUMMER TRAINING  A FINANCIAL STATEMENT ANALYSIS AND INTERPRETATION... REPORT ON SUMMER TRAINING  A FINANCIAL STATEMENT ANALYSIS AND INTERPRETATION...
REPORT ON SUMMER TRAINING A FINANCIAL STATEMENT ANALYSIS AND INTERPRETATION...
 
PROJECT ON WORKING CAPITAL MANAGEMENT
PROJECT ON WORKING CAPITAL MANAGEMENTPROJECT ON WORKING CAPITAL MANAGEMENT
PROJECT ON WORKING CAPITAL MANAGEMENT
 
MBA Finance Project Topics
MBA Finance Project TopicsMBA Finance Project Topics
MBA Finance Project Topics
 
Project wipro
Project wiproProject wipro
Project wipro
 
Financial Statment Analysis of TATA MOTORS
Financial Statment Analysis of TATA MOTORSFinancial Statment Analysis of TATA MOTORS
Financial Statment Analysis of TATA MOTORS
 
Working capital management project report mba
Working capital management project report mbaWorking capital management project report mba
Working capital management project report mba
 
A REPORT ON FINANCIAL ANALYSIS OF DABUR AND BRITANNIA
A REPORT ON FINANCIAL ANALYSIS OF DABUR AND BRITANNIAA REPORT ON FINANCIAL ANALYSIS OF DABUR AND BRITANNIA
A REPORT ON FINANCIAL ANALYSIS OF DABUR AND BRITANNIA
 
Summer Internship Report (Shekhar Chandra) (CA)
Summer Internship Report (Shekhar Chandra) (CA)Summer Internship Report (Shekhar Chandra) (CA)
Summer Internship Report (Shekhar Chandra) (CA)
 
PROJECT REPORT ON MUTUAL FUNDS
PROJECT REPORT ON MUTUAL FUNDS PROJECT REPORT ON MUTUAL FUNDS
PROJECT REPORT ON MUTUAL FUNDS
 
A project report on comparative study of mutual funds in india
A project report on comparative study of mutual funds in indiaA project report on comparative study of mutual funds in india
A project report on comparative study of mutual funds in india
 
summer internship program report "Ratio analysis"
summer internship program report "Ratio analysis"summer internship program report "Ratio analysis"
summer internship program report "Ratio analysis"
 
Capital Structure of Tata Motors
Capital Structure of Tata MotorsCapital Structure of Tata Motors
Capital Structure of Tata Motors
 
A FINANCIAL STATEMENT ANALYSIS AND INTERPRETATION
A FINANCIAL STATEMENT ANALYSIS AND INTERPRETATIONA FINANCIAL STATEMENT ANALYSIS AND INTERPRETATION
A FINANCIAL STATEMENT ANALYSIS AND INTERPRETATION
 
Synopsis on financial statement analysis
Synopsis on financial statement analysisSynopsis on financial statement analysis
Synopsis on financial statement analysis
 
Customer perception towards mutual funds
Customer perception towards mutual fundsCustomer perception towards mutual funds
Customer perception towards mutual funds
 
Internship Project Report on RATIOS
Internship Project Report on RATIOSInternship Project Report on RATIOS
Internship Project Report on RATIOS
 
Summer training project for finance
Summer training project for financeSummer training project for finance
Summer training project for finance
 
A Study of ratios as a Tool of Financial Statement Analysis GK Plastics Bhala...
A Study of ratios as a Tool of Financial Statement Analysis GK Plastics Bhala...A Study of ratios as a Tool of Financial Statement Analysis GK Plastics Bhala...
A Study of ratios as a Tool of Financial Statement Analysis GK Plastics Bhala...
 
Capital budgeting full clear
Capital budgeting full clearCapital budgeting full clear
Capital budgeting full clear
 
A project report on analysis of financial statement of icici bank
A project report on analysis of financial statement of  icici bankA project report on analysis of financial statement of  icici bank
A project report on analysis of financial statement of icici bank
 

Similar to Project Report on Financial Analysis by Nirbhay Kumar, MBA - 3rd Sem.,TMBU,Bhagalpur

dipakwaghmarefinalproject-191111051008.pdf
dipakwaghmarefinalproject-191111051008.pdfdipakwaghmarefinalproject-191111051008.pdf
dipakwaghmarefinalproject-191111051008.pdfKanika513907
 
Submit final report on working capital mgt
Submit final report on working capital mgtSubmit final report on working capital mgt
Submit final report on working capital mgtJack Silambu
 
Tvs motor financial ratio
Tvs motor financial ratioTvs motor financial ratio
Tvs motor financial ratioDeepak Lohar
 
Profitability & Growth Analysis of SPL & OPL
Profitability & Growth Analysis of SPL & OPLProfitability & Growth Analysis of SPL & OPL
Profitability & Growth Analysis of SPL & OPLDebabrata Barman
 
Air deccan final
Air deccan finalAir deccan final
Air deccan finalSakib Anik
 
Projectreportofpinkeyrana 150902165622-lva1-app6892
Projectreportofpinkeyrana 150902165622-lva1-app6892Projectreportofpinkeyrana 150902165622-lva1-app6892
Projectreportofpinkeyrana 150902165622-lva1-app6892bhawnasingh108
 
Financial Performance Analysis
Financial Performance Analysis Financial Performance Analysis
Financial Performance Analysis A.m. Mathavan
 
ANALYSIS OF FINANCIAL PERFORMANCE OF THOMAS COOK (INDIA) LTD. USING RATIO ANA...
ANALYSIS OF FINANCIAL PERFORMANCE OF THOMAS COOK (INDIA) LTD. USING RATIO ANA...ANALYSIS OF FINANCIAL PERFORMANCE OF THOMAS COOK (INDIA) LTD. USING RATIO ANA...
ANALYSIS OF FINANCIAL PERFORMANCE OF THOMAS COOK (INDIA) LTD. USING RATIO ANA...Anirban Chakraborty
 
Black book project on power generation company
Black book project on power generation companyBlack book project on power generation company
Black book project on power generation companyAkash Gupta
 
1702836 PAPER Financial Statement Analysis Using Common Size on Mahindra Sind...
1702836 PAPER Financial Statement Analysis Using Common Size on Mahindra Sind...1702836 PAPER Financial Statement Analysis Using Common Size on Mahindra Sind...
1702836 PAPER Financial Statement Analysis Using Common Size on Mahindra Sind...DR BHADRAPPA HARALAYYA
 
Ratio Analysis project
Ratio Analysis projectRatio Analysis project
Ratio Analysis projectD V A Subhash
 
Equity Share Analysis of GTPL Hathway Ltd (Internship report)
Equity Share Analysis of GTPL Hathway Ltd (Internship report)Equity Share Analysis of GTPL Hathway Ltd (Internship report)
Equity Share Analysis of GTPL Hathway Ltd (Internship report)Gyananjaya Behera
 
comparative analysis of financial statements
comparative analysis of financial statementscomparative analysis of financial statements
comparative analysis of financial statementsSURAJ KAMBOJ
 
Reliance infra converted
Reliance infra convertedReliance infra converted
Reliance infra convertedKushagra Bansal
 
MTNL REPORT - FINANCIAL ANALYSIS
MTNL REPORT - FINANCIAL ANALYSISMTNL REPORT - FINANCIAL ANALYSIS
MTNL REPORT - FINANCIAL ANALYSISpam_nagar
 
Federal Bank Project
Federal Bank ProjectFederal Bank Project
Federal Bank ProjectPaul Jose
 

Similar to Project Report on Financial Analysis by Nirbhay Kumar, MBA - 3rd Sem.,TMBU,Bhagalpur (20)

dipakwaghmarefinalproject-191111051008.pdf
dipakwaghmarefinalproject-191111051008.pdfdipakwaghmarefinalproject-191111051008.pdf
dipakwaghmarefinalproject-191111051008.pdf
 
Dipak waghmare final project
Dipak waghmare final projectDipak waghmare final project
Dipak waghmare final project
 
Educomp
EducompEducomp
Educomp
 
Submit final report on working capital mgt
Submit final report on working capital mgtSubmit final report on working capital mgt
Submit final report on working capital mgt
 
Tvs motor financial ratio
Tvs motor financial ratioTvs motor financial ratio
Tvs motor financial ratio
 
Profitability & Growth Analysis of SPL & OPL
Profitability & Growth Analysis of SPL & OPLProfitability & Growth Analysis of SPL & OPL
Profitability & Growth Analysis of SPL & OPL
 
MBA project.
MBA project.MBA project.
MBA project.
 
MBA project.
MBA project.MBA project.
MBA project.
 
Air deccan final
Air deccan finalAir deccan final
Air deccan final
 
Projectreportofpinkeyrana 150902165622-lva1-app6892
Projectreportofpinkeyrana 150902165622-lva1-app6892Projectreportofpinkeyrana 150902165622-lva1-app6892
Projectreportofpinkeyrana 150902165622-lva1-app6892
 
Financial Performance Analysis
Financial Performance Analysis Financial Performance Analysis
Financial Performance Analysis
 
ANALYSIS OF FINANCIAL PERFORMANCE OF THOMAS COOK (INDIA) LTD. USING RATIO ANA...
ANALYSIS OF FINANCIAL PERFORMANCE OF THOMAS COOK (INDIA) LTD. USING RATIO ANA...ANALYSIS OF FINANCIAL PERFORMANCE OF THOMAS COOK (INDIA) LTD. USING RATIO ANA...
ANALYSIS OF FINANCIAL PERFORMANCE OF THOMAS COOK (INDIA) LTD. USING RATIO ANA...
 
Black book project on power generation company
Black book project on power generation companyBlack book project on power generation company
Black book project on power generation company
 
1702836 PAPER Financial Statement Analysis Using Common Size on Mahindra Sind...
1702836 PAPER Financial Statement Analysis Using Common Size on Mahindra Sind...1702836 PAPER Financial Statement Analysis Using Common Size on Mahindra Sind...
1702836 PAPER Financial Statement Analysis Using Common Size on Mahindra Sind...
 
Ratio Analysis project
Ratio Analysis projectRatio Analysis project
Ratio Analysis project
 
Equity Share Analysis of GTPL Hathway Ltd (Internship report)
Equity Share Analysis of GTPL Hathway Ltd (Internship report)Equity Share Analysis of GTPL Hathway Ltd (Internship report)
Equity Share Analysis of GTPL Hathway Ltd (Internship report)
 
comparative analysis of financial statements
comparative analysis of financial statementscomparative analysis of financial statements
comparative analysis of financial statements
 
Reliance infra converted
Reliance infra convertedReliance infra converted
Reliance infra converted
 
MTNL REPORT - FINANCIAL ANALYSIS
MTNL REPORT - FINANCIAL ANALYSISMTNL REPORT - FINANCIAL ANALYSIS
MTNL REPORT - FINANCIAL ANALYSIS
 
Federal Bank Project
Federal Bank ProjectFederal Bank Project
Federal Bank Project
 

Recently uploaded

Economic Risk Factor Update: April 2024 [SlideShare]
Economic Risk Factor Update: April 2024 [SlideShare]Economic Risk Factor Update: April 2024 [SlideShare]
Economic Risk Factor Update: April 2024 [SlideShare]Commonwealth
 
(办理原版一样)QUT毕业证昆士兰科技大学毕业证学位证留信学历认证成绩单补办
(办理原版一样)QUT毕业证昆士兰科技大学毕业证学位证留信学历认证成绩单补办(办理原版一样)QUT毕业证昆士兰科技大学毕业证学位证留信学历认证成绩单补办
(办理原版一样)QUT毕业证昆士兰科技大学毕业证学位证留信学历认证成绩单补办fqiuho152
 
《加拿大本地办假证-寻找办理Dalhousie毕业证和达尔豪斯大学毕业证书的中介代理》
《加拿大本地办假证-寻找办理Dalhousie毕业证和达尔豪斯大学毕业证书的中介代理》《加拿大本地办假证-寻找办理Dalhousie毕业证和达尔豪斯大学毕业证书的中介代理》
《加拿大本地办假证-寻找办理Dalhousie毕业证和达尔豪斯大学毕业证书的中介代理》rnrncn29
 
Authentic No 1 Amil Baba In Pakistan Authentic No 1 Amil Baba In Karachi No 1...
Authentic No 1 Amil Baba In Pakistan Authentic No 1 Amil Baba In Karachi No 1...Authentic No 1 Amil Baba In Pakistan Authentic No 1 Amil Baba In Karachi No 1...
Authentic No 1 Amil Baba In Pakistan Authentic No 1 Amil Baba In Karachi No 1...First NO1 World Amil baba in Faisalabad
 
Classical Theory of Macroeconomics by Adam Smith
Classical Theory of Macroeconomics by Adam SmithClassical Theory of Macroeconomics by Adam Smith
Classical Theory of Macroeconomics by Adam SmithAdamYassin2
 
The Triple Threat | Article on Global Resession | Harsh Kumar
The Triple Threat | Article on Global Resession | Harsh KumarThe Triple Threat | Article on Global Resession | Harsh Kumar
The Triple Threat | Article on Global Resession | Harsh KumarHarsh Kumar
 
Bladex 1Q24 Earning Results Presentation
Bladex 1Q24 Earning Results PresentationBladex 1Q24 Earning Results Presentation
Bladex 1Q24 Earning Results PresentationBladex
 
Quantitative Analysis of Retail Sector Companies
Quantitative Analysis of Retail Sector CompaniesQuantitative Analysis of Retail Sector Companies
Quantitative Analysis of Retail Sector Companiesprashantbhati354
 
Stock Market Brief Deck FOR 4/17 video.pdf
Stock Market Brief Deck FOR 4/17 video.pdfStock Market Brief Deck FOR 4/17 video.pdf
Stock Market Brief Deck FOR 4/17 video.pdfMichael Silva
 
PMFBY , Pradhan Mantri Fasal bima yojna
PMFBY , Pradhan Mantri  Fasal bima yojnaPMFBY , Pradhan Mantri  Fasal bima yojna
PMFBY , Pradhan Mantri Fasal bima yojnaDharmendra Kumar
 
NO1 Certified Ilam kala Jadu Specialist Expert In Bahawalpur, Sargodha, Sialk...
NO1 Certified Ilam kala Jadu Specialist Expert In Bahawalpur, Sargodha, Sialk...NO1 Certified Ilam kala Jadu Specialist Expert In Bahawalpur, Sargodha, Sialk...
NO1 Certified Ilam kala Jadu Specialist Expert In Bahawalpur, Sargodha, Sialk...Amil Baba Dawood bangali
 
The Core Functions of the Bangko Sentral ng Pilipinas
The Core Functions of the Bangko Sentral ng PilipinasThe Core Functions of the Bangko Sentral ng Pilipinas
The Core Functions of the Bangko Sentral ng PilipinasCherylouCamus
 
Economics, Commerce and Trade Management: An International Journal (ECTIJ)
Economics, Commerce and Trade Management: An International Journal (ECTIJ)Economics, Commerce and Trade Management: An International Journal (ECTIJ)
Economics, Commerce and Trade Management: An International Journal (ECTIJ)ECTIJ
 
NO1 WorldWide Love marriage specialist baba ji Amil Baba Kala ilam powerful v...
NO1 WorldWide Love marriage specialist baba ji Amil Baba Kala ilam powerful v...NO1 WorldWide Love marriage specialist baba ji Amil Baba Kala ilam powerful v...
NO1 WorldWide Love marriage specialist baba ji Amil Baba Kala ilam powerful v...Amil baba
 
Stock Market Brief Deck for "this does not happen often".pdf
Stock Market Brief Deck for "this does not happen often".pdfStock Market Brief Deck for "this does not happen often".pdf
Stock Market Brief Deck for "this does not happen often".pdfMichael Silva
 
Lundin Gold April 2024 Corporate Presentation v4.pdf
Lundin Gold April 2024 Corporate Presentation v4.pdfLundin Gold April 2024 Corporate Presentation v4.pdf
Lundin Gold April 2024 Corporate Presentation v4.pdfAdnet Communications
 
Vp Girls near me Delhi Call Now or WhatsApp
Vp Girls near me Delhi Call Now or WhatsAppVp Girls near me Delhi Call Now or WhatsApp
Vp Girls near me Delhi Call Now or WhatsAppmiss dipika
 
Call Girls Near Delhi Pride Hotel, New Delhi|9873777170
Call Girls Near Delhi Pride Hotel, New Delhi|9873777170Call Girls Near Delhi Pride Hotel, New Delhi|9873777170
Call Girls Near Delhi Pride Hotel, New Delhi|9873777170Sonam Pathan
 
House of Commons ; CDC schemes overview document
House of Commons ; CDC schemes overview documentHouse of Commons ; CDC schemes overview document
House of Commons ; CDC schemes overview documentHenry Tapper
 

Recently uploaded (20)

Economic Risk Factor Update: April 2024 [SlideShare]
Economic Risk Factor Update: April 2024 [SlideShare]Economic Risk Factor Update: April 2024 [SlideShare]
Economic Risk Factor Update: April 2024 [SlideShare]
 
(办理原版一样)QUT毕业证昆士兰科技大学毕业证学位证留信学历认证成绩单补办
(办理原版一样)QUT毕业证昆士兰科技大学毕业证学位证留信学历认证成绩单补办(办理原版一样)QUT毕业证昆士兰科技大学毕业证学位证留信学历认证成绩单补办
(办理原版一样)QUT毕业证昆士兰科技大学毕业证学位证留信学历认证成绩单补办
 
《加拿大本地办假证-寻找办理Dalhousie毕业证和达尔豪斯大学毕业证书的中介代理》
《加拿大本地办假证-寻找办理Dalhousie毕业证和达尔豪斯大学毕业证书的中介代理》《加拿大本地办假证-寻找办理Dalhousie毕业证和达尔豪斯大学毕业证书的中介代理》
《加拿大本地办假证-寻找办理Dalhousie毕业证和达尔豪斯大学毕业证书的中介代理》
 
Authentic No 1 Amil Baba In Pakistan Authentic No 1 Amil Baba In Karachi No 1...
Authentic No 1 Amil Baba In Pakistan Authentic No 1 Amil Baba In Karachi No 1...Authentic No 1 Amil Baba In Pakistan Authentic No 1 Amil Baba In Karachi No 1...
Authentic No 1 Amil Baba In Pakistan Authentic No 1 Amil Baba In Karachi No 1...
 
Classical Theory of Macroeconomics by Adam Smith
Classical Theory of Macroeconomics by Adam SmithClassical Theory of Macroeconomics by Adam Smith
Classical Theory of Macroeconomics by Adam Smith
 
The Triple Threat | Article on Global Resession | Harsh Kumar
The Triple Threat | Article on Global Resession | Harsh KumarThe Triple Threat | Article on Global Resession | Harsh Kumar
The Triple Threat | Article on Global Resession | Harsh Kumar
 
Bladex 1Q24 Earning Results Presentation
Bladex 1Q24 Earning Results PresentationBladex 1Q24 Earning Results Presentation
Bladex 1Q24 Earning Results Presentation
 
Quantitative Analysis of Retail Sector Companies
Quantitative Analysis of Retail Sector CompaniesQuantitative Analysis of Retail Sector Companies
Quantitative Analysis of Retail Sector Companies
 
Stock Market Brief Deck FOR 4/17 video.pdf
Stock Market Brief Deck FOR 4/17 video.pdfStock Market Brief Deck FOR 4/17 video.pdf
Stock Market Brief Deck FOR 4/17 video.pdf
 
PMFBY , Pradhan Mantri Fasal bima yojna
PMFBY , Pradhan Mantri  Fasal bima yojnaPMFBY , Pradhan Mantri  Fasal bima yojna
PMFBY , Pradhan Mantri Fasal bima yojna
 
NO1 Certified Ilam kala Jadu Specialist Expert In Bahawalpur, Sargodha, Sialk...
NO1 Certified Ilam kala Jadu Specialist Expert In Bahawalpur, Sargodha, Sialk...NO1 Certified Ilam kala Jadu Specialist Expert In Bahawalpur, Sargodha, Sialk...
NO1 Certified Ilam kala Jadu Specialist Expert In Bahawalpur, Sargodha, Sialk...
 
The Core Functions of the Bangko Sentral ng Pilipinas
The Core Functions of the Bangko Sentral ng PilipinasThe Core Functions of the Bangko Sentral ng Pilipinas
The Core Functions of the Bangko Sentral ng Pilipinas
 
Economics, Commerce and Trade Management: An International Journal (ECTIJ)
Economics, Commerce and Trade Management: An International Journal (ECTIJ)Economics, Commerce and Trade Management: An International Journal (ECTIJ)
Economics, Commerce and Trade Management: An International Journal (ECTIJ)
 
NO1 WorldWide Love marriage specialist baba ji Amil Baba Kala ilam powerful v...
NO1 WorldWide Love marriage specialist baba ji Amil Baba Kala ilam powerful v...NO1 WorldWide Love marriage specialist baba ji Amil Baba Kala ilam powerful v...
NO1 WorldWide Love marriage specialist baba ji Amil Baba Kala ilam powerful v...
 
Stock Market Brief Deck for "this does not happen often".pdf
Stock Market Brief Deck for "this does not happen often".pdfStock Market Brief Deck for "this does not happen often".pdf
Stock Market Brief Deck for "this does not happen often".pdf
 
Lundin Gold April 2024 Corporate Presentation v4.pdf
Lundin Gold April 2024 Corporate Presentation v4.pdfLundin Gold April 2024 Corporate Presentation v4.pdf
Lundin Gold April 2024 Corporate Presentation v4.pdf
 
Vp Girls near me Delhi Call Now or WhatsApp
Vp Girls near me Delhi Call Now or WhatsAppVp Girls near me Delhi Call Now or WhatsApp
Vp Girls near me Delhi Call Now or WhatsApp
 
Call Girls Near Delhi Pride Hotel, New Delhi|9873777170
Call Girls Near Delhi Pride Hotel, New Delhi|9873777170Call Girls Near Delhi Pride Hotel, New Delhi|9873777170
Call Girls Near Delhi Pride Hotel, New Delhi|9873777170
 
House of Commons ; CDC schemes overview document
House of Commons ; CDC schemes overview documentHouse of Commons ; CDC schemes overview document
House of Commons ; CDC schemes overview document
 
🔝+919953056974 🔝young Delhi Escort service Pusa Road
🔝+919953056974 🔝young Delhi Escort service Pusa Road🔝+919953056974 🔝young Delhi Escort service Pusa Road
🔝+919953056974 🔝young Delhi Escort service Pusa Road
 

Project Report on Financial Analysis by Nirbhay Kumar, MBA - 3rd Sem.,TMBU,Bhagalpur

  • 1. National Thermal Power Corporation (NTPC) Summer Internship Report on FINANCIAL ANALYSIS OF NATIONAL THERMAL POWER CORPORATION AT NATIONAL THERMAL POWER CORPORATION (NTPC) KAHALGAON (In partial fulfillment of MBA Course) For the period 15th June to 30st July, 2017 Under the guidance of Mrs. Shweta Jaiswal (FINANCE) UNIVERSITY DEPARTMENT OF COMMERCE & BUSSINESS ADMINISTRATION Submitted by Nirbhay Kumar Class Roll no. - 13 University Roll no. - 05 Academic Session: 2016-2018 Master of Business Administration (Finance)
  • 2. National Thermal Power Corporation (NTPC) DECLARATION I, Nirbhay Kumar Class Roll No 13, University Roll No.05 student of MBA-Finance Management (2016-18) at National Thermal Power Corporation (NTPC) Training Institute, Kahalgaon, Bhagalpur hereby declare that the Summer Training Report entitled “Financial Analysis of NTPC AT NTPC, Kahalgaon.” is an original work and the same has not been submitted to any other Institute for the award of any other degree. A Seminar presentation of the Training Report was made on ________________________and the suggestions as approved by the faculty were duly incorporated. Presentation In-Charge Signature of the Candidate (Faculty) Countersigned Director/Principal of the Institute
  • 3. National Thermal Power Corporation (NTPC) ACKNOWLEDGEMENT It is my pleasure to be indebted to various people, who directly or indirectly contributed in the development of this work and who influenced my thinking, behavior, and acts during the course of study. I express my sincere gratitude to Prof.(Dr.) Pawan Kumar Poddar, Head of the Department, Department of Business Administration, TMBU, Bhagalpur for providing me an opportunity to undergo summer training at NTPC, I am thankful to Mr. K. Barman, Senior Manager, Book & Budget Section, NTPC for his support, cooperation, and motivation provided to me during the training for constant inspiration, presence and blessings. I also extend my sincere appreciation to Mrs. Shweta Jaiswal, Faculty Guide, MBA, TMBU, Bhagalpur who provided her valuable suggestions and precious time in accomplishing my project report. Lastly, I would like to thank the almighty and my parents for their moral support and my friends with whom I shared my day-to-day experience and received lots of suggestions that improved my quality of work. Nirbhay Kumar M.B.A. Finance 2016-18
  • 4. National Thermal Power Corporation (NTPC) EXECUTIVE SUMMARY This report is an analysis of the financial operations and performance of the company for the period of March-2012 to March 2016. This report will provide an assessment and analysis of the profitability, liquidity, performance and financial position of the NTPC using figures from the financial statements for the March-2012 to March 2016. In the analysis, financial ratios were used to gain a critical review of the specific areas of assessment of the company’s performance. The ratios were able to provide a clear view of the overall performance of the company. From the ratios we can say that the year 2016 has not been profitable mainly because of high expenditures mainly rates and insurance. Gross Profit margin is very good which implies that direct costs are properly monitored. The company has a healthy liquidity position which means that it can rely on its current assets to finance the current liabilities and does not have to commit to long term debts. However, it can be noticed that the future look bright, firstly because of recovering losses and secondly because healthy financing structure giving that it relies a heavily on debts. It has been recommended that the company should look into ways of improving sales in period of low demand to improve profitability and also increase financing to expand and grow the business. The analysis is limited mainly due to the fact that it is based on financial statement, and hence no comparative study has been made possible. Given the nature of the business, it would have been interesting to evaluate the business by comparing with past years results and also with the industry benchmark.
  • 5. National Thermal Power Corporation (NTPC) 5 LIST OF FIGURES Figure 1- Installed Capacity by source 5 Figure 2- Solar Panel installed by NTPC 7 Figure 3- Providing Schooling Facility 7 Figure 4- Nuclear Power Plant Installed by NTPC 8 Figure 5- Providing Schooling Facility within campus for best education 8 Figure 6- Develop Green Belt by NTPC 9 Figure 7- Providing Health Care facility to Rural people 9 Figure 8- Nuclear Power & Solar Power Plant Installed by NTPC 10 Figure 9- Empowering women by providing training for self employment 10 Figure 10- Comparison of EPS & DPS 24 Figure 11- Comparison of ROA, ROE and ROCE 27 Figure 12- Enterprise Value – Capital Employed Ratio 36 Figure 13- Cash Flow 39 LIST OF TABLES Table 1- Ratio Summery of last 5 years 37 Table 2—Cash Flow Statement of NTPS of last 5 years 40
  • 6. National Thermal Power Corporation (NTPC) 6 TABLE OF CONENTS CERTIFICATE I ACKNOWLEDGEMENT II EXECUTIVE SUMMARY III LIST OF FIGURE IV LIST OF TABLES IV CHAPTER--I INTRODUCTION 1.1 MEANING OF FINANCIAL ANALYSIS 1 1.2 HISTORY OF ELECTRICITY INDUSTRY IN INDIA 3 1.3 COMPANY PROFILE 6 1.4 BUSINESS PROFILE 12 1.5 CRITICAL ASSESSMENT AND EVELUATION OF THE ORGANIZATION (SWOT ANALYSIS) 14 1.6 COMPETITORS 16 CHAPTER--II RESEARCH METHODOLOGY & RELEVANCE OF THE PROJECT 2.1 RESEARCH METHODOLOGY…………………………………………………………………………………………………..18 2.2 RATIO ANALYSIS……………………………………………………………………………………………………………….. 19 2.3 OBJECTIVES……………………………………………………………………………………………………………………….20 2.4 SIGNIFICANCE OF THE PROJECT………………………………………………………………………………………………20 2.5 CONCEPTUALIZATION…………………………………………………………………………………………………...……..21
  • 7. National Thermal Power Corporation (NTPC) 7 CHAPTER—III FINANCIAL ANALYSIS 3.1 INTRODUCTION TO FINANCIAL ANALYSIS ……………………………………. ………………..22 3.1.1 Meaning of Financial Analysis…………………………………………………………………………………………….22 3.1.2 Operational & Financial Ratio……………………………………………………………………………………………………………….. 22 3.1.3 Performance ratio……………………………………………………………………………………………………………………… 24 3.1.4 Valuation Ratio…………………………………………………………………………………………………………………………..28 CHAPTER--IV FINDINGS OF THE PROJECT & COMPARITIVE ANALYSIS 4.1 FINDINGS OF THE PROJECT………………………………………………………………………………………….. 41 4.1.1 WORKING CAPITAL RATIO………………………………………………………………………………………. ....41 4.1.2 CURRENT RATIO……………………………………………………………………………………………………….42 . 4.1.3 ACID TEST RATIO (Liquid/Quick Ratio) …………………………………………………… ……………………..43 4.1.4 CASH RATIO…………………………………………………………………………………………………………….43 4.1.5 INVENTORY TURNOVER RATIO……………………………………………………………………………………44 4.1.6 DEBTOR TURNOVER RATIO…………………………………………………………………………………………44 4.1.7 CREDITOR TURNOVER RATIO………………………………………………………………………………………45 4.1.8 CURRENT ASSETS TO TOTAL ASSETS RATIO…………………………………………………………………….46 4.1.9 WORKING CAPITAL TURNOVER RATIO…………………………………………………………………………..46 CHAPTER--V RESULTS & THE WAY FORWARD 5.1 RECOMMENDATIONS AND THE WAY FORWARD……………………………………………………………47 5.2 RESULTS AND CONCLUSIONS…………………………………………………………………………………………...49. 5.3 BIBLIOGRAPHY………………………………………………………………………………………………………………50
  • 8. National Thermal Power Corporation (NTPC) 8 CHAPTER – I INTRODUCTION 1.1 MEANING OF FINANCIAL ANALYSIS Financial analysis (also referred to as financial statement analysis or accounting analysis or Analysis of finance) refers to an assessment of the viability, stability and profitability of a business, sub-business or project. It is performed by professionals who prepare reports using ratios that make use of information taken from financial statements and other reports. These reports are usually presented to top management as one of their bases in making business decisions. Financial analysis may determine if a business will:  Continue or discontinue its main operation or part of its business;  Make or purchase certain materials in the manufacture of its product;  Acquire or rent/lease certain machineries and equipment in the production of its goods;  Issue stocks or negotiate for a bank loan to increase its working capital;  Make decisions regarding investing or lending capital; Make other decisions that allow management to make an informed selection on various alternatives in the conduct of its business. 1.2. Goals :- Financial analysts often assess the following elements of a firm: 1. Profitability - its ability to earn income and sustain growth in both the short- and long-term. A company's degree of profitability is usually based on the income statement, which reports on the company's results of operations; 2. Solvency - its ability to pay its obligation to creditors and other third parties in the long- term;
  • 9. National Thermal Power Corporation (NTPC) 9 3. Liquidity - its ability to maintain positive cash flow, while satisfying immediate obligations; Both 2 and 3 are based on the company's balance sheet, which indicates the financial condition of a business as of a given point in time. 4. Stability - the firm's ability to remain in business in the long run, without having to sustain significant losses in the conduct of its business. Assessing a company's stability requires the use of both the income statement and the balance sheet, as well as other financial and non- financial indicators. etc. 1.3. Methods :- Financial analysts often compare financial ratios (of solvency, profitability, growth, etc.): Past Performance - Across historical time periods for the same firm (the last 5 years for example), Future Performance - Using historical figures and certain mathematical and statistical techniques, including present and future values, This extrapolation method is the main source of errors in financial analysis as past statistics can be poor predictors of future prospects. Comparative Performance - Comparison between similar firms. These ratios are calculated by dividing a (group of) account balance(s), taken from the balance sheet and / or the income statement, by another, for example :  Net income / equity = return on equity (ROE)  Net income / total assets = return on assets (ROA)  Stock price / earnings per share = P/E ratio Comparing financial ratios is merely one way of conducting financial analysis. Financial ratios face several theoretical challenges: They say little about the firm's prospects in an absolute sense. Their insights about relative performance require a reference point from other time periods or similar firms. One ratio holds little meaning. As indicators, ratios can be logically interpreted in at least two ways. One can partially overcome this problem by combining several related ratios to paint a more comprehensive picture of the firm's performance.
  • 10. National Thermal Power Corporation (NTPC) 10 Seasonal factors may prevent year-end values from being representative. A ratio's values may be distorted as account balances change from the beginning to the end of an accounting period. Use average values for such accounts whenever possible. Financial ratios are no more objective than the accounting methods employed. Changes in accounting policies or choices can yield drastically different ratio values. Fundamental analysis. Financial analysts can also use percentage analysis which involves reducing a series of figures as a percentage of some base amount. For example, a group of items can be expressed as a percentage of net income. When proportionate changes in the same figure over a given time period expressed as a percentage is known as horizontal analysis. Vertical or common- size analysis, reduces all items on a statement to a “common size” as a percentage of some base value which assists in comparability with other companies of different sizes. As a result, all Income Statement items are divided by Sales, and all Balance Sheet items are divided by Total Assets. Another method is comparative analysis. This provides a better way to determine trends. Comparative analysis presents the same information for two or more time periods and is presented side-by-side to allow for easy analysis. 1.4. History of Electricity Industry in India The first demonstration of an electric light in Calcutta (now Kolkata) was conducted on 24 July 1879 by P.W. Fleury & Co. On 7 January 1897, Kilburn & Co secured the Calcutta electric lighting licence as agents of the Indian Electric Co, which was registered in London on 15 January 1897. A month later, the company was renamed the Calcutta Electric Supply Corporation. The control of the company was transferred from London to Calcutta only in 1970. Enthused by the success of electricity in Calcutta, power was thereafter introduced in Bombay (now Mumbai). Mumbai saw electric lighting demonstration for the first time in 1882 at Crawford Market and the Bombay Electric Supply & Tramways Company (BEST) set up a generating station in 1905 to provide electricity for the tramway. The first hydroelectric installation in India was installed near a tea estate at Sidrapong for the Darjeeling Municipality in 1897. The first electric street light in Asia was lit on 5 August 1905 in Bangalore. The first electric train in the country ran on the Harbour Line between Bombay's Victoria Terminus and Kurla on 3
  • 11. National Thermal Power Corporation (NTPC) 11 February 1925. On 18 August 2015, Cochin International Airport became the world's first fully solar powered airport with the inauguration of a dedicated solar plant. India began utilizing grid management on a regional basis in the 1960s. Individual State grids were interconnected to form 5 regional grids covering mainland India. The grids were the Northern, Eastern, Western, North Eastern and Southern Grids. These regional links were established to enable transmission of surplus electricity between States in each region. In the 1990s, the Indian government began planning for a national grid. Regional grids were initially interconnected by asynchronous HVDC back-to-back links facilitating limited exchange of regulated power. The links were subsequently upgraded to high capacity synchronous links. The first interconnection of regional grids was established in October 1991 when the North Eastern and Eastern grids were interconnected. The Western Grid was interconnected with the aforementioned grids in March 2003. The Northern grid was also interconnected in August 2006, forming a Central Grid synchronously connected operating at one frequency.[21] The sole remaining regional grid, the Southern Grid, was synchronously interconnected to the Central Grid on 31 December 2013 with the commissioning of the 765 kV Raichur-Solapur transmission line, thereby establishing the National Grid.[21][22] By the end of calendar year 2015, despite poor hydro electricity generation, India had become a power surplus nation with huge electric power generation capacity idling for want of power demand. The calendar year 2016 started with steep fall in the international price of energy commodities such as coal, diesel oil, naphtha, bunker fuel and LNG which are used in electricity generation in India. Earlier many of the power stations which are using fuels other than coal are unable to operate due to high cost of LNG and petro products. This situation has changed due to glut in petroleum products globally. The prices are falling to such an extent that these fuels have become cheaper to give competition for pit head coal based power generators. Many of the stranded gas and liquid fuel based power stations would be competing with indigenous coal based power stations in an electricity market where demand growth is not encouraging. All the segments of the electricity sector such as fuel suppliers, fuel transporters (railways, harbors, pipelines, etc.), electricity generators, electricity transmission companies and distribution companies would be facing severe competition to cut down the prices and improve their operating efficiency in a final consumer dictated market.[31] Due to tepid growth in electricity consumption, coal stocks are continuously building up at power stations as well as coal mines.
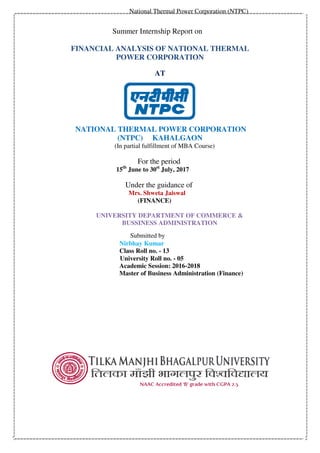
  • 12. National Thermal Power Corporation (NTPC) 12 On March 29, 2017 the Central Electricity Authority stated that for the first time India has become net exporter of electricity. India exported 5,798 GWh to neighbouring countries, against a total import of 5,585 GWh.  Coal: 194,432.88 MW (58.9%)  Large Hydro: 44,614.42 MW (13.5%)  Small Hydro: 4,384.55 MW (1.3%)  Wind Power: 32,508.17 MW (9.8%)  Solar Power: 13,114.85 MW (4.0%)  Biomass: 8,295.78 MW (2.5%)  Nuclear: 6,780 MW (2.1%)  Gas: 25,185.38 MW (7.6%)  Diesel: 837.63 MW (0.3%) Installed Capacity by Source Coal Large Hydro Small Hydro Wind power Solar Power Biomass Nuclear Gas Diesel
  • 13. National Thermal Power Corporation (NTPC) 13 1.5. COMPANY PROFILE NTPC Ltd., formerly known as National Thermal Power Corporation Limited, is an Indian Public Sector Undertaking, engaged in the business of generation of electricity and allied activities. It is a company incorporated under the Companies Act 1956 and a "Government Company" within the meaning of the act. The headquarters of the company is situated at New Delhi. NTPC's core business is generation and sale of electricity to state- owned power distribution companies and State Electricity Boards in India. The company also undertakes consultancy and turnkey project contracts that involve engineering, project management, construction management and operation and management of power plants. The company has also ventured into oil and gas exploration and coal mining activities. It is the largest power company in India with an electric power generating capacity of 51,410 MW. Although the company has approx. 16% of the total national capacity it contributes to over 25% of total power generation due to its focus on operating its power plants at higher efficiency levels (approx. 80.2% against the national PLF rate of 64.5%).NTPC currently produces 25 billion units of electricity per month. It was founded by Government of India in 1975, which now holds 69.74% of its equity shares on 30.06.2016 ] (after divestment of its stake in 2004, 2010, 2013, 2014 & 2016) In May 2010, NTPC was conferred Maharatna status by the Union Government of India. It is ranked 300th in the Forbes Global 2000 for 2016. In October 2005, the company's name was changed from "National Thermal Power Corporation Limited" to "NTPC Limited".[10] The primary reason for this change was the company's foray into hydro and nuclear based power generation along with backward integration by coal mining. In 2006, it entered into an agreement with Government of Sri Lanka to set up two units of 250 MW each in Trincomalee in Sri Lanka. During 2008 and 2011, NTPC entered into Joint Ventures with BHEL, Bharat Forge, NHPC, Coal India, SAIL, NMDC and NPCIL to expand its business of power generation. By the end of 2010, its installed capacity crossed 31,000 MW. The company in 2009 joined forces with other state enterprises Rashtriya Ispat Nigam, Steel Authority of India, Coal India, National Minerals Development Corporation and National Thermal Power Corporation to invest in coal mining operations through a joint venture vehicle named International Coal Ventures Private Limited (ICVL). In July 2014 ICVL acquired a 65 percent stake in the Benga coal mine in Mozambique from the Rio Tinto Group.
  • 14. National Thermal Power Corporation (NTPC) 14 1.5.1 Vision & Mission Figure 2. :- Solar Panel installed by NTPC Vision TO BE THE WORLD’S LEADING POWER COMPANY, ENERGIZING INDIA’S GROWTH. Mission PROVIDE RELIABLE POWER AND RELATED SOLUTIONS IN AN ECONOMICAL, EFFICIENT AND ENVIRONMENT FRIENDLY MANNER, DRIVEN BY INNOVATION AND AGILITY. Figure 3 :- Providing Schooling Facility
  • 15. National Thermal Power Corporation (NTPC) 15 Core Values: ICOMIT  Integrity  Customer Focus  Organisational Pride  Mutual Respect & Trust  Innovation & Learning  Total Quality & Safety Figure 4 :- Nuclear Power Plant Installed by NTPC  Figure 5 :- Providing Schooling Facility within campus for best education 
  • 16. National Thermal Power Corporation (NTPC) 16 Figure 6:- Develop Green Belt by NTPC  Figure 7 :- Providing Health Care facility to Rural people 
  • 17. National Thermal Power Corporation (NTPC) 17 Figure 8:- Nuclear Power & Solar Power Plant Installed by NTPC  Figure 9 :- Empowering women by providing training for self employment 
  • 18. National Thermal Power Corporation (NTPC) 18 1.5.2 The Mission – Excellence in NTPC Kahalgaon “Develop and provide reliable power, related products and at competitive prices, integrating multiple energy sources with innovative and eco-friendly technologies and contribute to society.” 1.5.3 Statement of Values NTPC believes that any business conduct can be ethical only when it rests on the nine cores Values of Honesty, Integrity, Respect, Fairness, Purposefulness, Trust, Responsibility, Citizenship and Caring. These values are not to be lost sight of by anyone at NATIONAL THERMAL POWER CORPORATION (NTPC) Kahalgaon. Under any circumstances irrespective of the goals that are intended to be achieved. To them, means are as important as the ends. 1.5.4 Background NTPC, formerly known as National Thermal Power Corporation , with a market cap of more than $3 billion, was incorporated in 1929 and ranks amongst top performing Indian private sector companies in the country. The company operates in three business segments: Kahalgaon, Engineering, Procurement and Contracts (EPC) and Power. The company is the largest private sector Kahalgaon developer on ownership basis and is having presence in all high growth sectors viz; Roads, Railways, Sea Link, Cement and Airports. The company is having 11 roads projects worth `120 billion under its portfolio Further, it is also having 3 Metro projects worth `170 billion, 1 sea link project of `46 billion, 2 cement projects in Maharashtra and Madhya Pradesh worth `47 billion and 5 airports projects worth `5 billion. NTPC Kahalgaon has also emerged as the leading player in India in the Engineering, Procurement and Construction (EPC) segment of the power sector. NTPC is having a healthy EPC order book of `212 billion spread across power, Roads and Transmission projects. In addition to this, NTPC has also emerged as the largest private sector player in the utility sector. Currently, it is having power generation capacity of 2340 MW and 37,000 MW through NTPC Power. Under its Transmission segment, NTPC is having 5 projects worth `66 billion.
  • 19. National Thermal Power Corporation (NTPC) 19 NTPC also owns 38% stake in NTPC Power (Thermal Power) with an aggregate investment of `17.2 billion. R Power is likely to develop all future power generation assets in India and overseas with having 600 MW of operational capacity and over 20,000 MW under execution. Further, the company is targeting 5,000 MW of operating capacity by 2012. R Power is also having largest coal resources of 4 billion tones. 1.5.5 SUBSIDIARY & ASSOCIATE COMPANIES  NTPC Electric Supply Company Ltd.  NTPC Vidyut Vyapar Nigam Ltd.  Kanti Bijlee Utpadan Nigam Ltd.  Bhartiya Rail Bijlee Company Ltd.  Patratu Vidyut Utpadan Nigam Ltd.  NTPC-SAIL Power Co. Pvt. Ltd  Tamil Nadu Energy Co. Ltd.  Aravali Power Co. Pvt. Ltd  Mega Urja Nigam Pvt. Ltd. 1.6 BUSINESS PROFILE 1.6.1 Generation: As the integrated power utility NTPC Kahalgaon has setup; a full-fledged generation division having proven expertise in designing, engineering, erection, installation, commissioning, operations and maintenance of power projects. The division implements project plans for in house power projects and supports ventures undertaken by other affiliate companies. The division is fully integrated and has in house capabilities to address every aspect of power projects including:  Mechanical  Civil  Electrical  Instrumentation  Environmental
  • 20. National Thermal Power Corporation (NTPC) 20 The division also provides engineering consultancy to external agencies and projects The 39102 MW Generation capacity of the Division comes from five projects: • NTPC Kahalgaon - the 2340 MW multi fuel based thermal power station at Kahalgaon near Bhagalpur, Bihar • 8 MW Wind Farm Project at Jogimatti in the district of Chitradurga in Karnataka. • BSES Kerala Limited: The 165 MW combined cycle power station at Kochi, Kerala. • BSES Andhra Power Limited: The 220 MW combined cycle power plant at Samalkot in Andhra Pradesh. • Goa Power Station: The 48 MW naphtha based combined cycle power plant at Goa NTPC (National Thermal Power Corporation) distributes more than 36 billion units of electricity to over 30 million consumers across different parts of the country including Mumbai and Delhi in an area that spans over 1, 24,300 sq. kms. It also generates 941 MW of electricity, from its power stations located in Maharashtra, Andhra Pradesh, Kerala, Karnataka and Goa. NTPC Kahalgaon has emerged as the leading player in India in the Engineering, Procurement and Construction (EPC) segment of the power sector. In the last few years, NTPC Kahalgaon has expanded its foot-print much beyond the power sector. Currently, NTPC Kahalgaon group is engaged in the implementation of projects not only in the fields of generation, transmission, distribution and trading of power but also in other key infrastructural areas such as highways, roads, bridges, metro rail and other mass rapid transit systems, special economic zones, real estate, airports, semen. 1.6.2 Distribution: Distribution is the key to efficient and reliable power supply. Seven decades of experience and continuous investment in modernizing its distribution Kahalgaon have helped the company achieve the enviable distinction of operating its network with 99.93% reliability! The efforts made towards achieving higher levels of efficiency have reduced distribution losses to 12.01% - The lowest in the country!
  • 21. National Thermal Power Corporation (NTPC) 21 NTPC Energy Limited's Kahalgaon operations cover a population of 5000 within an area of about 384 sq. kilometers .NTPC Kahalgaon continually upgrades its distribution network. This is accomplished through a process of decentralized operation in supply management to maintain very high on-line reliability. 1.7. CRITICAL ASSESSMENT AND EVALUATION OF THE ORGANIZATION (SWOT ANALYSIS) Strengths:- 1. Good corporate image. 2. Complete range of product for transmission & distribution. 3. Established brand name with executive oriented program. 4. Strong & wide network of manpower across India. Weakness:- 1. The procurement process in the companies is cumbersome and subject to auditing. 2. Low exposure to the needs & dynamics of distribution business. 3. Role clarity on the requirement of being an equipment supplier or a solution provider. As there are very few supplier of equipment manufacturing plant. Opportunities:- 1. Huge Investment leading to greater demand of goods and services. 2. Demand leading to Industry operating at full & over capacity. 3. Better price realization. 4. Early birds to lean faster and thus achieve repeat order. Policy to bid from ultra mega power plant. 5. Vertical integration for supply chain management of coal by acquiring coal blogs. Threats:- 1. Purchases preference may be extended to distribution sector. 2. Increase in number of small contractor leading to price war. 3. Emergence of competitors in the market like Schneider, Reliance, Tata etc.
  • 22. National Thermal Power Corporation (NTPC) 22 4. Change in government policies for open trading or energy treading. 5. Reduce the time lag.
  • 23. National Thermal Power Corporation (NTPC) Department of Business Administration, TMBU, Academic year: 2016-18 SUGGESTION AND RECOMMENDATION TO THE ORGANIZATION The performance of company is very weak in financial manner, Earning Per Share, ROA, ROE, ROCE is reducing per year. It shows weak performance of the company The Employee turnover is quite high. Many productive man hours are wasted in order to get the new employee get accustomed to the working environment of the organization. The company can look at the root cause of this issue and try to reduce their employee turnover. No doubt, that retaining the talent is not an easy task for the private companies but a little appreciation and remuneration can really boost the morale of the employees. With the rapid change in the business environment and to keep its position in the sector, NTPC Kahalgaon Limited should focus on these key success factors: - Ensure optimum utilization of resources to enhance Return on Assets. Make ensure higher rate of Return On Equity which motivate the investors. EPS reduce year by year so company has to focus on reduction of cost that may be increase in EPS. Price to Book Ratio also reduce every year so, company make ensure market price stable or increasing position by increasing DPS. Organizational transformation for meeting the challenges due to changed environment. Wrestling growth opportunities in power sector business. 1.8. COMPETITORS There are many power generation companies in India but some major competitors of NTPC Kahalgaon in power generation sector are: ESSAR Power ltd Kirloskar Electric Company Tata Power Jaiprakash Hydro Power ltd Some major players in power distribution sector are: Brihanmumbai electricity supply & transport Calcutta electricity supply corporation Damodar valley corporation Karnataka power corporation ltd Torrent power
  • 24. National Thermal Power Corporation (NTPC) Department of Business Administration, TMBU, Academic year: 2016-18 Some major players in Kahalgaon sector are: L&T Ltd Punj Lloyd LANCO INDIA GMR Kahalgaon Maytas Infra Limited
  • 25. National Thermal Power Corporation (NTPC) 25 CHAPTER—II RESEARCH METHODOLOGY & RELEVANCE OF THE PROJECT 2.1 RESEARCH METHODOLOGY The previous chapter discussed the objectives of this study and in this chapter we will discuss about the research methodology which is followed to carry out this project i.e. the universe, locale of our study, Data Collection, data analysis and field experience. As in organizations like NTPC, finance department is a large department, a thorough study of its Financial Statement Analysis has been done broadly covering: Receivables Management, Cash Management, and Inventory Management. Universe of study: The universe of the study is Thermal power sector. Locale of study: Locale of study is NTPC Kahalgaon ltd EPC division which mainly deals in power sector projects. Data collection: The secondary data used is collected from the articles on Financial Analysis published in magazines and from the various papers by Ernst and Young and Price Water House Coopers & Websites also. The secondary data is collected from the employees working in NTPC finance department. An Interview was conducted with number of people working in Finance Department particularly in Accounts and tax department. Analysis of Data The study is qualitative in nature and not much primary data is there. So no analytical tools have been used in the preparation. The report has been prepared after doing a qualitative analysis of the data collected. Some bar charts, graphs and pie charts are used to make the data more understandable to the reader. Field Experience The research was a positive and enriching experience as it provided useful insights about the current practices in Debt and Assets management and the process through which it is handled in the real world. Besides this, there was immense learning about other facets of the organization and corporate world as a whole. Limitations The study and analysis is based on the figures available in the annual report of the organization published. Only some figures which are used by different departments will be made available as they are confidential and cannot be provided by the organization. The availability of time was limited for the analysis of the huge power project.
  • 26. National Thermal Power Corporation (NTPC) 26 2.2. Ratio Analysis:- A ratio analysis is a quantitative analysis of information contained in a company’s financial statements. Ratio analysis is based on line items in financial statements like the balance sheet, income statement and cash flow statement; the ratios of one item – or a combination of items - to another item or combination are then calculated. Ratio analysis is used to evaluate various aspects of a company’s operating and financial performance such as its efficiency, liquidity, profitability and solvency. The trend of these ratios over time is studied to check whether they are improving or deteriorating. Ratios are also compared across different companies in the same sector to see how they stack up, and to get an idea of comparative valuations. Ratio analysis is a cornerstone of fundamental analysis. While there are numerous financial ratios, most investors are familiar with a few key ratios, particularly the ones that are relatively easy to calculate. Some of these ratios include the current ratio, return on equity, the debt-equity ratio, the dividend payout ratio and the price/earnings (P/E) ratio. For a specific ratio, most companies have values that fall within a certain range. A company whose ratio falls outside the range may be regarded as grossly undervalued or overvalued, depending on the ratio. For example, if the average P/E ratio of all companies in the S&P 500 index is 20, with the majority of companies having a P/E between 15 and 25, a stock with a single-digit P/E would be considered undervalued, while one with a P/E of 50 would be considered overvalued. Of course, this ratio would typically only be considered as a starting point, with further analysis required to identify if these stocks are really as undervalued or overvalued as the P/E ratios suggest. As well, ratios are usually only comparable across companies in the same sector, since an acceptable ratio in one industry may be regarded as too high in another. For example, companies in sectors such as utilities typically have a high debt-equity ratio, but a similar ratio for a technology company may be regarded as unsustainably high. Ratio analysis can provide an early warning of a potential improvement or deterioration in a company’s financial situation or performance. Analysts engage in extensive number- crunching of the financial data in a company’s quarterly financial reports for any such hints.
  • 27. National Thermal Power Corporation (NTPC) 27 Successful companies generally have solid ratios in all areas, and any hints of weakness in one area may spark a significant sell-off in the stock. Certain ratios are closely scrutinized because of their relevance to a certain sector, as for instance inventory turnover for the retail sector and days sales outstanding (DSOs) for technology companies. 2.3 OBJECTIVE To study of financial statement of NTPC at NTPC Kahalgaon. which includes  Net income / equity = return on equity (ROE)  Net income / total assets = return on assets (ROA)  Stock price / earnings per share = P/E ratio The aim is to learn how to manage capital needs of the organization and to learn the different ways through which theoretical learning is applied practically in the organization. The project is aimed to learn and gain knowledge of the day to day working of the organization as to how does the different decision are taken and on what basis. The project will help in gaining the knowledge of different steps of raising the funds and their effective utilization to ensure adequate availability of funds. The various analysis will help the management to assess the performance, financial strength and weakness of the company. 2.4. SIGNIFICANCE OF THE PROJECT Financial Analysis is the process of identifying the financial strengths and weaknesses of the firm by properly establishing relationships between the items of the balance sheet and the profit & loss account. Financial analysis can be undertaken by management of the firm, viz. Owners, creditors, investors and others. Ratio analysis is a powerful tool of financial analysis. A ratio is defined as “the indicated quotient of two mathematical expressions” and as “the Relationship between two or more things”. Ratios help to summaries large quantities of financial data and to make qualitative judgment about the firm’s financial performance.
  • 28. National Thermal Power Corporation (NTPC) 28 2.5 CONCEPTUALIZATION Ratio Analysis is a form of Financial Statement Analysis that is used to obtain a quick indication of a firm's financial performance in several key areas. The ratios are categorized as Short-term Solvency Ratios, Debt Management Ratios, Asset Management Ratios, Profitability Ratios, and Market Value Ratios. Ratio Analysis as a tool possesses several important features. The data, which are provided by financial statements, are readily available. The computation of ratios facilitates the comparison of firms which differ in size. Ratios can be used to compare a firm's financial performance with industry averages. In addition, ratios can be used in a form of trend analysis to identify areas where performance has improved or deteriorated over time. Because Ratio Analysis is based upon Accounting information, its effectiveness is limited by the distortions which arise in financial statements due to such things as Historical Cost Accounting and inflation. Therefore, Ratio Analysis should only be used as a first step in financial analysis, to obtain a quick indication of a firm's performance and to identify areas which need to be investigated further. The pages below present the most widely used ratios in each of the categories given above. Please keep in mind that there is not universal agreement as to how many of these ratios should be calculated. You may find that different books use slightly different formulas for the computation of many ratios. Therefore, if you are comparing a ratio that you calculated with a published ratio or an industry average, make sure that you use the same formula as used in the calculation of the published ratio. Concepts  Short-term Solvency Ratios  Debt Management Ratios  Asset Management Ratios  Profitability Ratios  Market Value Ratios  Equations  
  • 29. National Thermal Power Corporation (NTPC) 29 CHAPTER-III FINANCIAL ANALYSIS 3.1 INTRODUCTION TO FINANCIAL ANALYSIS Financial analysis is the process of evaluating businesses, projects, budgets and other finance-related entities to determine their performance and suitability. Typically, financial analysis is used to analyze whether an entity is stable, solvent, liquid or profitable enough to warrant a monetary investment. When looking at a specific company, a financial analyst conducts analysis by focusing on the income statement, balance sheet and cash flow statement. Financial analysis is used to evaluate economic trends, set financial policy, build long-term plans for business activity, and identify projects or companies for investment. This is done through the synthesis of financial numbers and data. One of the most common ways to analyze financial data is to calculate ratios from the data to compare against those of other companies or against the company's own historical performance. For example, return on assets (ROA) is a common ratio used to determine how efficient a company is at using its assets and as a measure of profitability. This ratio could be calculated for several similar companies and compared as part of a larger analysis. Operational and financial Ratios:- 1. Earning Per Share Ratio:- Earnings per share (EPS) is the portion of a company's profit allocated to each outstanding share of common stock. Earnings per share serves as an indicator of a company's profitability. Calculated as: Earnings Per Share (EPS) When calculating, it is more accurate to use a weighted average number of shares outstanding over the reporting term, because the number of shares outstanding can change over time.
  • 30. National Thermal Power Corporation (NTPC) 30 However, data sources sometimes simplify the calculation by using the number of shares outstanding at the end of the period. Diluted EPS expands on basic EPS by including the shares of convertibles or warrants outstanding in the outstanding shares number. Earnings per share is generally considered to be the single most important variable in determining a share's price. It is also a major component used to calculate the price-to- earnings valuation ratio. Dividend Per Share - DPS Dividend per share (DPS) is the sum of declared dividends issued by a company for every ordinary share outstanding. Dividend per share (DPS) is the total dividends paid out by a business, including interim dividends, divided by the number of outstanding ordinary shares issued. A company's DPS is usually derived using the dividend paid in the most recent quarter, which is also used to calculate the dividend yield. DPS can be calculated by using the following formula: D - Sum of dividends over a period (usually 1 year) SD - Special, one time dividends S - Shares outstanding for the period Dividends over the entire year, not including any special dividends, must be added together for a proper calculation of DPS, including interim dividends. Special dividends are dividends which are only expected to be issued once and are not included. Interim dividends are dividends distributed to shareholders that have been declared and paid before a company has determined its annual earnings.
  • 31. National Thermal Power Corporation (NTPC) 31 Figure 10- Comparison of EPS & DPS PERFORMANCE RATIO:-  Return On Assets - ROA Return on assets (ROA) is an indicator of how profitable a company is relative to its total assets. ROA gives an idea as to how efficient management is at using its assets to generate earnings. Calculated by dividing a company's annual earnings by its total assets, ROA is displayed as a percentage. Sometimes this is referred to as "return on investment". The formula for return on assets is: Note: Some investors add interest expense back into net income when performing this calculation because they'd like to use operating returns before cost of borrowing.  Return On Equity - ROE 0 2 4 6 8 10 12 14 16 18 2011-12 2012-13 2013-14 2014-15 2015-16 EPS DPS
  • 32. National Thermal Power Corporation (NTPC) 32 Return on equity (ROE) is the amount of net income returned as a percentage of shareholders equity. Return on equity measures a corporation's profitability by revealing how much profit a company generates with the money shareholders have invested. ROE is expressed as a percentage and calculated as: Return on Equity = Net Income/Shareholder's Equity Net income is for the full fiscal year (before dividends paid to common stock holders but after dividends to preferred stock.) Shareholder's equity does not include preferred shares. Also known as "return on net worth" (RONW). Looking for stocks with the highest return on equity? Find out which online broker is best for you by reading Investopedia's reviews. The ROE is useful for comparing the profitability of a company to that of other firms in the same industry. There are several variations on the formula that investors may use: 1. Investors wishing to see the return on common equity may modify the formula above by subtracting preferred dividends from net income and subtracting preferred equity from shareholders' equity, giving the following: return on common equity (ROCE) = net income - preferred dividends / common equity. 2. Return on equity may also be calculated by dividing net income by average shareholders' equity. Average shareholders' equity is calculated by adding the shareholders' equity at the beginning of a period to the shareholders' equity at period's end and dividing the result by two. 3. Investors may also calculate the change in ROE for a period by first using the shareholders' equity figure from the beginning of a period as a denominator to determine the beginning ROE. Then, the end-of-period shareholders' equity can be used as the
  • 33. National Thermal Power Corporation (NTPC) 33 denominator to determine the ending ROE. Calculating both beginning and ending ROEs allows an investor to determine the change in profitability over the period. Things to Remember  If new shares are issued then use the weighted average of the number of shares throughout the year.  For high growth companies you should expect a higher ROE.  Averaging ROE over the past 5 to 10 years can give you a better idea of the historical growth.  Return On Capital Employed (ROCE) Return on capital employed (ROCE) is a financial ratio that measures a company's profitability and the efficiency with which its capital is employed. ROCE is calculated as: ROCE = Earnings Before Interest and Tax (EBIT) / Capital Employed “Capital Employed” as shown in the denominator is the sum of shareholders' equity and debt liabilities; it can be simplified as (Total Assets – Current Liabilities). Instead of using capital employed at an arbitrary point in time, analysts and investors often calculate ROCE based on “Average Capital Employed,” which takes the average of opening and closing capital employed for the time period. A higher ROCE indicates more efficient use of capital. ROCE should be higher than the company’s capital cost; otherwise it indicates that the company is not employing its capital effectively and is not generating shareholder value. BREAKING DOWN 'Return On Capital Employed (ROCE)' ROCE is a useful metric for comparing profitability across companies based on the amount of capital they use. Consider two companies, Alpha and Beta, which operate in the same industry sector. Alpha has EBIT of $5 million on sales of $100 million in a given year, while Beta has EBIT of $7.5 million on sales of $100 million in the same year. On the face, it may appear that Beta should be the superior investment, since it has an EBIT margin of 7.5% compared with 5% for Alpha. But before making an investment decision, look at the capital employed by both companies. Let’s assume that Alpha has total capital of $25 million and Beta has total capital of $50 million. In this case, Alpha’s ROCE of 20% is superior
  • 34. National Thermal Power Corporation (NTPC) 34 to Beta’s ROCE of 15%, which means that Alpha does a better job of deploying its capital than Beta. ROCE is especially useful when comparing the performance of companies in capital- intensive sectors such as utilities and telecoms. This is because unlike return on equity (ROE), which only analyzes profitability related to a company’s common equity, ROCE considers debt and other liabilities as well. This provides a better indication of financial performance for companies with significant debt. Adjustments may sometimes be required to get a truer depiction of ROCE. A company may occasionally have an inordinate amount of cash on hand, but since such cash is not actively employed in the business, it may need to be subtracted from the “Capital Employed” figure to get a more accurate measure of ROCE. For a company, the ROCE trend over the years is also an important indicator of performance. In general, investors tend to favor companies with stable and rising ROCE numbers over companies where ROCE is volatile and bounces around from one year to the next. Figure 11- Comparison of ROA, ROE and ROCE  Price-Earnings Ratio - P/E Ratio:- The price-earnings ratio (P/E ratio) is the ratio for valuing a company that measures its current share price relative to its per-share earnings. The price-earnings ratio is also sometimes known as the price multiple or the earnings multiple. 0 2 4 6 8 10 12 14 16 18 2011-12 2012-13 2013-14 2014-15 2015-16 ROA ROE ROCE
  • 35. National Thermal Power Corporation (NTPC) 35 The P/E ratio can be calculated as: Price-Earnings Ratio = Market Value per Share / Earnings per Share EPS is most often derived from the last four quarters. This form of the price-earnings ratio is called trailing P/E, which may be calculated by subtracting a company’s share value at the beginning of the 12-month period from its value at the period’s end, adjusting for stock splits if there have been any. Sometimes, price-earnings can also be taken from analysts’ estimates of earnings expected during the next four quarters. This form of price-earnings is also called projected or forward P/E. A third, less common variation uses the sum of the last two actual quarters and the estimates of the next two quarters.  VALUATION RATIOS:-  Personal Consumption Expenditures - PCE Personal consumption expenditures (PCE), or the PCE Index, measure price changes of consumer goods and services. Expenditures noted on the index include actual expenditures and expenditures that are attributed to households in the United States; data that pertains to services, durables and non-durables is measured through the index. Sharing similarities with the Consumer Price Index (CPI), the PCE is part of the personal income report issued by the Bureau of Economic Analysis of the Department of Commerce. BREAKING DOWN 'Personal Consumption Expenditures - PCE' The PCE is often considered predictable, and many analysts prefer to utilize the CPI because of its widely touted ability to aid in determining economic stability or lack thereof, due largely to the fixed basket of goods used. Inflation In the matter of gauging inflation, and the overall economic stability of the U.S., the Federal Reserve prefers not to lean on the go-to barometer of economic health. Because the CPI is the most well-known economic indicator, the PCE is largely forgotten. The Fed, however, prefers the PCE index when reviewing economic conditions and charting a course of action that impacts inflation and employment. The main reason for this is the range of expenditures included in the PCE. While the CPI helps clearly depict shifts or changes in consumer expenditures, it only reveals changes in
  • 36. National Thermal Power Corporation (NTPC) 36 those expenditures that fall within the pre-established fixed basket. The PCE, on the other hand, includes a great variety of expenses in homes across the country. The PCE is also weighted by data acquired through business surveys, which tend to be more reliable than the consumer surveys utilized by the CPI. Also, the PCE makes use of a formula that allows for changes in consumer behavior, changes occurring in the short term, an adjustment for which the regulation CPI formula doesn’t make room. These factors, combined, result in a more comprehensive inflation metric; the Fed depends upon the nuances the PCE reveals, because even a small amount of inflation is regarded as an indication of a growing and healthy economy. Durables vs Non-Durables The PCE is broken down into two large categories: goods and services. The major component of these two – goods – is then further broken down into durables and non- durables. Durable goods are items that last a household more than three years and typically carry larger price tags. Examples include cars, televisions, refrigerators, furniture and other similar items. Non-durable goods are labeled ‘transitory,’ meaning their life expectancy is typically not more than three years. These items are also generally much less costly and include products such as makeup, gasoline and clothing.  Price-To-Book Ratio - P/B Ratio The price-to-book ratio (P/B Ratio) is a ratio used to compare a stock's market value to its book value. It is calculated by dividing the current closing price of the stock by the latest quarter's book value per share. Also known as the "price-equity ratio". Calculated as: P/B Ratio = Market Price per Share / Book Value per Share where Book Value per Share = (Total Assets - Total Liabilities) / Number of shares outstanding
  • 37. National Thermal Power Corporation (NTPC) 37 A lower P/B ratio could mean that the stock is undervalued. However, it could also mean that something is fundamentally wrong with the company. As with most ratios, be aware that this varies by industry. This ratio also gives some idea of whether you're paying too much for what would be left if the company went bankrupt immediately. For more, check out Digging Into Book Value BREAKING DOWN 'Price-To-Book Ratio - P/B Ratio The P/B ratio reflects the value that market participants attach to a company's equity relative to its book value of equity. A stock's market value is a forward-looking metric that reflects a company's future cash flows. The book value of equity is an accounting measure that is based on the historic cost principle, and reflects past issuances of equity, augmented by any profits or losses, and reduced by dividends and share buybacks. The Differences between the Market and Book Value of Equity Due to accounting conventions on treatment of certain costs, the market value of equity is typically higher than the book value of a company, producing a P/B ratio above 1. Under certain circumstances of financial distress, bankruptcy or expected plunges in earnings power, a company's P/B ratio can dive below 1. Because accounting principles do not recognize brand value and other intangible assets, unless they are derived through acquisitions, all costs associated with creating intangible assets are expensed immediately. For example, research and development (R&D) costs must be expensed, reducing a company's book value. However, these R&D outlays can create unique production processes for a company, or result in patents that can bring royalty revenues going forward. While accounting principles favor a conservative approach in capitalizing costs, market participants may raise the stock price as a result of such R&D efforts, resulting in wide differences between the market and book values of equity. Advantages and Disadvantages to the P/B Ratio Investors find the P/B ratio useful because the book value of equity provides a relatively stable and intuitive metric that can be easily compared to the market price. Also, the P/B
  • 38. National Thermal Power Corporation (NTPC) 38 ratio can be used for firms with positive book values and negative earnings since negative earnings render price-to-earnings ratios useless, and there are fewer companies with negative book values than companies with negative earnings. However, when accounting standards applied by firms vary, P/B ratios may not be comparable, especially for companies from different countries. Also, P/B ratios can be less useful for services and information technology companies with little tangible assets on their balance sheets. Finally, the book value can become negative as a result of a long series of negative earnings, making the P/B ratio useless for relative valuation purposes.  Yield :- The yield is the income return on an investment, such as the interest or dividends received from holding a particular security. The yield is usually expressed as an annual percentage rate based on the investment's cost, current market value or face value. Yields may be considered known or anticipated depending on the security in question as certain securities may experience fluctuations in value. BREAKING DOWN 'Yield' The yield of an investment is tied to the risk associated with the aforementioned investment. The higher the risk is considered to be, the higher the associated yield potential. Except in the most secure investments, such as zero coupon bonds, a yield is not a guarantee. Instead, the listed yield is functionally an estimate of the future performance of the investment. Generally, the risks associated with stocks are considered higher than those associated with bonds. This can lead stocks to have a higher yield potential when compared to many bonds currently on the market. Stock Yields In regards to a stock, there are two stock dividend yields. If you buy a stock for $30 (cost basis) and its current price and annual dividend are $33 and $1, respectively, the cost yield will be 3.3% ($1/$30) and the current yield will be 3% ($1/$33). Bond Yields Bonds have multiple yield options depending on the exact nature of the investment. The coupon is the bond interest rate fixed at issuance. The current yield is the bond interest rate as a percentage of the current price of the bond. The yield to maturity is an
  • 39. National Thermal Power Corporation (NTPC) 39 estimate of what an investor will receive if the bond is held to its maturity date. Non- taxable municipal bondswill also have a tax-equivalent (TE) yield determined by the investor's tax bracket. Mutual Fund Yields Mutual funds have two primary forms of yields for consideration. The dividend yields are expressed as an annual percentage measure of the income that was earned by the fund's portfolio. The associated income is derived from the dividends and interest generated by the included investments. Additionally, dividend yields are based on the net income received after the fund's associated expenses have been paid, or at a minimum, accounted for. The SEC yield is based on the yields reported by particular companies as required by the Securities and Exchange Commission (SEC) and is based on an assumption that all associated securities are held until maturity. Additionally, the assumption exists that all income generated is reinvested. Like dividend yields, SEC yields also account for the presence of required fees associated with the fund, and allocates funds to them accordingly before determining the actual yield.  Enterprise-Value-To-Sales - EV/Sales Enterprise-value-to-sales is a valuation measure that compares the enterprise value (EV) of a company to the company's sales. EV-to-sales gives investors a quantifiable metric of how much it costs to purchase the company's sales. This measure is an expansion of the price-to-sales (P/S) valuation, which uses market capitalization instead of enterprise value. BREAKING DOWN 'Enterprise-Value-To-Sales - EV/Sales' EV-to-sales is perceived to be more accurate than P/S because market capitalization does not take a company's debt into account as well as enterprise value, and the debt needs to be paid back at some point. Generally, a lower the EV-to-sales means that a company is believed to be more attractive or undervalued. The EV-to-sales measure can be negative when the cash in the company is greater than the market capitalization and debt structure, signaling that the company can essentially be bought with its own cash.
  • 40. National Thermal Power Corporation (NTPC) 40 The EV-to-sales measure can be slightly deceptive. A high EV-to-sales can be a sign that investors believe the future sales will greatly increase. A lower EV-to-sales can signal that the future sales prospects are not very attractive. Compare the EV-to-sales to that of other companies in the industry, and look deeper into the company you are analyzing. EV-to-sales values usually are between 1 and 3. Enterprise-Value-To-Sales Calculation and Example:- The calculation of EV-to-sales is simply the enterprise value of the company divided by its sales. The enterprise value of a company is calculated using the following simplified formula: As an example, assume a company reports sales for the year of 70 million. The company has 10 million of short-term liabilities on the books and 25 million of long-term liabilities. It has 90 million worth of assets, of which 20% is cash. Lastly, the company has 5 million shares of common stock outstanding and the current price of the stock is RS.25 per share. Using this scenario, the company's enterprise value is: EV = (5,000,000 x 25) + (10,000,000 + 25,000,000) - (90,000,000 x 0.2) = 125,000,000 + 35,000,000 - 18,000,000 = 142,000,000 Next, to find the EV-to-sales, simply take the EV and divided by sales. In this example, the EV-to-sales is: EV-to-sales = 142,000,000 / 70,000,000 = 2.03 A slightly more complicated version of enterprise value with a few more variables is sometimes used. The more complicated version's formula is: EV = market capitalization + debt + preferred shared capital + minority interest - cash - cash equivalents  Enterprise value/EBITDA
  • 41. National Thermal Power Corporation (NTPC) 41 Enterprise value/EBITDA (more commonly referred to by the acronym EV/EBITDA) is a popular valuation multiple used in the finance industry to measure the value of a company. It is the most widely used valuation multiple based on enterprise value and is often used in conjunction with, or as an alternative to, the P/E ratio (Price/Earnings ratio) to determine the fair market value of a company. An advantage of this multiple is that it is capital structure-neutral, and, therefore, this multiple can be used to directly compare companies with different levels of debt.[1] The EV/EBITDA multiple requires prudent use for companies with low profit margins (i.e., for an EBITDA estimate to be reasonably accurate, the company under evaluation must have legitimate profitability). Often, an industry average EV/EBITDA multiple is calculated on a sample of listed companies to use for comparison to the company of interest (i.e., as a benchmark). An example of such an index is one that provides an average EV/EBITDA multiple on a wide sample of transactions on private companies in the Eurozone.[2] The reciprocate multiple EBITDA/EV is used as a measure of cash return on investment.  EBIT/EV Multiple The EBIT/EV multiple is a financial ratio used to measure a company's return on investment. While the EBIT/EV ratio is not very commonly used, it does have certain advantages in comparing companies. First, using EBIT as a measure of profitability eliminates the potential distorting effects of differences in tax rates. Secondly, using EBIT/EV normalizes for the effects of different capital structures. BREAKING DOWN 'EBIT/EV Multiple' The EBIT/EV ratio can provide a better comparison than a more conventional net income/equity ratio. A downside to this ratio is that it does not normalize for depreciation and amortization costs. Thus, there are still potential distorting effects when companies use differing methods in accounting for fixed assets.  Enterprise Value (EV) Enterprise Value, or EV for short, is a measure of a company's total value, often used as a more comprehensive alternative to equity market capitalization. The market capitalization
  • 42. National Thermal Power Corporation (NTPC) 42 of a company is simply its share price multiplied by the number of shares a company has outstanding. Enterprise value is calculated as the market capitalization plus debt, minority interest and preferred shares, minus total cash and cash equivalents. Often times, the minority interest and preferred equity is effectively zero, although this need not be the case.  EV = market value of common stock + market value of preferred equity + market value of debt + minority interest - cash and investments.  Capital Employed:- Capital employed, also known as funds employed, is the total amount of capital used for the acquisition of profits. It is the value of all the assets employed in a business and can be calculated by adding fixed assets to working capital or subtracting current liabilities from total assets. By employing capital, you make an investment. BREAKING DOWN 'Capital Employed' Capital employed is a frequently used term but is very difficult to define because there are so many contexts in which it can be used. All definitions generally refer to the investment required for a business to function. It refers to the value of assets used in the operation of a business. Put simply, it is a measure of the value of assets minus current liabilities. Both of these measures can be found on the balance sheet. A current liability is the portion of debt that must be paid back within one year. In this way, capital employed is a more accurate estimate of total assets. Like return on assets, investors use return on capital employed to get an approximation for what their return might be in the future.
  • 43. National Thermal Power Corporation (NTPC) 43 Figure 12- Enterprise Value – Capital Employed Ratio 0 0.2 0.4 0.6 0.8 1 1.2 2011-12 2012-13 2013-14 2014-15 2015-16 Enterprise Value/Capital Employed Enterprise Value/Capital Employed
  • 44. National Thermal Power Corporation (NTPC) 44 RATIO ANALYSIS Parameters MAR'16 (₹ Cr.) MAR'15 (₹ Cr.) MAR'14 (₹ Cr.) MAR'13 (₹ Cr.) MAR'12 (₹ Cr.) Operational & Financial Ratios: Earnings Per Share (Rs) 12.42 12.48 13.31 15.30 11.19 DPS(Rs) 3.35 2.50 5.75 5.75 4.00 Book NAV/Share(Rs) 107.67 99.03 104.08 97.49 87.22 Performance Ratios: ROA(%) 4.79 5.27 6.15 7.88 6.53 ROE(%) 12.02 12.29 13.21 16.57 13.24 ROCE(%) 7.56 8.30 11.18 14.06 11.97 Valuation Parameters: PER(x) 10.37 11.81 9.01 9.28 14.54 PCE(x) 6.78 7.99 6.54 7.31 11.17 Price / Book(x) 1.20 1.49 1.15 1.46 1.87 Yield(%) 2.60 1.70 4.79 4.05 2.46 EV / Net Sales(x) 2.79 2.68 2.12 2.43 2.74 EV / Core EBITDA(x) 10.49 10.69 7.40 7.89 10.06 EV / EBIT(x) 14.76 14.60 9.26 8.62 12.06 EV / CE(x) 0.88 0.96 0.82 0.93 1.14 M Cap / Sales 1.51 1.66 1.37 1.78 2.16 Growth Ratio: Core Operating Income Growth 13.97 13.02 31.74 10.52 22.52 Operating Profit Growth 2.33 -10.96 1.82 19.91 5.66 Net Profit Growth -0.47 -6.23 -13.03 36.81 1.33 BVPS Growth 8.73 -4.85 6.75 11.77 6.65 Advances Growth 0.00 0.00 0.00 0.00 0.00 EPS Growth(%) -0.47 -6.23 -13.03 36.82 1.33
  • 45. National Thermal Power Corporation (NTPC) 45  Cash Flow:- Cash flow is the net amount of cash and cash-equivalents moving into and out of a business. Positive cash flow indicates that a company's liquid assets are increasing, enabling it to settle debts, reinvest in its business, return money to shareholders, pay expenses and provide a buffer against future financial challenges. Negative cash flow indicates that a company's liquid assets are decreasing. Net cash flow is distinguished from net income, which includes accounts receivable and other items for which payment has not actually been received. Cash flow is used to assess the quality of a company's income, that is, how liquid it is, which can indicate whether the company is positioned to remain solvent. BREAKING DOWN 'Cash Flow' The accrual accounting method allows companies to count their chickens before they hatch, so to speak, by considering credit as part of a company's income. "Accounts receivable" and "settlement due from customers" can appear as line items in the assets portion of a company's balance sheet, but these items do not represent completed transactions, for which payment has been received. They do not, therefore, count as cash. (Note that the credit vs. cash distinction is not the same as it is in everyday terminology; proceeds from credit card transactions are considered cash once they are transferred.) The opposite can also be true. A company may be receiving massive inflows of cash, but only because it is selling off its long-term assets. A company that is selling itself for parts may be building up liquidity, but it is limiting its potential for growth in the long term, and perhaps setting itself up to fail. In the same vein, a company may be taking in cash by issuing bonds and taking on unsustainable levels of debt. For these reasons it is necessary to view a company's cash flow statement, balance sheet and income statement together. Cash Flow Statement Often called the "statement of cash flows," the cash flow statement indicates whether a company's income is languishing in the form of IOUs – not a sustainable situation in the long term – or is translating into cash flow. Even very profitable companies, as measured by their net incomes, can become insolvent if they do not have the cash and cash-equivalents to settle short-term liabilities. If a company's profit is tied up in accounts receivable, prepaid expenses and inventory, it may not have the liquidity to survive a downturn in its business or
  • 46. National Thermal Power Corporation (NTPC) 46 a lawsuit. Cash flow determines the quality of a company's income; if net cash flow is less than net income, that could be a cause for concern. Cash flow statements are divided into three categories: operating cash flow, investing cash flow and financing cash flow. Operating cash flows are those related to a company's operations, that is, its day-to-day business. Investing cash flows relate to its investments in businesses through acquisition; in long-term assets, such as towers for a telecom provider; and in securities. Financing cash flows relate to a company's investors and creditors: dividends paid to stockholders would be recorded here, as would cash proceeds from issuing bonds. Figure 13:- Cash Flow . -25000 -20000 -15000 -10000 -5000 0 5000 10000 15000 20000 2011-12 2012-13 2013-14 2014-15 2015-16 Opening cash Cash flow from operating activity Cash flow from investing activity Cash flow from financing activity Closing Cash & equivalent
  • 47. National Thermal Power Corporation (NTPC) 47 Cash Flow Statement Parameters MAR'16 (₹ Cr.) MAR'15 (₹ Cr.) MAR'14 (₹ Cr.) MAR'13 (₹ Cr.) MAR'12 (₹ Cr.) Net Profit Before Taxes 10,058.67 10,546.65 13,904.65 16,578.63 12,326.16 Adjustments for Expenses & Provisions 8,657.47 6,374.52 4,675.71 2,409.25 1,663.06 Adjustments for Liabilities & Assets -2,876.89 -766.54 -291.92 -597.13 -2,207.08 Cash Flow from operating activities 14,503.53 14,234.70 15,732.18 15,495.17 10,709.85 Cash Flow from investing activities - 18,422.65 - 14,562.60 - 13,979.71 - 14,016.89 -7,880.54 Cash Flow from financing activities -4,436.38 -1,878.08 -3,308.99 -752.41 -2,869.08 Effect of exchange fluctuation on translation reserve 0.00 0.00 0.00 0.00 0.00 -8,355.50 -2,205.98 -1,556.52 725.87 -39.77 Opening Cash & Cash Equivalents 13,105.41 15,311.37 16,867.70 16,141.83 16,181.60 Cash & Cash Equivalent on Amalgamation / Take over / Merger 0.00 0.00 0.00 0.00 0.00 Cash & Cash Equivalent of Subsidiaries under liquidations 0.00 0.00 0.00 0.00 0.00 Translation adjustment on reserves / op cash balalces frgn subsidiaries 0.00 0.00 0.00 0.00 0.00 Effect of Foreign Exchange Fluctuations 0.08 0.02 0.19 0.00 0.00 Closing Cash & Cash Equivalent 4,749.99 13,105.41 15,311.37 16,867.70 16,141.83
  • 48. National Thermal Power Corporation (NTPC) 48 CHAPTER-IV FACTS OF THE PROJECT & COMPARITIVE ANALYSIS 4.1 FACTS In order to determine Financial position of NTPC on the front of procurement and utilization of funds, we have accumulated data for the last five years and tried to analyze the going of NTPC on various fronts of Financial. In this way, we’ll be able to better understand the nature of change (if any) in the working capital situation of the organization. So first we’ll look at various working capital ratios for the past five years and examine the findings. 4.1.1 WORKING CAPITAL RATIO The difference between current assets and current liabilities excluding short term bank borrowing is called net working capital (NWC). Net Working Capital is sometimes used as a measure of a firm’s liquidity. Net Working Capital = Current Assets-Current Liabilities Net Working Capital Ratio= Net Working Capital Net Assets Net working capital measures the firm’s potential reservoir of funds. Analysis: As it is shown in the graph, the following observations can be made:  A company having a higher NWC ratio has a greater ability to meet its current obligations. From a conservative position of 2012 where the ratio was as high as 0.42, it has now settled at 0.10 which is slightly on the lower side As this ratio represents a firm’s potential reservoir of funds, a declining trend should be taken seriously and  appropriate remedial measures need to be taken so as to avert a more troubled situation
  • 49. National Thermal Power Corporation (NTPC) 49 4.1.2 CURRENT RATIO Current ratio is calculated by dividing current assets by current liabilities: Current Ratio = Current Assets Current Liabilities Current assets include cash and those assets that can be converted into cash within a year, such as marketable securities, debtors, inventories, loans and advances. All the obligations maturing within a year are included in current liabilities. Current liabilities include creditors, bills payable, accrued expenses, short term bank loan, income tax liability and long-term debt maturing in the current year. Significance  It indicates the availability of current assets in rupees for every one rupee of current liability. A ratio of greater than one means that the firm has more current assets than current claims against them. In India, the conventional rule is to have a ratio of 1.33 (internationally it is 2).  The current ratio represents the margin of safety for the creditors. The higher the current ratio, the greater the margin of safety; the larger the amount of current assets in relation to current liabilities, the more the firm’s ability to meet its current obligations. Analysis For the year 2012, NTPC had a current ratio of 2.99 which got offset during the subsequent years reaching as low as 0.95 in 2014.The situation got better in 2015 with a ratio of 1.49 but again it has become critical with a ratio of 1.09 at the end of FY 2016. A company with a falling current ratio needs to take strict actions otherwise in longer run, the firm can found themselves in a difficult situation to clear their current liabilities.
  • 50. National Thermal Power Corporation (NTPC) 50 . 4.1.3 ACID RATIO TEST (Liquid/Quick Ratio) This ratio establishes the relationship between quick or liquid assets and current liabilities. Quick Ratio = Current Assets - Inventors Current Liabilities An asset is liquid if it can be converted into cash immediately without a loss of value. E.g. Cash, Debtors, Bills receivable and marketable securities. Inventories are considered to be less liquid as it requires time for realizing into cash, their value also has tendency to fluctuate. Significance Generally a quick ratio of 1:1 is considered to represent a satisfactory current financial condition. This test is more significant as compare to current ratio to fulfill the firm’s obligations. NTPC has a quick ratio of 1.06 at the end of FY2016 which is consistent with the current ratio for the same year. Generally a quick ratio of 1:1 is considered to represent a satisfactory current financial situation, but it does not imply a sound financial position. It should be kept in mind that all debtors may not be liquid, and cash may be immediately needed to pay operating expenses. Thus a company with a high value of quick ratio can suffer from shortage of funds if it has slow paying, doubtful and long duration outstanding debtors. On other hand, a company with a low value of quick ratio may really be operating with prosperity and paying its obligations in time if it has been turning over its inventories efficiently. 4.1.4 CASH RATIO It shows the relationship between absolute liquid or super quick current assets and liabilities. Absolute liquid assets include cash, bank balances, and marketable securities. Since cash is the most liquid asset, a financial analyst may examine cash ratio and its equivalent to current liabilities. Trade investments or marketable securities are equivalent of cash; therefore, they may be included in the computation of cash ratio. Cash Ratio = Cash + Marketable Securities Current Liabilities
  • 51. National Thermal Power Corporation (NTPC) 51 The situation of 2012 is never recommended to have that much cash sitting idle with the company. In the subsequent years the company has put the cash up to use by investing it in different projects thus maintaining a cash ratio of 4-5%. 1) There is nothing to be worried about the lack of cash if the company has reserve borrowing power. In India, firms have credit limits sanctioned from banks, and can easily draw cash. 4.1.5 INVENTORY TURNOVER RATIO Inventory turnover is calculated by dividing the cost of goods sold by the average inventory. This ratio indicates the efficiency of the firm in producing and selling its product, by indicating the number of times the inventory has been converted into sales during the period. 1. This ratio indicates the efficiency of the firm with which it manages and utilizes its assets, the speed with which the assets are converted into sales. As is evident from the graph, NTPC has managed to outperform its previous year performances consistently. 2. This comes out as a good sign of the efficiency of the management in converting its assets into sales. The ratio also implies continuous improvement in the operations of the company. 4.1.6 DEBTOR’S TURNOVER A Firm sells goods for cash and credit. Credit is used as a marketing tool by a no. of companies. When the firm extends credits to its customers, debtors (accounts receivables) are created. Debtors are convertible into cash over a short period of time, therefore included in the current assets. Debtor’s turnover is found by dividing credit sales by average debtors. Average debtors are nothing but the average of the opening and closing balances of debtors. Average Debtor = Debtors at the beginning of the year + Debtors at the end of the year 2 Debtors Turnover = Net Sale Average Debtors Net credit sales consist of gross credit sales minus sales return. When the information about credit sales, opening and closing balances of trade debtors is not available then the ratio can be calculated by dividing total sales by closing balances of trade debtors. Debtors Turnover Ratio = Total sales Trade Debtors Significance:
  • 52. National Thermal Power Corporation (NTPC) 52 Debtors Turnover indicates the number of times debtors turnover each year. Generally, the higher the value of debtors turnover, the more efficient the management of the company. Analysis: 1) As stated earlier, the higher the value of debtors turnover, the more efficient the management of the company. But as it is evident from the graph that the ratio is dipping with each successive year, it serves as a sign of caution for the management to look after. 2) Also, this ratio must be seen in conjunction with the creditors‟ turnover ratio. Being a Capital intensive company, it is still considered if your debtors‟ turnover is fairly good in comparison with creditors‟ turnover. But nonetheless the management should keep a vigil eye. 4.1.7 CREDITORS TURNOVER Creditors’ turnover ratio indicates the number of times sundry creditors have been paid during a year. It is calculated to judge the requirements of cash for paying sundry creditors. It is calculated by dividing the net credit purchases by average creditors. Creditors Turnover = Trade Creditor Purchases Average Creditors Average Creditors = Opening Balance of Creditors + Closing Balance of Creditors 2 Net credit purchases consist of gross credit purchases minus purchase return. When the information about credit purchases, opening and closing balances of trade creditors is not available then the ratio is calculated by dividing total purchases by the closing balance of trade creditors. Credit Turnover Ratio = Total Purchases Total Trade Creditors Significance: A high creditor’s turnover ratio or a lower credit period ratio signifies that the creditors are being paid promptly. This situation enhances the credit worthiness of the company. However a very favorable ratio to this effect also shows that the business is not taking the full advantage of the credit facilities allowed by the creditors. We can interpret this ratio in exactly the same way as the debtors’ turnover ratio. Analysis: As is evident, the company has tried to maintain a moderate creditor’s ratio so as to avail the full advantage of the credit facility as well as to maintain its rapport with its creditors. The ratio at the end of FY2016 stands at 4.23 as compared to the debtors‟ turnover ratio of 2.58 in the same financial year.
  • 53. National Thermal Power Corporation (NTPC) 53 4.1.8 CURRENT ASSETS TO TOTAL ASSETS RATIO This ratio depicts the relationship between the current assets and the total assets. The total assets of a company comprises of both net fixed assets and current assets. Total Assets = Net Fixed Assets + Current Assets Significance: As the working capital management of a company depends upon its current assets, it is of great significance to know how much of the total assets are current. The level of current assets helps us to keep our business afloat 1) NTPC during the last five years has managed to keep a pretty healthy current assets ratio with an average of 50%. For an Kahalgaon company such levels of current assets help to carry on daily operations without any difficulty and projects completed without such glitches also results in huge cost savings thus ultimately resulting in higher profits. 2) A high ratio also guarantees that the company would never default on its current obligations thus maintaining a steady relationship with its suppliers. 4.1.9 WORKING CAPITAL TURNOVER RATIO It shows the relationship between the working capital and sales. Working Capital Turnover = Sales Working Capital The firm should maintain a steady working capital position. It should have adequate working capital to run its business operations. Both excessive and inadequate working capital positions are dangerous from a firm’s point of view excessive working capital means holding costs and idle funds which earn no profits for the firms. Paucity of working capital not only impairs firm’s profitability but also results in production inefficiencies and interruptions and also sales disruption. From the above two graphs, the relationship between working capital and net sales is depicted. If we look at the results of the second graph, for FY 2016 the ratio of WC to sales is 0.24 i.e. for one rupee of sales, the company needs Rs 0.24 of net current assets (working capital). This gap will be met from bank borrowings and long term sources of funds.
  • 54. National Thermal Power Corporation (NTPC) 54 CHAPTER – V RECOMMENDATIONS AND THE WAY FORWARD The following recommendations are made to the authorities at NTPC Kahalgaon in order to maintain and improve on their current performance. The recommendations made are based purely on my understanding of the situation. Some of the major things which I would like the authorities to take notice of include:  Optimum Utilization of resources:- NTPC has to focus on optimum utilization of resources that ensure the rational return on capital employed. It is found that during the course of analysis the ROA, ROE and ROCE continuously reduce by last five years.  Dividend –Per- Share- During the course of Financial Analysis it is also found that rate of DPS is low as compare to ‘Earning Per share’ which may be discourage the investors to invest their money in NTPC.  Followed in India. Current ratio indicates the ability of a company to stay a floater respective of the prevailing market situations. Internationally, a current ratio of 2:1 is accepted. The investors also seek this ratio in order to examine whether the company has adequate current resources so that it does not default on its obligations and is able to generate sufficient returns to maximize shareholder’s money.  Debtor’s turnover ratio needs a tune up as against creditor’s turnover. This ratio helps to examine whether the management of the concerned organization is not being complacent in recovery of its debts on time. Generally it is required that debtors turnover ratio be high as compared to creditors turnover which implies that the firm is generating sales adequate enough to cover its production cost. If we look at the situation for NTPC, the ratios were fine enough until FY014 but then afterwards the debtor’s turnover took a dip but because of adequate liquidity the management is able to take care of its obligations as for now. But if a proper solution is not formulated then it can become a huge problem which will affect not only the performance of the firm but may also deteriorate the confidence of the investors in the company.  The inventory turnover ratio for NTPC has been a success story for the last couple of years so the management should do everything possible thing to maintain
  • 55. National Thermal Power Corporation (NTPC) 55 this inclination in the coming years and try to encourage its human resources to keep up the good work.  With many a projects in line and at different levels of execution, it is required that all the aspects are dealt with equal importance whether it is the case of long term ratios or the short term ratios. The company has so many projects in line for which it will require funds. With stellar performance in various sectors it has the confidence of investors. So the management just need to continue on the good work.  Up to now the Company enjoys the top end ratings of ‘AA+’ and ‘AA’ from CRISIL and FITCH respectively. So the management must make sure that investor’s confidence remains the same. Some of the recent initiatives of NTPC are:  company is also mulling to raise funds worth `3.6 billion via non-convertible debentures.  In the metro segment, NTPC intends to increase the frequency of trains at the Airport express metro link in Delhi and thereby increase the number of daily commuters to 50,000 passengers per day by the end of FY13E and to around 100,000 by FY15- 16E. Besides, the company has also qualified for Jaipur Metro Rail project Phase-I, along with other three bidders.  NTPC is presently working in the development of five power transmission projects across the North-western part of the country. Of which, the WRSS project is likely to see completion by the end of 2016, providing higher revenue visibility for FY17. Meanwhile, the six EHV stations commissioned in Mumbai also ensure hassle free power transmission in the city
  • 56. National Thermal Power Corporation (NTPC) 56 CONCLUSION Performance of the NTPC in the fields of earning per share decrease again and again from last four continuous years i.e. (from 2013 to 2016) while dividend per share was constant in 2013 to 2014 but in the F.Y. 14-15 is decreased by 56.52% when earning per share decrease only by 6.23% from previous years. However, we can see that in year 2015-16 DPS increase by 34% from previous year when EPS decrease by 0.48%. ROA decrease since 2012-13, which shows the assets involved in the business not utilized properly and company has to focus on it. It is also find that Return on Equity is reduce year over year since FY 2012-13 that shows the performance of the company in the aspect of earning is not good. We can see in the graph it clearly. Return of capital employed is also reducing since F.Y.-2012-13 those stats that utilization of capital is not in good position. Enterprise value decreases as compare to capital Employed. We can see that where in Financial Year 2011-12 EV/CE Ratio was 1.14, in Financial Year 2012-13 decreases by 18.42% and in Financial Year 2013-14 decreases by 11.82 from previous years while next FY 2014-15 Enterprise value increase by 17.07% from previous year but in FY 2015-16 it again decrease by 8.33 %. Therefore, it is concluded that performance of the company is not up to the mark because of that company fails to ensure optimum utilization of resources that result market price of equity shares are fluctuate every year. Therefore, it suggested that company has to ensure optimum utilization of resources that maximize the profit and help to increase Market price of shares that also will improve the Enterprise value.
  • 57. National Thermal Power Corporation (NTPC) 57 BIBLIOGRAPHY INTERNET SITES  www.ntpc.com  www.Thermal power.com  www.businessworld.in  www.lancogroup.com  www.gmrgroup.com  www.larsentoubro.com  www.wikipedia.org  www.investopedia.com NEWSPAPERS  Financial express  Economic Times BOOKS, JOURNALS and REFERENCES:-  Hrishikesh Bhattacharya, Working capital management - Strategies and techniques, Nov. 2014, published by Prentice Hall India  Financial Management – I.M Pandey  RP Rustagi’s ― Financial Management  Trends in working capital management & its impact—K Padachi (2006)   Impact of working capital management policies on profitability of a firm—S Vishnanai (2007)  An analysis of working capital management—V Ganeshan (2007)   Effects of working capital management on SME profitability—PJ Gareia Tervel (2007)  International Journal of Economics and Finance—K Anagnostopoulos (2009)   Relationship between working capital management and profitability—Amarjeet Gill, Nahum Biger, NeilMathur (2010)  African Journal on Finance and Management—WM Visemith (2004)  Journal of Corporate Finance—Elsevier  Asian Journal of Finance—K Saleem (2012)