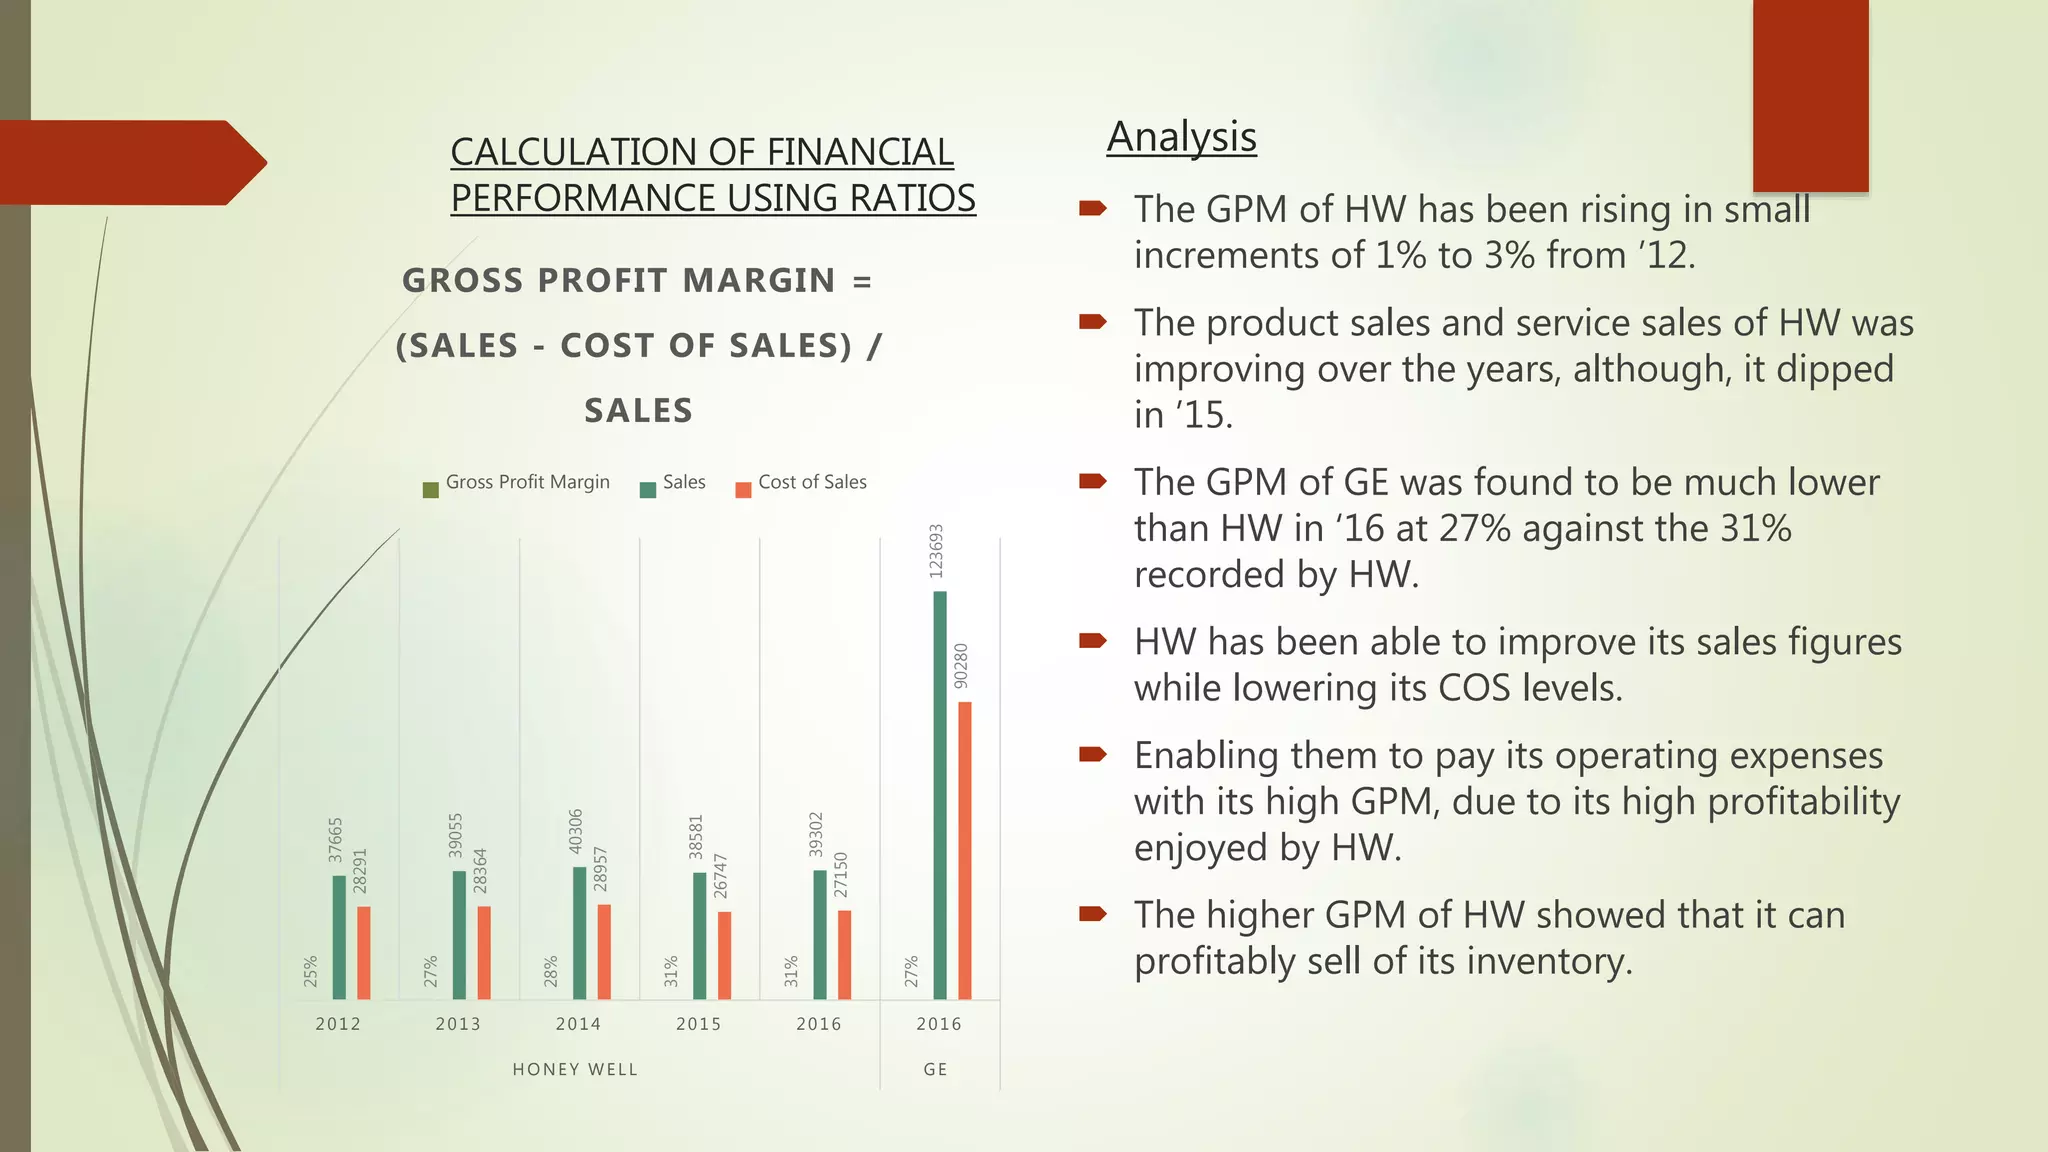
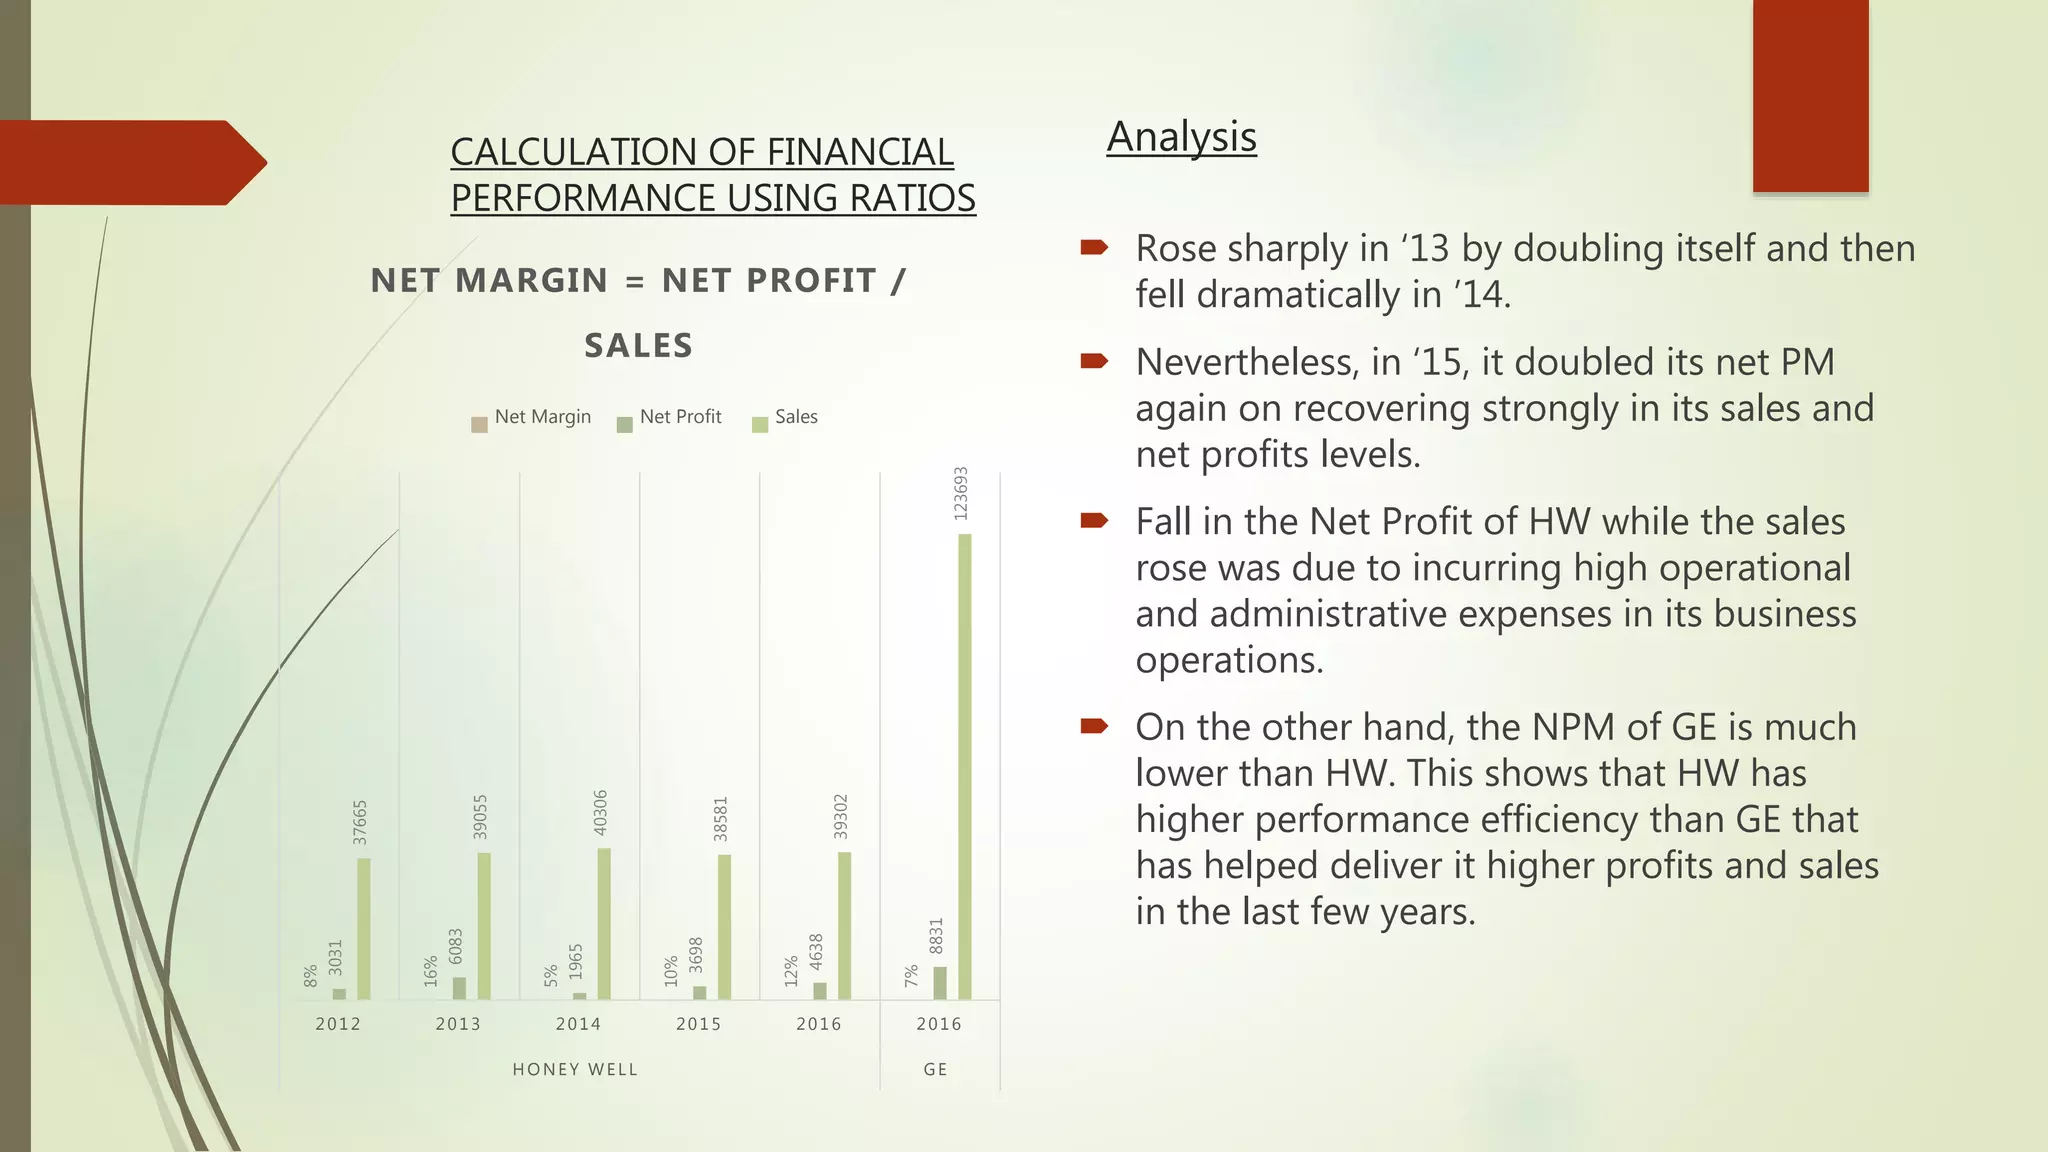
Financial Performance
Analysis
Location: University of Wales Trinity Saint David (London)
Presented by: Ibrahim Tasira | Lecturer: Jia Miao
Roll number: 1705750
AGENDA
 INTRODUCTION
 BACKGROUD OF HONEYWELL
 CALCULATION OF FINANCIAL PERFORMANCE USING RATIOS
 PROJECTION ABOUT FUTURE PERFORMANCE OF HONEYWELL
 RECOMMENDATIONS
 PROS & CONS OF RATIO ANALYSIS
 CONCLUSION
INTRODUCTION
 Financial performance of an organisation decides its attractiveness for investment
and the effectiveness of management.
 Honeywell is the firm that has been selected.
 We will analyse financial performance of Honeywell using ratios that are calculated
for the past five years ranging from 2012 to 2016.
 Ratio analysis is useful in capturing a good idea on the level of financial
management by a firm.
 Its liquidity levels, debt, profitability and other aspects can inform investors about
the risks and strengths of investing in the company.
 Different set of ratios will be calculated for Honeywell for determining its
profitability, liquidity, efficiency and leverage.
BACKGROUD OF HONEYWELL
 $39-$40 billion in revenues, 50% of it outside of
U.S.
 Nearly 130,000 employees operating in 100
countries.
 Honeywell is an American based firm that has
125 years of history involved in manufacturing of
engineering systems, aerospace systems and
commercial products.
 ‘Honeywell’- The inventor of furnace regulator
and alarm (1885).
 It has distributors around the world and made
use of entry modes such as wholly owned
subsidiaries, joint ventures, mergers, acquisitions
and affiliations.
 The firm has its headquarters in Morristown
located in New Jersey.
 The quality of materials is of high standards and
its products are highly credibility.
 Is one of the fortune 500 companies with
ranking 77.
Aerospace
32%
Automation
41%
Transportation
13%
Specialty
Materials
14%
CALCULATION OF FINANCIAL
PERFORMANCE USING RATIOS
 Improved till ‘14 then suffered huge decline in
‘15 before recovering in 2016.
 However, the current ratio of GE was found to
be much higher than of Honeywell in ‘16.
 The optimum current ratio of an organisation
should be 2:1, nevertheless it was GE that was
near to that levels.
 The dip in ‘15 is due to decrease in current
assets and increase in current liabilities
attributed to unfavourable impact of
fluctuation in foreign currency.
 However, it improved in ‘16 due to effective
product mix and lesser foreign currency
translation impacts.
1.35
1.49
1.50
1.25
1.41
1.85
17598
21164
22191
23053
23058
151114
13045
14181
14773
18371
16331
81580
2012 2013 2014 2015 2016 2016
H O NEY W EL L GE
CURRENT RATIO = CURRENT
ASSETS/ CURRENT LIABILTIES
Current Ratio Current Assets Current Liabilities
Analysis
CALCULATION OF FINANCIAL
PERFORMANCE USING RATIOS
 Similarly, the QR consistently rose till ’14 then
fell heavily before marginal recovery.
 This was due to a huge decline in Cash &
Cash Equivalent of HW while its short term
borrowing rose, weakening of € and change
in industry conditions and global economic
growth.
 So, HW don’t have enough quick asset to pay
its obligation forcing them to sell their capital
assets or closing unprofitable business.
 HW needs to augment its CA and decrease
their CL.
1.02
1.19
1.20
1.01
1.14
1.58
17598
21164
22191
23053
23058
151114
4235
4293
4405
4420
4366
22354
13045
14181
14773
18371
16331
81580
2012 2013 2014 2015 2016 2016
H O NEY W EL L GE
QUICK RATIO = CURRENT
ASSETS - INVENTORY /
CURRENT LIABILTIES
Quick Ratio Current Assets Inventory Current Liabilities
Analysis
CALCULATION OF FINANCIAL
PERFORMANCE USING RATIOS  The GPM of HW has been rising in small
increments of 1% to 3% from ’12.
 The product sales and service sales of HW was
improving over the years, although, it dipped
in ’15.
 The GPM of GE was found to be much lower
than HW in ‘16 at 27% against the 31%
recorded by HW.
 HW has been able to improve its sales figures
while lowering its COS levels.
 Enabling them to pay its operating expenses
with its high GPM, due to its high profitability
enjoyed by HW.
 The higher GPM of HW showed that it can
profitably sell of its inventory.
25%
27%
28%
31%
31%
27%
37665
39055
40306
38581
39302
123693
28291
28364
28957
26747
27150
90280
2012 2013 2014 2015 2016 2016
H O NEY W EL L GE
GROSS PROFIT MARGIN =
(SALES - COST OF SALES) /
SALES
Gross Profit Margin Sales Cost of Sales
Analysis
CALCULATION OF FINANCIAL
PERFORMANCE USING RATIOS
 Rose sharply in ‘13 by doubling itself and then
fell dramatically in ’14.
 Nevertheless, in ‘15, it doubled its net PM
again on recovering strongly in its sales and
net profits levels.
 Fall in the Net Profit of HW while the sales
rose was due to incurring high operational
and administrative expenses in its business
operations.
 On the other hand, the NPM of GE is much
lower than HW. This shows that HW has
higher performance efficiency than GE that
has helped deliver it higher profits and sales
in the last few years.
8%
16%
5%
10%
12%
7%
3031
6083
1965
3698
4638
8831
37665
39055
40306
38581
39302
123693
2012 2013 2014 2015 2016 2016
H O NEY W EL L GE
NET MARGIN = NET PROFIT /
SALES
Net Margin Net Profit Sales
Analysis
CALCULATION OF FINANCIAL
PERFORMANCE USING RATIOS  The ratio was rising in ’12 & ’13, however, it
began a downward trend from ‘14 and
improved marginally in ’16.
 The COGS for HW was increasing till ‘14 and
then dipped in ‘15 before increasing
marginally in ’16.
 This indicates that HW was having high costs
incurred to manufacture its products and
services.
 The inventory levels of HW were rising before
it fell. It means HW was ramping up its
inventory levels for high profits and greater
revenues from the sales.
 It showed effective stock management
policies take up by HW.
 For GE the ratio 4.04 in ‘16 was much lower
than the 6.22 posted by HW.
6.68
6.61
6.57
6.05
6.22
4.04
28291
28364
28957
26747
27150
90280
4235
4293
4405
4420
4366
22354
2012 2013 2014 2015 2016 2016
H O NEY W EL L GE
INVENTORY TURNOVER = COST
OF GOOD SOLD / INVENTORY
Inventory Turnover Cost of goods sold Avg inventory
Analysis
CALCULATION OF FINANCIAL
PERFORMANCE USING RATIOS
 It has been consistent in the last few years by
hovering around the 0.7 and 0.9 .
 It’s been able to increase its sales which fell in
2015.
 This has been made possible by Honeywell
through acquisition of assets with its rising
sales and profits through its organic growth.
 Honeywell has also benefitted from higher
goodwill in 2016 that has helped balance the
decrease in cash and cash equivalents of
Honeywell for the same year, as mentioned
earlier.
 On the other hand, the asset turnover of GE
was only 0.34 that was much lower than the
asset turnover recorded by Honeywell.
0.90
0.86
0.89
0.78
0.73
0.34
37665
39055
40306
38581
39302
123693
41853
45435
45451
49316
54146
365183
2012 2013 2014 2015 2016 2016
H O NEY W EL L GE
ASSET TURNOVER =
SALES/TOTAL ASSETS
Asset turnover Sales Total assets
Analysis
CALCULATION OF FINANCIAL
PERFORMANCE USING RATIOS
 Right from ‘12 to ‘15, it has been slowly
declining and in the present year, it has almost
doubled.
 This can be still viewed favourable for Honeywell
that it can easily to pay over its long term and
short term debts using its equities.
 As Gearing ratio is said to indicate financial
stability, a low gearing ratio achieved by HW
makes it less risky for investors to perform
investments in the firm.
 On comparing the gearing ratio of HW with that
of its competitor firm GE, it could be noted that
the firm has achieved 1.36 in the year 2016. It is
comparatively greater than that of Honeywell.
Normally, this is a lower value indicating less risk
for its financial position of GE.
 Therefore, the relatively lower gearing ratio
makes Honeywell to be more favorable for
investments and has less risk towards
bankruptcy.
0.49
0.39
0.34
0.30
0.62
1.36
6,395
6801
6046
5554
12182
105080
13065
17579
17784
18418
19547
77491
2012 2013 2014 2015 2016 2016
H O NEY W EL L GE
DEBT-EQUITY RATIO = LONG
TERM DEBT/ SHAREHOLDERS
EQUITY
Gearing ratio Long term debt Shareholders equity
Analysis
PROJECTION ABOUT FUTURE
PERFORMANCE OF HONEYWELL
 Favourable level of profits produced by Honeywell can offer stability for the firm to
manage its future conditions.
 In 2017, the firm is expected to offer solid financial performance with good
returns and profit margins.
 This can also aid in increasing the returns for its shareholders and the valuation of
company can go high in future years.
 The significance of Honeywell has increased when compared to other players in the
industry due to the results of 2016 which has been tremendous despite the turbulent
market conditions and sluggish global economic growth.
 Chinese economy is faltering, prices in crude oil have suffered volatility and the business
jets have declining demand.
 Industry projections for the year 2017 indicate that earnings can amount from $6.85-
$7.10 for each share as the earnings per share in the last quarter of 2016 was $1.74.
 Therefore, it could be projected that the spectacular performance of Honeywell are
likely to continue in future.
RECOMMENDATION
 The net income can be useful to perform useful investments in the upcoming period to
expand its subsidiaries or to extend its product portfolios.
 However, the asset management could be more controlled and the firm can suffer
from increasing expenses in maintaining the unwanted assets.
 It must also protect itself from risks arising from currency fluctuations and enhance
its cash levels.
 The restructuring of business and alteration of operating segments could bring out
favourable results as expected.
 The leadership changes in management of Honeywell shall induce changes in internal
operations and strategies where they can also place certain pressure on the financial
results of the firm.
 It is to be noted that the aircraft market is highly competitive and there can be
deliveries up to $249 billion within next decade. This is lesser than the previous decade
by 2-3%. The aircraft and commodity prices are declining to make the scenario to get
worsen further. Therefore, it could be seen that the order rates can become slower from
2017. New models in aircraft could have increased significance.
 To overcome the less growth opportunities in the business environment, Honeywell
needs to achieve more profits by diversifying its product portfolio.
 Also, it needs to perform cost cutting measures to reduce its expenses and liquidate
its unwanted assets to improve the profitability levels.
PROS & CONS OF RATIO ANALYSIS
PROS OF RATIO ANALYSIS
 Financial ratios are highly effective in offering
valuable insights on financial position of a
business.
 It is more advantageous for large
organisations to infer major information
about their performance levels.
 These ratios are highly simplistic and do not
require complex information, software or
procedures for their completion.
 There are automated software available for
generation of financial ratios.
 It aids an organisation to measure the
operating activities, capital structure and
profitability using past performance thereby
aiding in forecasting the future conditions.
 The ratio analysis also aids in decision
making of activities and strategies.
CONS OF RATIO ANALYSIS
 One of the main limitations of the ratio
analysis is that the calculation is done with
the values of the previous years.
 The financial statements in the annual
reports have various flaws and the ratios that
are being calculated based on these financial
statements are not accurate as well.
 Also financial ratios cannot be useful on their
own where they need to be compared with
industry or any competitors of the particular
firm to be analysed.
 Finding equivalent competitors might be a
critical task for small business firms.
 Company performance is alone reviewed
through financial ratios however they do not
offer any idea on the internal operations of
the business and their effectiveness.
CONCLUSION
 It could be concluded that the financial performance of
Honeywell analysed using ratio analysis has indicated a
favourable status for the firm at present with high levels of
profitability, efficiency and investments.
 Future projections are much positive for the firm to have high
growth provided that the industry conditions have to be
favourable.

Financial Analysis Project

  • 1.
    Financial Performance Analysis Location: Universityof Wales Trinity Saint David (London) Presented by: Ibrahim Tasira | Lecturer: Jia Miao Roll number: 1705750
  • 2.
    AGENDA  INTRODUCTION  BACKGROUDOF HONEYWELL  CALCULATION OF FINANCIAL PERFORMANCE USING RATIOS  PROJECTION ABOUT FUTURE PERFORMANCE OF HONEYWELL  RECOMMENDATIONS  PROS & CONS OF RATIO ANALYSIS  CONCLUSION
  • 3.
    INTRODUCTION  Financial performanceof an organisation decides its attractiveness for investment and the effectiveness of management.  Honeywell is the firm that has been selected.  We will analyse financial performance of Honeywell using ratios that are calculated for the past five years ranging from 2012 to 2016.  Ratio analysis is useful in capturing a good idea on the level of financial management by a firm.  Its liquidity levels, debt, profitability and other aspects can inform investors about the risks and strengths of investing in the company.  Different set of ratios will be calculated for Honeywell for determining its profitability, liquidity, efficiency and leverage.
  • 4.
    BACKGROUD OF HONEYWELL $39-$40 billion in revenues, 50% of it outside of U.S.  Nearly 130,000 employees operating in 100 countries.  Honeywell is an American based firm that has 125 years of history involved in manufacturing of engineering systems, aerospace systems and commercial products.  ‘Honeywell’- The inventor of furnace regulator and alarm (1885).  It has distributors around the world and made use of entry modes such as wholly owned subsidiaries, joint ventures, mergers, acquisitions and affiliations.  The firm has its headquarters in Morristown located in New Jersey.  The quality of materials is of high standards and its products are highly credibility.  Is one of the fortune 500 companies with ranking 77. Aerospace 32% Automation 41% Transportation 13% Specialty Materials 14%
  • 5.
    CALCULATION OF FINANCIAL PERFORMANCEUSING RATIOS  Improved till ‘14 then suffered huge decline in ‘15 before recovering in 2016.  However, the current ratio of GE was found to be much higher than of Honeywell in ‘16.  The optimum current ratio of an organisation should be 2:1, nevertheless it was GE that was near to that levels.  The dip in ‘15 is due to decrease in current assets and increase in current liabilities attributed to unfavourable impact of fluctuation in foreign currency.  However, it improved in ‘16 due to effective product mix and lesser foreign currency translation impacts. 1.35 1.49 1.50 1.25 1.41 1.85 17598 21164 22191 23053 23058 151114 13045 14181 14773 18371 16331 81580 2012 2013 2014 2015 2016 2016 H O NEY W EL L GE CURRENT RATIO = CURRENT ASSETS/ CURRENT LIABILTIES Current Ratio Current Assets Current Liabilities Analysis
  • 6.
    CALCULATION OF FINANCIAL PERFORMANCEUSING RATIOS  Similarly, the QR consistently rose till ’14 then fell heavily before marginal recovery.  This was due to a huge decline in Cash & Cash Equivalent of HW while its short term borrowing rose, weakening of € and change in industry conditions and global economic growth.  So, HW don’t have enough quick asset to pay its obligation forcing them to sell their capital assets or closing unprofitable business.  HW needs to augment its CA and decrease their CL. 1.02 1.19 1.20 1.01 1.14 1.58 17598 21164 22191 23053 23058 151114 4235 4293 4405 4420 4366 22354 13045 14181 14773 18371 16331 81580 2012 2013 2014 2015 2016 2016 H O NEY W EL L GE QUICK RATIO = CURRENT ASSETS - INVENTORY / CURRENT LIABILTIES Quick Ratio Current Assets Inventory Current Liabilities Analysis
  • 7.
    CALCULATION OF FINANCIAL PERFORMANCEUSING RATIOS  The GPM of HW has been rising in small increments of 1% to 3% from ’12.  The product sales and service sales of HW was improving over the years, although, it dipped in ’15.  The GPM of GE was found to be much lower than HW in ‘16 at 27% against the 31% recorded by HW.  HW has been able to improve its sales figures while lowering its COS levels.  Enabling them to pay its operating expenses with its high GPM, due to its high profitability enjoyed by HW.  The higher GPM of HW showed that it can profitably sell of its inventory. 25% 27% 28% 31% 31% 27% 37665 39055 40306 38581 39302 123693 28291 28364 28957 26747 27150 90280 2012 2013 2014 2015 2016 2016 H O NEY W EL L GE GROSS PROFIT MARGIN = (SALES - COST OF SALES) / SALES Gross Profit Margin Sales Cost of Sales Analysis
  • 8.
    CALCULATION OF FINANCIAL PERFORMANCEUSING RATIOS  Rose sharply in ‘13 by doubling itself and then fell dramatically in ’14.  Nevertheless, in ‘15, it doubled its net PM again on recovering strongly in its sales and net profits levels.  Fall in the Net Profit of HW while the sales rose was due to incurring high operational and administrative expenses in its business operations.  On the other hand, the NPM of GE is much lower than HW. This shows that HW has higher performance efficiency than GE that has helped deliver it higher profits and sales in the last few years. 8% 16% 5% 10% 12% 7% 3031 6083 1965 3698 4638 8831 37665 39055 40306 38581 39302 123693 2012 2013 2014 2015 2016 2016 H O NEY W EL L GE NET MARGIN = NET PROFIT / SALES Net Margin Net Profit Sales Analysis
  • 9.
    CALCULATION OF FINANCIAL PERFORMANCEUSING RATIOS  The ratio was rising in ’12 & ’13, however, it began a downward trend from ‘14 and improved marginally in ’16.  The COGS for HW was increasing till ‘14 and then dipped in ‘15 before increasing marginally in ’16.  This indicates that HW was having high costs incurred to manufacture its products and services.  The inventory levels of HW were rising before it fell. It means HW was ramping up its inventory levels for high profits and greater revenues from the sales.  It showed effective stock management policies take up by HW.  For GE the ratio 4.04 in ‘16 was much lower than the 6.22 posted by HW. 6.68 6.61 6.57 6.05 6.22 4.04 28291 28364 28957 26747 27150 90280 4235 4293 4405 4420 4366 22354 2012 2013 2014 2015 2016 2016 H O NEY W EL L GE INVENTORY TURNOVER = COST OF GOOD SOLD / INVENTORY Inventory Turnover Cost of goods sold Avg inventory Analysis
  • 10.
    CALCULATION OF FINANCIAL PERFORMANCEUSING RATIOS  It has been consistent in the last few years by hovering around the 0.7 and 0.9 .  It’s been able to increase its sales which fell in 2015.  This has been made possible by Honeywell through acquisition of assets with its rising sales and profits through its organic growth.  Honeywell has also benefitted from higher goodwill in 2016 that has helped balance the decrease in cash and cash equivalents of Honeywell for the same year, as mentioned earlier.  On the other hand, the asset turnover of GE was only 0.34 that was much lower than the asset turnover recorded by Honeywell. 0.90 0.86 0.89 0.78 0.73 0.34 37665 39055 40306 38581 39302 123693 41853 45435 45451 49316 54146 365183 2012 2013 2014 2015 2016 2016 H O NEY W EL L GE ASSET TURNOVER = SALES/TOTAL ASSETS Asset turnover Sales Total assets Analysis
  • 11.
    CALCULATION OF FINANCIAL PERFORMANCEUSING RATIOS  Right from ‘12 to ‘15, it has been slowly declining and in the present year, it has almost doubled.  This can be still viewed favourable for Honeywell that it can easily to pay over its long term and short term debts using its equities.  As Gearing ratio is said to indicate financial stability, a low gearing ratio achieved by HW makes it less risky for investors to perform investments in the firm.  On comparing the gearing ratio of HW with that of its competitor firm GE, it could be noted that the firm has achieved 1.36 in the year 2016. It is comparatively greater than that of Honeywell. Normally, this is a lower value indicating less risk for its financial position of GE.  Therefore, the relatively lower gearing ratio makes Honeywell to be more favorable for investments and has less risk towards bankruptcy. 0.49 0.39 0.34 0.30 0.62 1.36 6,395 6801 6046 5554 12182 105080 13065 17579 17784 18418 19547 77491 2012 2013 2014 2015 2016 2016 H O NEY W EL L GE DEBT-EQUITY RATIO = LONG TERM DEBT/ SHAREHOLDERS EQUITY Gearing ratio Long term debt Shareholders equity Analysis
  • 12.
    PROJECTION ABOUT FUTURE PERFORMANCEOF HONEYWELL  Favourable level of profits produced by Honeywell can offer stability for the firm to manage its future conditions.  In 2017, the firm is expected to offer solid financial performance with good returns and profit margins.  This can also aid in increasing the returns for its shareholders and the valuation of company can go high in future years.  The significance of Honeywell has increased when compared to other players in the industry due to the results of 2016 which has been tremendous despite the turbulent market conditions and sluggish global economic growth.  Chinese economy is faltering, prices in crude oil have suffered volatility and the business jets have declining demand.  Industry projections for the year 2017 indicate that earnings can amount from $6.85- $7.10 for each share as the earnings per share in the last quarter of 2016 was $1.74.  Therefore, it could be projected that the spectacular performance of Honeywell are likely to continue in future.
  • 13.
    RECOMMENDATION  The netincome can be useful to perform useful investments in the upcoming period to expand its subsidiaries or to extend its product portfolios.  However, the asset management could be more controlled and the firm can suffer from increasing expenses in maintaining the unwanted assets.  It must also protect itself from risks arising from currency fluctuations and enhance its cash levels.  The restructuring of business and alteration of operating segments could bring out favourable results as expected.  The leadership changes in management of Honeywell shall induce changes in internal operations and strategies where they can also place certain pressure on the financial results of the firm.  It is to be noted that the aircraft market is highly competitive and there can be deliveries up to $249 billion within next decade. This is lesser than the previous decade by 2-3%. The aircraft and commodity prices are declining to make the scenario to get worsen further. Therefore, it could be seen that the order rates can become slower from 2017. New models in aircraft could have increased significance.  To overcome the less growth opportunities in the business environment, Honeywell needs to achieve more profits by diversifying its product portfolio.  Also, it needs to perform cost cutting measures to reduce its expenses and liquidate its unwanted assets to improve the profitability levels.
  • 14.
    PROS & CONSOF RATIO ANALYSIS PROS OF RATIO ANALYSIS  Financial ratios are highly effective in offering valuable insights on financial position of a business.  It is more advantageous for large organisations to infer major information about their performance levels.  These ratios are highly simplistic and do not require complex information, software or procedures for their completion.  There are automated software available for generation of financial ratios.  It aids an organisation to measure the operating activities, capital structure and profitability using past performance thereby aiding in forecasting the future conditions.  The ratio analysis also aids in decision making of activities and strategies. CONS OF RATIO ANALYSIS  One of the main limitations of the ratio analysis is that the calculation is done with the values of the previous years.  The financial statements in the annual reports have various flaws and the ratios that are being calculated based on these financial statements are not accurate as well.  Also financial ratios cannot be useful on their own where they need to be compared with industry or any competitors of the particular firm to be analysed.  Finding equivalent competitors might be a critical task for small business firms.  Company performance is alone reviewed through financial ratios however they do not offer any idea on the internal operations of the business and their effectiveness.
  • 15.
    CONCLUSION  It couldbe concluded that the financial performance of Honeywell analysed using ratio analysis has indicated a favourable status for the firm at present with high levels of profitability, efficiency and investments.  Future projections are much positive for the firm to have high growth provided that the industry conditions have to be favourable.