Download to read offline
![Linking Performance to Insight: Designing a Computer Aided
Testing System to Re ect Students' Reasoning Patterns
Joan Mazur
Dep. of Curriculum and Instructional Design
University of Kentucky, U.S.A.
E-Mail: jmazur@pop.uky.edu
BorChyi Lin
Dep. of Educational and Counseling Psychology
University of Kentucky, U.S.A.
E-Mail: bclin@pop.uky.edu
Abstract: Computer Aided Instruction (CAI) o ers students the advantage to conduct a self-
paced, self-directed study of topic(s). When CAI includes computer testing, this feature serves as an
additional tool to assess the students' performance. This article discusses the potential of computer
testing not just as an assessment of the student's performance but also as an enhancement that
increases the e ectiveness of CAI by prompting re ection. Data from the preliminary initial eld
test is presented. Issues regarding the e ects of such an approach are also discussed.
Computer Tracking and Assessment Tools
In recent years the utility of computer tracking tools has been well documented in research
and development Williams & Dodge, 1993 Gay & Mazur, 1993]. Computer tracking such as the one
designed for the system under discussion in this paper was mentioned as early as 1968 in a computer-
based instructional system paper by Grubb (i.e. audit trails). In fact, audit trails have been used for a
broad range of research activities integral to the design of interactive programs Misanchuk & Schwier,
1992]. It has also been used for data collection in formative evaluation in instructional design Flagg,
1990] for basic research in instructional design e.g.see Ross et al., 1990] for market e ectiveness studies
in public information environments such as museum or retail store kiosks Misanchuk & Schwier, 1992]
for human-computer interaction research Bodker et al., 1988 Ehn, 1988 Greenbaum & Kyng, 1991]
and, nally, relating to the study this paper is addressing, for providing on-line guidance and feedback
based on a real-time log of users' actions within an instructional program Gay & Mazur, 1993].
Tracking utilities are powerful tools for understanding users' actions in environments with high
learner control or where the informationis structured non-sequentially such as hypermedia or the World-
Wide Web (WWW). However, audit trail information is crucial in assessing students' interactions in
linear structures as well. When audit trail feedback is made visible to the user it can provide a basis for
re ection on learning and thinking Gay & Mazur, 1993].
Background
In 1994, the University of Kentucky College of Medicine restructured its medical education cur-
riculum ACME, 1994]. The changes in the curriculum aspired to promote three aspects in teaching
and learning: (a) student's self-paced learning, (b) build a greater association between the basic science
knowledge base and clinical practice, and (c) introduce new methodologies in teaching. Lecture ma-
terial was converted to interactive multimedia format in an attempt to address many of the changes in
curriculum focus.
This interactive multimedia format displays innovation on two ways. First, it provides students
with material not normally available outside the classroom, e.g., a digitized version of lecture slides](https://image.slidesharecdn.com/b9d88993-3337-4b98-9e95-c0913547331d-151108130631-lva1-app6891/85/final-1-320.jpg)
![Linking Performance to Insight: Designing a Computer Aided
Testing System to Re ect Students' Reasoning Patterns
Joan Mazur
Dep. of Curriculum and Instructional Design
University of Kentucky, U.S.A.
E-Mail: jmazur@pop.uky.edu
BorChyi Lin
Dep. of Educational and Counseling Psychology
University of Kentucky, U.S.A.
E-Mail: bclin@pop.uky.edu
Abstract: Computer Aided Instruction (CAI) o ers students the advantage to conduct a self-
paced, self-directed study of topic(s). When CAI includes computer testing, this feature serves as an
additional tool to assess the students' performance. This article discusses the potential of computer
testing not just as an assessment of the student's performance but also as an enhancement that
increases the e ectiveness of CAI by prompting re ection. Data from the preliminary initial eld
test is presented. Issues regarding the e ects of such an approach are also discussed.
Computer Tracking and Assessment Tools
In recent years the utility of computer tracking tools has been well documented in research
and development Williams & Dodge, 1993 Gay & Mazur, 1993]. Computer tracking such as the one
designed for the system under discussion in this paper was mentioned as early as 1968 in a computer-
based instructional system paper by Grubb (i.e. audit trails). In fact, audit trails have been used for a
broad range of research activities integral to the design of interactive programs Misanchuk & Schwier,
1992]. It has also been used for data collection in formative evaluation in instructional design Flagg,
1990] for basic research in instructional design e.g.see Ross et al., 1990] for market e ectiveness studies
in public information environments such as museum or retail store kiosks Misanchuk & Schwier, 1992]
for human-computer interaction research Bodker et al., 1988 Ehn, 1988 Greenbaum & Kyng, 1991]
and, nally, relating to the study this paper is addressing, for providing on-line guidance and feedback
based on a real-time log of users' actions within an instructional program Gay & Mazur, 1993].
Tracking utilities are powerful tools for understanding users' actions in environments with high
learner control or where the informationis structured non-sequentially such as hypermedia or the World-
Wide Web (WWW). However, audit trail information is crucial in assessing students' interactions in
linear structures as well. When audit trail feedback is made visible to the user it can provide a basis for
re ection on learning and thinking Gay & Mazur, 1993].
Background
In 1994, the University of Kentucky College of Medicine restructured its medical education cur-
riculum ACME, 1994]. The changes in the curriculum aspired to promote three aspects in teaching
and learning: (a) student's self-paced learning, (b) build a greater association between the basic science
knowledge base and clinical practice, and (c) introduce new methodologies in teaching. Lecture ma-
terial was converted to interactive multimedia format in an attempt to address many of the changes in
curriculum focus.
This interactive multimedia format displays innovation on two ways. First, it provides students
with material not normally available outside the classroom, e.g., a digitized version of lecture slides](https://image.slidesharecdn.com/b9d88993-3337-4b98-9e95-c0913547331d-151108130631-lva1-app6891/75/final-1-2048.jpg)
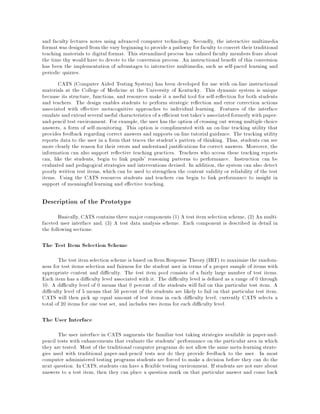
![to the test item after they have nished other items. Or they can answer a test item by eliminating
answers that have the least possibilities of being correct, again by making a notation of marking on the
computer screen next to particular answers. Figs. 1-3] show the interface features.
Figure 1: Initial CATS Test Screen
Figure 2: Normal CATS operation with accompanying a media for test
Strategic Logging System
A strategic logging system provides a record of the response latency for the user's answers as well
as facilitating useful strategies available in a familiar test taking situation such as browsing through the
test items, markingon a doubtful answer or question, or eliminatinganswers that don't seem reasonable.
Technically, any computer simulated test program can provide more information than the hard-copy
version. However, most standard computerized test programs do not allow the user to browse through](https://image.slidesharecdn.com/b9d88993-3337-4b98-9e95-c0913547331d-151108130631-lva1-app6891/85/final-3-320.jpg)
![choice questions each. Questions ascertained information regarding radiographic landmarks and inter-
pretation The computerized exam followed by the written exam was administered to group 1. Group 2
received the exams in opposite order. The written exam for Group 1 contained the same questions as on
group 2's computer exam and vice versa. Both exams were designed to be equivalent in assessment of
aptitude. Students in Group I were matched by grade point average with those in Group 2. Questions
were derived from a bank of questions used at the University of Kentucky College of Dentistry. The
examination was evaluated in a cross-over study. After completion of the exam, students were surveyed
to determine their experience with computers and the platform of computer they routinely used.
After logging in, a series of ten questions were presented. All students received the same ten
questions but in random sequence. Each question was accompanied by an icon of a radiographic image.
When the icon was activated, the size of the image increased to a nal format of 520x310 pixels. A mul-
tiple choice question was viewed simultaneously with the image as seen in Fig. 2]. Students responded
to the question by selecting the correct choice using the mouse button. If uncertain, they could place
a question mark by the response. If the responses were believed to be incorrect, they could mark it
with an x" which would delete that response. After answering each question, the student advanced to
the next question using the forward arrow icon. At the end of the exam, the computer would prompt
the student to return to any unanswered questions that they had left a question mark. The written
exam was similar in format to the computer exam except radio graphs were projected and the questions
answered.
All test responses were graded by computer. The amount of time students spent on the com-
puterized exam was recorded by the computer and tabulated. The computerized test score, the written
test score, the level of computer expertise, and the student's grade point average entering the exam
were recorded. To evaluate the question of whether students can perform equally on a computerized
test as the normal written test scenario, comparisons of performance were made of students in Group 1
(computer exam rst, written exam second) with Group 2 (written exam rst, computer exam second)
using Pearson's Correlation Coe cient, Chi-square, and paired t-test.
Findings
The results showed no correlation between the students' performance and the students' familiarity
with the use of a computer nor the computer platform they were using. Also a review of the tracking
logs, revealed that features provided to students for self assessment and re ection were largely ignored.
There are several possible explanations for these results. For one, while the CATS program
provides the familiarities as seen in traditional exams, there are the additional features build into the
program to encourage re ective thinking. Perhaps the students viewed CATS as a basic/normalmultiple
choices exam. and were not skilled in the use of the on-line enhancements. Also because of the structure
of the instructional settings, students are forced to concentrate on the products instead of the processes.
As a result, CATS did not have desired result of stimulating re ective thinking in the given student
population.
Current Status and Future Direction
The Implementation of CATS is an ongoing project at the University of Kentucky College of
Dentistry. The project is integral to the computer based curriculum development activities. It is clear
from the preliminary data, students need training in the use of an assessment" tool for augmenting
instruction. Also, instructors need assistance focusing onprocess outcomesrather thanproduct outcomes
instruction. Currently, the educational culture in medical school does not emphasize there orientations.
Future eld testing after these approaches have been implemented will give a clearer picture of the
e ectiveness of the CATS tool.](https://image.slidesharecdn.com/b9d88993-3337-4b98-9e95-c0913547331d-151108130631-lva1-app6891/85/final-7-320.jpg)
![A hybrid version of this test system will also be implemented using web browser technology. The
use of this multimedianetwork browser will increase the functionality of the current CATS design. Most
notably, the use of web browser technology will signi cantly enhance the capability to exchange the
information on line. Instructors and students at diverse locations can use the system and discuss the
tracking informationon-line. The presence ofComputerAided Testing System mayprovide opportunities
to assess the impact of the internet in higher education, to link performance to insight, and to distribute
that knowledge Perkins, 1993] to a variety of applicable contexts.
References
ACME, 1994] Academic Computing in Medical Education (1994). Ischemic Heart Disease: Digital
Lecture Series. Brochure]. College of Medicine, University of Kentucky: Rubeck, R. & Tieman, J.
Bodker et al., 1988] Bodker, S., Knudsen, J., Kyng, M., Ehn, P., & Madsen, K. (1988). Computer
support for cooperative design. In CSCW 88: Proceedings of the Conference on Computer Supported
Cooperative Work, pp. 377 | 394 Portland, OR.
Ehn, 1988] Ehn, P. (1988). Work-oriented design of computer artifacts. Falkoping: Almqvist and
Wiksell International.
Flagg, 1990] Flagg, B. (1990). Formative evaluation for educational technologies. Harvard U., Cam-
bridge, MA.
Gay & Mazur, 1993] Gay, G., & Mazur, J. (1993). The utility of computer tracking tools for user-
centered design. Educational technology, 4, 45 | 59.
Greenbaum & Kyng, 1991] Greenbaum, J., & Kyng, M. (1991). Design at work. Cooperative design of
computer systems. Hillsdale, NJ: Lawrence Erlbaum Associates.
Misanchuk & Schwier, 1992] Misanchuk, E., & Schwier, R. (1992). Representing interactive multimedia
and hypermedia audit trails. Journal of Educational Multimedia and Hypermedia, 1(3), 55 | 72.
Perkins, 1993] Perkins, D. (1993). Distributed cognitions: Psychological and educational considerations.
In Salomon, G. (Ed.), Person-plus: A distributed view of thinking and learning. New York, NY:
Cambridge University Press.
Ross et al., 1990] Ross, S., Morrison, G., & O'Dell, J. (1990). Uses and e ects of learner control of
context and instructional support in computer-based instruction. In Annual Meeting of the Association
of Educational Communications and Technology Anaheim, CA.
Williams & Dodge, 1993] Williams, M., & Dodge, B. (1993). Tracking and analyzing learner-computer
interaction. In Selected research and development presentations at the convention of the association for
educational communications and technology, pp. 13 |17 New Orleans, LA.
Acknowledgments
This project was funded under the title Preparing Physician for the Future: A Program in Medical
Education" sponsored by the Robert Wood Johnson Foundation number 019643. This project was a
product of Academic Computing in Medical Education (ACME) under the directorship of Dr. Robert
F. Rubeck at the University of Kentucky, College of Medicine. Special thanks to John R. Fuller, III and
Kathryn Wong Rutledge of the MCFACTS Center, Chandler Medical Center, University of Kentucky.](https://image.slidesharecdn.com/b9d88993-3337-4b98-9e95-c0913547331d-151108130631-lva1-app6891/85/final-8-320.jpg)

This document describes a Computer Aided Testing System (CATS) designed to provide insight into students' reasoning patterns. CATS administers online tests and tracks students' responses, including response times and notes made on questions. It aims to emulate paper test-taking strategies. Test questions are randomly selected from pools of various difficulty levels. Student and teacher reports link performance to patterns in students' reasoning to support reflection and improve instruction.