1.value5.00 pointsExercise 6-4 Income effects of inventory .docxfredellsberry
1.
value:
5.00 points
Exercise 6-4 Income effects of inventory methods L.O. A1
Park Company reported the following March purchases and sales data for its only product.
Date
Activities
Units Acquired at Cost
Units Sold at Retail
Mar.
1
Beginning inventory
150
units
@ $7.00
=
$
1,050
Mar.
10
Sales
90
units
@$15
Mar.
20
Purchase
220
units
@ $6.00
=
1,320
Mar.
25
Sales
145
units
@$15
Mar.
30
Purchase
90
units
@ $5.00
=
450
Totals
460
units
$
2,820
235
units
Park uses a perpetual inventory system. For specific identification, ending inventory consists of 225 units, where 90 are from the March 30 purchase, 80 are from the March 20 purchase, and 55 are from beginning inventory.
1.
Complete comparative income statements for the month of March for Park Company for the four inventory methods. Assume expenses are $1,600, and that the applicable income tax rate is 30%.
(
Round per unit costs to three decimal places.
Round your answers to the nearest dollar amounts. Input all amounts as positive values. Omit the "$" sign in your response.)
PARK COMPANY
Income Statements
For Month Ended March 31
Specific
Identification
Weighted
Average
FIFO
LIFO
Sales
$ [removed]
$ [removed]
$ [removed]
$ [removed]
Cost of goods sold
[removed]
[removed]
[removed]
[removed]
Gross profit
[removed]
[removed]
[removed]
[removed]
Expenses
[removed]
[removed]
[removed]
[removed]
Income before taxes
[removed]
[removed]
[removed]
[removed]
Income tax expense
[removed]
[removed]
[removed]
[removed]
Net income
$ [removed]
$ [removed]
$ [removed]
$ [removed]
2.
Which method yields the highest net income?
[removed]
FIFO
[removed]
Weighted average
[removed]
Specific identification
[removed]
LIFO
3.
Does net income using weighted average fall between that using FIFO and LIFO?
[removed]
Yes
[removed]
No
4.
If costs were rising instead of falling, which method would yield the highest net income?
[removed]
Weighted average
[removed]
Specific identification
[removed]
LIFO
[removed]
FIFO
Problem 6-1A Alternative cost flows-perpetual L.O. P1
[The following information applies to the questions displayed below.]
Anthony Company uses a perpetual inventory system. It entered into the following purchases and sales transactions for March.
Date
Activities
Units Acquired at Cost
Units Sold at Retail
Mar.
1
Beginning inventory
50
units
@ $50/unit
Mar.
5
Purchase
200
units
@ $55/unit
Mar.
9
Sales
210
units
@ $85/unit
Mar.
18
Purchase
60
units
@ $60/unit
Mar.
25
Purchase
100
units
@ $62/unit
Mar.
29
Sales
80
units
@ $95/unit
Totals
410
units
290
units
references
2.
value:
3.00 points
Problem 6-1A Part 1
Required:
1.
Compute cost of goods available f.
Laker Company reported the following January purchases and sales data.pdfmohammedfootwear
Laker Company reported the following January purchases and sales data for its only product.
Activities Units Acquired at Cost Date Jan. 1Beginning inventory Jan. 10 Sales Jan. 20 Purchase
Jan. 25 Sales Jan. 30 Purchase 220 units 170 units 370 units $14.50$ 3,190 $13.502,295
$13.004,810 Units sold at Retalil 170 units $23.50 200 units @ $23.50 370 units Totals 760 units
$10,295 The company uses a periodic inventory system. For specific identification, ending
inventory consists of 390 units, where 370 are from the January 30 beginning inventory value:
2.00 points Required 1. Complete the table to determine the cost assigned to ending inventory
and to cost of goods sold using specific identification. (Round cost per uni Specific Identification
Cost of Goods Available for Sale Cost of Goods Sold Ending Inventory per Cost ofof units Cost
per Ending # of units | Cost per Cost of Goods Availableforl#of units cost unit Goods Sold in
ending inventory sold unit Inventory Sale Beginning inventory Purchases Jan. 20 Jan. 30 Total
Solution
Answers
FIFO,
LIFO,
Specific Identification,
Weighted Average.
FIFO
Cost of Goods available for sale
Cost of Goods Sold
Ending Inventory
Units
Cost/unit
COG for sale
Units sold
Cost/unit
COGS
Units
Cost/unit
Ending inventory
Beginning Inventory
220
$ 14.50
$ 3,190.00
220
$ 14.50
$ 3,190.00
0
$ 14.50
$ -
Purchases:
20-Jan
170
$ 13.50
$ 2,295.00
150
$ 13.50
$ 2,025.00
20
$ 13.50
$ 270.00
30-Jan
370
$ 13.00
$ 4,810.00
0
$ 13.00
$ -
370
$ 13.00
$ 4,810.00
TOTAL
760
$ 10,295.00
370
$ 5,215.00
390
$ 5,080.00
LIFO
Cost of Goods available for sale
Cost of Goods Sold
Ending Inventory
Units
Cost/unit
COG for sale
Units sold
Cost/unit
COGS
Units
Cost/unit
Ending inventory
Beginning Inventory
220
$ 14.50
$ 3,190.00
$ 14.50
$ -
220
$ 14.50
$ 3,190.00
Purchases:
20-Jan
170
$ 13.50
$ 2,295.00
$ 13.50
$ -
170
$ 13.50
$ 2,295.00
30-Jan
370
$ 13.00
$ 4,810.00
370
$ 13.00
$ 4,810.00
0
$ 13.00
$ -
TOTAL
760
$ 10,295.00
370
$ 4,810.00
390
$ 5,485.00
Specific Identification
Cost of Goods available for sale
Cost of Goods Sold
Ending Inventory
Units
Cost/unit
COG for sale
Units sold
Cost/unit
COGS
Units
Cost/unit
Ending inventory
Beginning Inventory
220
$ 14.50
$ 3,190.00
200
$ 14.50
$ 2,900.00
20
$ 14.50
$ 290.00
Purchases:
20-Jan
170
$ 13.50
$ 2,295.00
170
$ 13.50
$ 2,295.00
0
$ 13.50
$ -
30-Jan
370
$ 13.00
$ 4,810.00
0
$ 13.00
$ -
370
$ 13.00
$ 4,810.00
TOTAL
760
$ 10,295.00
370
$ 5,195.00
390
$ 5,100.00
Average Method
Cost of Goods available for sale
Cost of Goods Sold
Ending Inventory
Units
Cost/unit
COG for sale
Units sold
Cost/unit
COGS
Units
Cost/unit
Ending inventory
Beginning Inventory
220
$ 14.50
$ 3,190.00
Purchases:
20-Jan
170
$ 13.50
$ 2,295.00
30-Jan
370
$ 13.00
$ 4,810.00
TOTAL
760
13.55
$ 10,295.00
370
13.55
$ 5,013.50
390
$ 13.55
$ 5,284.50
FIFO
Cost of Goods available for sale
Cost of Goods Sold
Ending Inventory
Units
Cost/unit
COG for sale
Units sold
Cost/unit
COGS
Units
Cost/unit
Ending inventory
Beginning Inventory
220
$ 1.
I apologize this 1 question has numerous parts. I didnt want to s.pdfjeetumordhani
I apologize: this 1 question has numerous parts. I didn\'t want to split it up in to separate
questions and confuse others. Selected year-end financial statements of Cabot Corporation
follow. (All sales were on credit; selected balanoe sheet amounts at December 31, 2014, were
inventory, S53,900; total assets, $199,400; common stock, 588,000; and retained earnings,
344,392.) CABOT CORPORATION Income Statement For Year Ended December 31, 2015
Sales Cost of goods sold S453,600 298,850 Gross profit Operating expenses Interest expense
158,750 98,800 4,600 Income before taxes Income taxes 53,350 21,492 Net income S 31,858
CABOT CORPORATION Balance Sheet December 31, 2015 Assets Cash Short-term
investments Accounts receivable, net Notes receivable (trade) S 18,000 9,200 32,200 000 38,150
2,800 151,300 Liabilities and Equity Accounts payable Accrued Income taxes payable Long-
term note payable, secured S 17,500 4,800 4,700 wages payable 5, Prepaid expenses Plant assets,
net by mortgage on plant assets Common stod Retained earnings 83,400 88,000 76,250 Total
assets S254,650 Total liabilities and equity S254,650 These are short-term notes receivable
arising from customer (trade) sales. Required: Compute the following: (1) current ratio, (2) acid-
test ratio, (3) days sales uncollected, (4) inventory turnover, (5) days\' sales in inventory, (8)
debt-to-equity ratio, (7) times interest earned, (8) profit margin ratio, (9) total asset turnover, (10)
return on total assets, and (11) return on common stockholders\' equity Do not round
intermediate calculations.) Choose Numerator: | Choose Denominator: | = Current Ratio Current
ratio 2015 to 1
Solution
Answer to Part 1.
Current Ratio = Current Assets / Current Liabilities
Current Assets = Cash + Short Term Investments + Accounts Receivable, net + Notes
Receivable (Trade) + Merchandise Inventory + Prepaid Expenses
Current Assets = $16,000 + $9,200 + $32,200 + $5,000 + $38,150 + $2,800
Current Assets = $103,350
Current Liabilities = Accounts Payable + Accrued Wages Payable + Income Taxes Payable
Current Liabilities = $17,500 + $4,800 + $4,700
Current Liabilities = $27,000
Current Ratio = 103,350 / 27,000
Current Ratio = 3.83 to 1
Answer to Part 2.
Acid-Test Ratio = Quick Assets / Current Liabilities
Quick Assets = Current Assets – Merchandise Inventory – Prepaid Expenses
Quick Assets = $103,350 - $38,150 - $2,800
Quick Assets = $62,400
Acid-Test Ratio = 62,400 /27,000
Acid-Test Ratio = 2.31 to 1
Answer to Part 3.
Days Collected Sales = Current Receivable / Net Sales * 365
Current Receivable = $32,200 + $5,000 = $37,200
Days Collected Sales = 37,200 / 453,600 * 100
Days Collected Sales = 29.93 days
Answer to Part 4.
Inventory Turnover Ratio = Cost of goods sold / Average Inventory
Average Inventory = (38,150 + 53,900) / 2
Average Inventory = $46,025
Inventory Turnover Ratio = 296,850 / 46,025
Inventory Turnover Ratio = 6.45 times
Answer to Part 5.
Days’ Sales in Inventory = Average Inventory / Cost of Goods Sol.
“You can download this product from SlideTeam.net”
Select our professionally designed Finance Budgeting PowerPoint Presentation Slides to improve your profits, reduce costs, and increase return on investments. Keep track of your expenses and revenues with the help of our content ready budget forecast presentation deck. The topic-specific actual vs budget variance PowerPoint complete deck contains a set of self-explanatory templates such as actual cost vs budget, month-wise forecasting, overhead cost analysis, quarterly budget analysis, variance analysis, actual vs target variance, budget vs plan vs forecast, forecast, and projection, etc. Creating and monitoring a budget can keep your business profitable and successful. Manage your finances effectively using the ready-to-use budget projection PPT slides. Incorporate the professional-looking financial forecasting PPT visuals to showcase steps of developing and planning a budget. Furthermore, the visually appealing corporate budgeting and forecasting PowerPoint templates are also helpful in creating your financial plans. Thus, download the budget variance analysis PowerPoint presentation now and engage your viewers. A hearty chuckle is good for health. Our Finance Budgeting Powerpoint Presentation Slides are firm believers of the fact. https://bit.ly/3ETzaSC
This complete deck can be used to present to your team.It has PPT slides on various topics highlighting all the core areas of your business needs. This complete deck focuses on Finance Budgeting Powerpoint Presentation Slides and has professionally designed templates with suitable visuals and appropriate content. This deck consists of total of twentyone slides. All the slides are completely customizable for your convenience. You can change the colour, text and font size of these templates. You can add or delete the content if needed. Get access to this professionally designed complete presentation by clicking the download button below.
Montoure Company uses a perpetual inventory system. It entered into .pdfmccarthygaussvanst87
Montoure Company uses a perpetual inventory system. It entered into the following calendar-
year purchases and sales transactions. (For specific identification, units sold consist of 600 units
from beginning inventory, 300 from the February 10 purchase, 200 from the March 13 purchase,
50 from the August 21 purchase, and 250 from the September 5 purchase.) Date Activities Units
Acquired at Cost Units Sold at Retail Jan. 1 Beginning inventory 600 units @ $45.00 per unit
Feb. 10 Purchase 400 units @ $42.00 per unit Mar. 13 Purchase 200 units @ $27.00 per unit
Mar. 15 Sales 800 units @ $75.00 per unit Aug. 21 Purchase 100 units @ $50.00 per unit Sept. 5
Purchase 500 units @ $46.00 per unit Sept. 10 Sales 600 units @ $75.00 per unit Totals 1,800
units 1,400 units Required 1.Compute cost of goods available for sale and the number of units
available for sale. 2.Compute the number of units in ending inventory. 3.Compute the cost
assigned to ending inventory using (a) FIFO, (b) LIFO, (c) weighted average, and (d) specific
identification. (Round all amounts to cents.) Check (3) Ending inventory: FIFO, $18,400; LIFO,
$18,000; WA, $17,760 4.Compute gross profit earned by the company for each of the four
costing methods in part 3. (4) LIFO gross profit, $45,800
Solution
Answer
Purchase
Units
Rate
Amount
Feb-10
400
42
16800
Mar-13
200
27
5400
Aug-21
100
50
5000
Sep-05
500
46
23000
Total
1200
50200
Sales
Units
Rate
Amount
Mar-15
800
75
60000
Sep-10
600
75
45000
0
Total
1400
105000
Cost of Goods Available for Sale = Opening Inventory + Purchases
= 27000 + 50200 = $77,200
Closing Inventory = Opening Inventory + Purchased units - Sold Units
= 600 + 1200 – 1400 = 400 units
First, FIFO
FIFO
Opening + Purchases
Cost of Goods Sold
Closing Inventory
Opening Jan 1
600
45.00
27000
600
45.00
27000.00
Feb 10 Purchase
400
42.00
16800
600
45.00
27000.00
400
42.00
16800.00
Mar 13 Purchase
200
27.00
5400
600
45.00
27000.00
400
42.00
16800.00
200
27.00
5400.00
Mar 15 Sales
600
45.00
27000
200
42.00
8400.00
200
42.00
8400
200
27.00
5400.00
Aug 21 purchased
100
50.00
5000
200
42.00
8400.00
200
27.00
5400.00
100
50.00
5000.00
Sept 5 Purchase
500
46.00
23000
200
42.00
8400.00
200
27.00
5400.00
100
50.00
5000.00
500
46.00
23000.00
Sep 10 Sales
200
42.00
8400
400
46.00
18400.00
200
27.00
5400
100
50.00
5000
100
46.00
4600
TOTAL
1800
77200
1400
58800
400
18400.00
Units
Value
Cost of Goods Sold
1400
58800
Closing Inventory
400
18400
LIFO Method
LIFO
Opening + Purchases
Cost of Goods Sold
Closing Inventory
Opening Jan 1
600
45.00
27000
600
45.00
27000.00
Feb 10 Purchase
400
42.00
16800
600
45.00
27000.00
400
42.00
16800.00
Mar 13 Purchase
200
27.00
5400
600
45.00
27000.00
400
42.00
16800.00
200
27.00
5400.00
Mar 15 Sales
200
27.00
5400
400
45.00
18000.00
400
42.00
16800
0.00
200
45.00
9000
Aug 21 purchased
100
50.00
5000
400
45.00
18000.00
100
50.00
5000.00
0.00
Sept 5 Purchase
500
46.00
23000
400
45.00
18000.00
100
50.00
5000.00
500
46.00
23000.00
Sep 10 Sales
500
46.00
23000
400
4.
Yes of course, you can easily start mining pi network coin today and sell to legit pi vendors in the United States.
Here the telegram contact of my personal vendor.
@Pi_vendor_247
#pi network #pi coins #legit #passive income
#US
Seminar: Gender Board Diversity through Ownership NetworksGRAPE
Seminar on gender diversity spillovers through ownership networks at FAME|GRAPE. Presenting novel research. Studies in economics and management using econometrics methods.
Lecture slide titled Fraud Risk Mitigation, Webinar Lecture Delivered at the Society for West African Internal Audit Practitioners (SWAIAP) on Wednesday, November 8, 2023.
how to sell pi coins effectively (from 50 - 100k pi)DOT TECH
Anywhere in the world, including Africa, America, and Europe, you can sell Pi Network Coins online and receive cash through online payment options.
Pi has not yet been launched on any exchange because we are currently using the confined Mainnet. The planned launch date for Pi is June 28, 2026.
Reselling to investors who want to hold until the mainnet launch in 2026 is currently the sole way to sell.
Consequently, right now. All you need to do is select the right pi network provider.
Who is a pi merchant?
An individual who buys coins from miners on the pi network and resells them to investors hoping to hang onto them until the mainnet is launched is known as a pi merchant.
debuts.
I'll provide you the Telegram username
@Pi_vendor_247
Abhay Bhutada Leads Poonawalla Fincorp To Record Low NPA And Unprecedented Gr...Vighnesh Shashtri
Under the leadership of Abhay Bhutada, Poonawalla Fincorp has achieved record-low Non-Performing Assets (NPA) and witnessed unprecedented growth. Bhutada's strategic vision and effective management have significantly enhanced the company's financial health, showcasing a robust performance in the financial sector. This achievement underscores the company's resilience and ability to thrive in a competitive market, setting a new benchmark for operational excellence in the industry.
The European Unemployment Puzzle: implications from population agingGRAPE
We study the link between the evolving age structure of the working population and unemployment. We build a large new Keynesian OLG model with a realistic age structure, labor market frictions, sticky prices, and aggregate shocks. Once calibrated to the European economy, we quantify the extent to which demographic changes over the last three decades have contributed to the decline of the unemployment rate. Our findings yield important implications for the future evolution of unemployment given the anticipated further aging of the working population in Europe. We also quantify the implications for optimal monetary policy: lowering inflation volatility becomes less costly in terms of GDP and unemployment volatility, which hints that optimal monetary policy may be more hawkish in an aging society. Finally, our results also propose a partial reversal of the European-US unemployment puzzle due to the fact that the share of young workers is expected to remain robust in the US.
where can I find a legit pi merchant onlineDOT TECH
Yes. This is very easy what you need is a recommendation from someone who has successfully traded pi coins before with a merchant.
Who is a pi merchant?
A pi merchant is someone who buys pi network coins and resell them to Investors looking forward to hold thousands of pi coins before the open mainnet.
I will leave the telegram contact of my personal pi merchant to trade with
@Pi_vendor_247
The secret way to sell pi coins effortlessly.DOT TECH
Well as we all know pi isn't launched yet. But you can still sell your pi coins effortlessly because some whales in China are interested in holding massive pi coins. And they are willing to pay good money for it. If you are interested in selling I will leave a contact for you. Just telegram this number below. I sold about 3000 pi coins to him and he paid me immediately.
Telegram: @Pi_vendor_247
5 Tips for Creating Standard Financial ReportsEasyReports
Well-crafted financial reports serve as vital tools for decision-making and transparency within an organization. By following the undermentioned tips, you can create standardized financial reports that effectively communicate your company's financial health and performance to stakeholders.
2. Elemental Economics - Mineral demand.pdfNeal Brewster
After this second you should be able to: Explain the main determinants of demand for any mineral product, and their relative importance; recognise and explain how demand for any product is likely to change with economic activity; recognise and explain the roles of technology and relative prices in influencing demand; be able to explain the differences between the rates of growth of demand for different products.
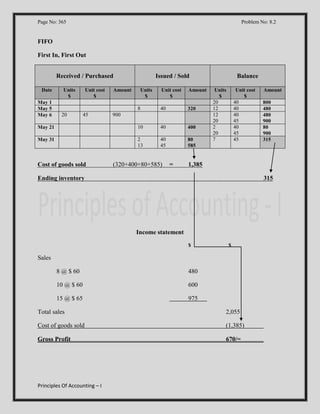
1. Page No: 365
Problem No: 8.2
FIFO
First In, First Out
Received / Purchased
Date
Unit cost
$
Amount
8
40
320
May 21
10
40
400
May 31
2
13
40
45
80
585
May 1
May 5
May 6
Units
$
20
Unit cost
$
45
Cost of goods sold
Amount
Issued / Sold
Units
$
900
(320+400+80+585)
=
Balance
Units
$
20
12
12
20
2
20
7
Unit cost
$
40
40
40
45
40
45
45
800
480
480
900
80
900
315
1,385
Ending inventory
315
Income statement
$
$
Sales
8 @ $ 60
480
10 @ $ 60
600
15 @ $ 65
975
Total sales
2,055
Cost of goods sold
(1,385)
Gross Profit
670/=
Principles Of Accounting – I
Amount
2. Page No: 365
Problem No: 8.2
LIFO
Last In, First Out
Received / Purchased
Date
Unit cost
$
Amount
8
40
320
May 21
10
45
450
May 31
10
5
45
40
450
200
May 1
May 5
May 6
Units
$
20
Unit cost
$
Issued / Sold
45
Cost of goods sold
Amount
Units
$
900
(320+450+450+200) =
Balance
Units
$
20
12
12
20
12
10
7
Unit cost
$
40
40
40
45
40
45
40
800
480
480
900
480
450
280
1,420
Ending inventory
280
Income statement
$
$
Sales
8 @ $ 60
480
10 @ $ 60
600
15 @ $ 65
975
Total sales
2,055
Cost of goods sold
(1,420)
Gross Profit
635/=
Principles Of Accounting – I
Amount
3. Page No: 365
Problem No: 8.2
W.A
Weighted Average Cost
Received / Purchased
Date
May 1
May 5
May 6
May 21
May 31
Units
$
Cost of goods sold
Amount
40
320
10
15
45
Amount
Unit cost
$
8
20
Unit cost
$
Issued / Sold
Units
$
43.125
43.125
431.125
646.875
900
Balance
Units
$
20
12
32
22
7
Unit cost
$
40
40
43.125
43.123
43.125
301.875
Income statement
$
$
Sales
8 @ $ 60
480
10 @ $ 60
600
15 @ $ 65
975
2,055
Cost of goods sold
(1,398.125)
Gross Profit
656.875/=
Principles Of Accounting – I
800
480
1,380
948.75
301.875
(320+431.125+646.875) = 1,398.125
Ending inventory
Total sales
Amount