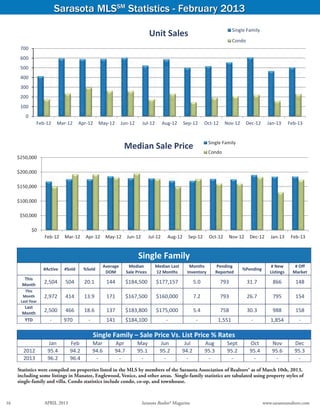
- The document provides statistics on the real estate market in Sarasota, Florida for February 2013, including sales, inventory, median sale prices, and days on market for both single family homes and condominiums.
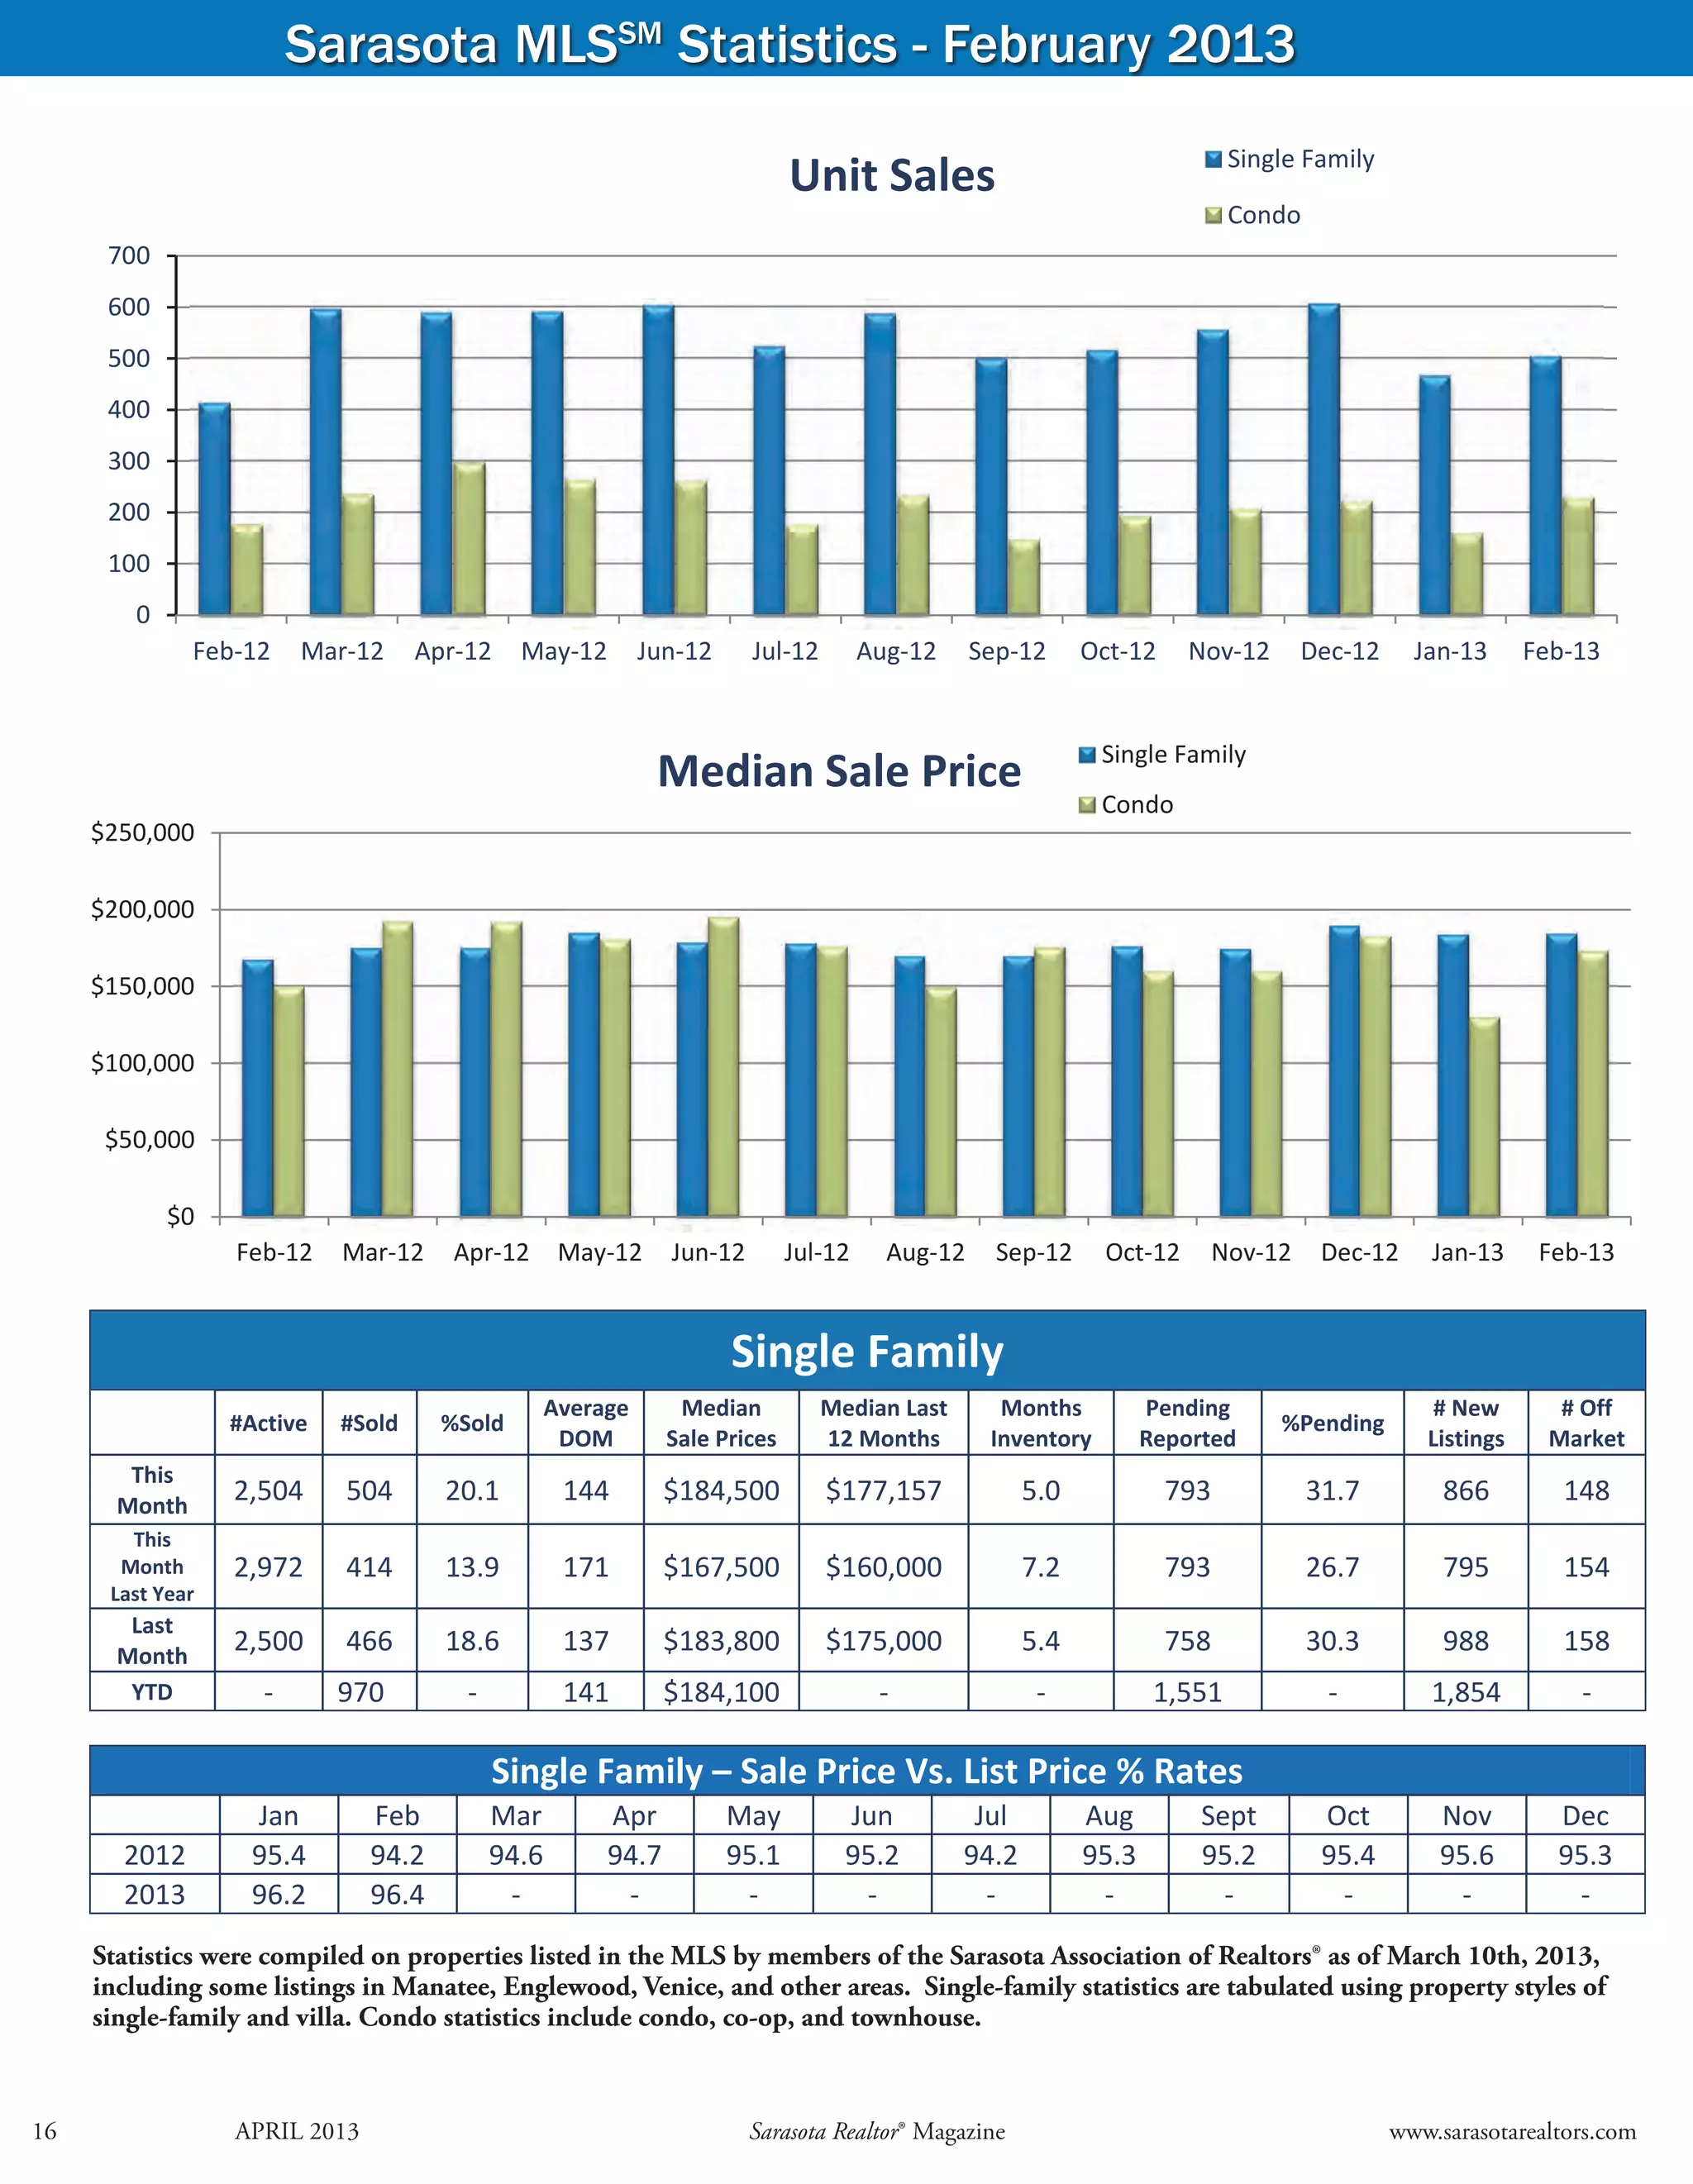
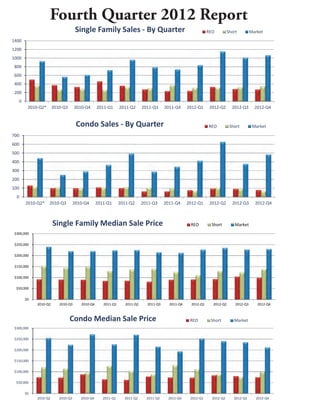
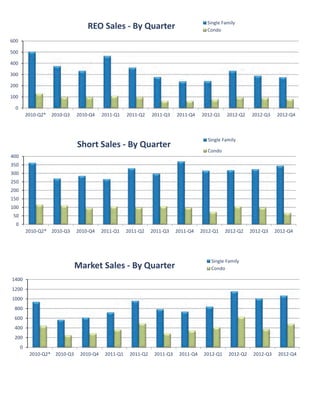
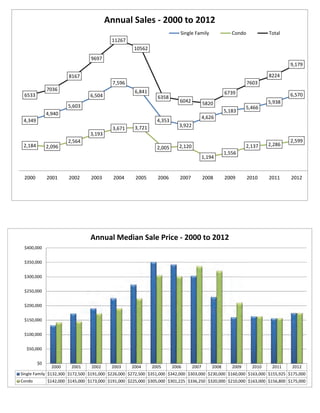
- Key figures show that in February 2013, 504 single family homes and 229 condos were sold, with median sale prices of $184,500 for single family homes and $173,000 for condos.
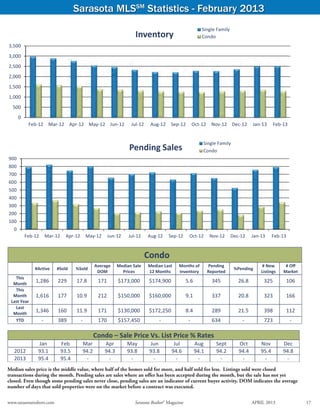
- Inventory levels decreased for both single family homes and condos compared to previous months while pending sales and median sale prices increased.


![스마트폰을 활용한 업무혁신 프로젝트[no 1]](https://cdn.slidesharecdn.com/ss_thumbnails/20103no1-100723071943-phpapp02-thumbnail.jpg?width=640&height=640&fit=bounds)


