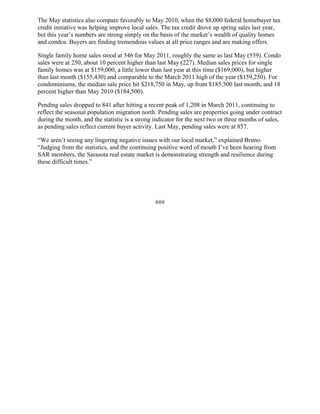
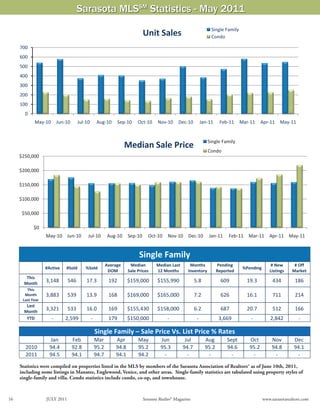
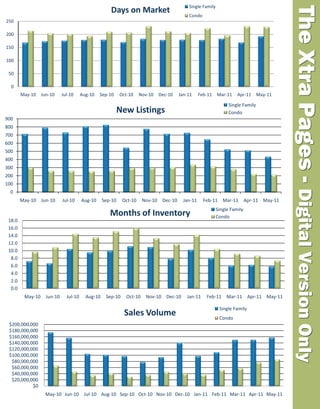
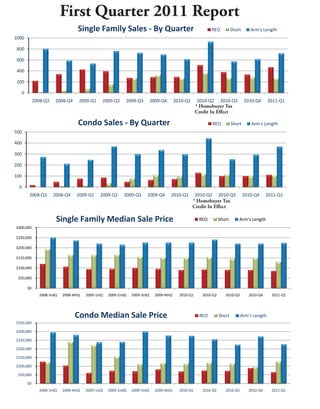
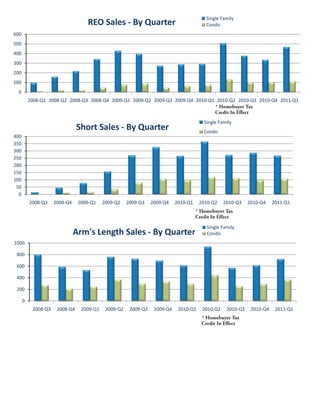
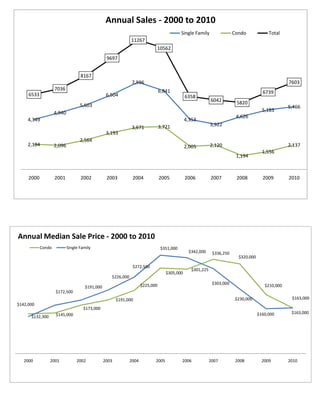
For Immediate Release
Sarasota Association of Realtors®
June 14, 2011
For more information contact Kathy Roberts, 941-328-1170


Sales surge continues in May; condo prices soar
The Sarasota real estate market continued its strong spring showing in May 2011, with 796 total
sales reported by members of the Sarasota Association of Realtors® - the second highest total in
the past six years.

Only the March 2011 sales figure of 800 has been higher since the end of the real estate boom of
2003-2005. Prices for both single family homes and condos also climbed in May 2011, with the
condo median sales price of $218,750 at the highest since October 2009. For single family
homes, the figure in May rose to $159,000, just under the March high of $159,250, continuing
the 2011 upward trend.

The total available property inventory dropped to 5,010, another big decrease from last month’s
level of 5,258, and once again the lowest level in the past six years. The inventory reached its
apex in April 2007, when 17,089 properties were on the market.

The lower inventory, combined with the higher sales rate, has now dropped the months of
inventory to 5.8 months for single family homes and 7.4 months for condos, both figures the
lowest since 2005. The 6 month level is traditionally a point which represents equilibrium in the
market between buyers and sellers. At the point when the market was at its most unbalanced in
favor of buyers, in November 2008, the figures were 24 months for single family homes and an
incredible 41.7 months for condos. Once the figure trends downward below 6 months, buyers are
often forced to compete for properties, which generally drives prices higher.

“Clearly, we’ve seen an amazing improvement in our market in the past three years,” said SAR
President Michael Bruno. “We have been trending in the right direction for several months now,
and we’re starting to witness a return to the point where multiple buyers bid on a particular
property. As the inventory of available properties drops, competition increases for the homes for
sale, and prices naturally rise. The only thing holding back even greater appreciation appears to
be the high percentage of distressed properties.”

Even that statistic is trending in a healthy direction, as the overall percentage of distressed sales
(short sales and foreclosure sales) dropped to 38 percent of the May 2011 sales. That compares
to 47 percent as recently as February 2011 and a high of 51 percent in November 2010.
The May statistics also compare favorably to May 2010, when the $8,000 federal homebuyer tax
credit initiative was helping improve local sales. The tax credit drove up spring sales last year,
but this year’s numbers are strong simply on the basis of the market’s wealth of quality homes
and condos. Buyers are finding tremendous values at all price ranges and are making offers.

Single family home sales stood at 546 for May 2011, roughly the same as last May (539). Condo
sales were at 250, about 10 percent higher than last May (227). Median sales prices for single
family homes was at $159,000, a little lower than last year at this time ($169,000), but higher
than last month ($155,430) and comparable to the March 2011 high of the year ($159,250). For
condominiums, the median sale price hit $218,750 in May, up from $185,500 last month, and 18
percent higher than May 2010 ($184,500).

Pending sales dropped to 841 after hitting a recent peak of 1,208 in March 2011, continuing to
reflect the seasonal population migration north. Pending sales are properties going under contract
during the month, and the statistic is a strong indicator for the next two or three months of sales,
as pending sales reflect current buyer activity. Last May, pending sales were at 857.

“We aren’t seeing any lingering negative issues with our local market,” explained Bruno.
“Judging from the statistics, and the continuing positive word of mouth I’ve been hearing from
SAR members, the Sarasota real estate market is demonstrating strength and resilience during
these difficult times.”


                                                ###
Sarasota MLSSM Statistics - May 2011
                                                                                                                          Single Family
                                                                                    Unit Sales                            Condo

     700
     600
     500
     400
     300
     200
     100
       0
               May‐10          Jun‐10     Jul‐10         Aug‐10     Sep‐10      Oct‐10      Nov‐10     Dec‐10      Jan‐11       Feb‐11     Mar‐11     Apr‐11 May‐11


                                                                                                                         Single Family
                                                                         Median Sale Price
                                                                                                                         Condo
     $250,000

     $200,000

     $150,000

     $100,000

      $50,000

               $0
                    May‐10 Jun‐10                Jul‐10         Aug‐10     Sep‐10      Oct‐10    Nov‐10 Dec‐10           Jan‐11     Feb‐11    Mar‐11 Apr‐11 May‐11


                                                                                 Single Family 
                                                            Average         Median         Median Last       Months         Pending                        # New       # Off 
                    #Active          #Sold      %Sold                                                                                       %Pending 
                                                             DOM           Sale Prices     12 Months        Inventory       Reported                      Listings    Market 
        This 
       Month 
                    3,148            546        17.3            192      $159,000           $155,990             5.8            609           19.3          434        186 
        This 
       Month        3,883            539        13.9            168      $169,000           $165,000             7.2            626           16.1          711        214 
      Last Year 
        Last 
       Month 
                    3,321            533        16.0            169      $155,430           $158,000             6.2            687           20.7          512        166 
        YTD               ‐          2,599         ‐            179      $150,000                ‐                ‐             3,669          ‐           2,842         ‐ 
                                  
                                                        Single Family – Sale Price Vs. List Price % Rates
                         Jan            Feb             Mar        Apr          May          Jun           Jul          Aug        Sept        Oct         Nov         Dec 
       2010              94.4           92.8            95.2       94.8         95.2         95.3         94.7          95.2       94.6        95.2        94.8        94.1 
       2011              94.5           94.1            94.7       94.1         94.2          ‐             ‐            ‐           ‐          ‐           ‐           ‐ 
                     
     Statistics were compiled on properties listed in the MLS by members of the Sarasota Association of Realtors® as of June 10th, 2011,
     including some listings in Manatee, Englewood, Venice, and other areas. Single-family statistics are tabulated using property styles of
     single-family and villa. Condo statistics include condo, co-op, and townhouse.

                                                                                                                  Source: Sarasota Association of Realtors®
16                      JULY 2011                                                   Sarasota Realtor® Magazine                                         www.sarasotarealtors.com
Sarasota MLSSM Statistics - May 2011
                                                                                                                Single Family
                                                                          Inventory                             Condo
5,000

4,000

3,000

2,000

1,000

     0
           May‐10 Jun‐10              Jul‐10     Aug‐10 Sep‐10          Oct‐10 Nov‐10 Dec‐10             Jan‐11        Feb‐11 Mar‐11 Apr‐11 May‐11


                                                                                                                 Single Family
                                                                        Pending Sales                            Condo
1000
 900
 800
 700
 600
 500
 400
 300
 200
 100
   0
           May‐10         Jun‐10      Jul‐10      Aug‐10       Sep‐10    Oct‐10    Nov‐10     Dec‐10          Jan‐11     Feb‐11    Mar‐11      Apr‐11 May‐11


                                                                                  Condo 
                                                       Average     Median Sale    Median Last     Months of            Pending                    # New       # Off 
                  #Active    #Sold       %Sold                                                                                     %Pending 
                                                        DOM          Prices       12 Months       Inventory            Reported                  Listings    Market 
   This 
  Month 
                  1,862       250        13.4           228        $218,750        $160,000             7.4              232         12.4         212         211 
   This 
  Month           2,211       227        10.3           213        $184,500        $192,000             9.7              231         10.4         298         209 
 Last Year 
   Last 
  Month 
                  1,937       226        11.7           230        $185,500        $160,000             8.6              272         14.0         224         197 
   YTD               ‐       1,076         ‐            214        $170,000            ‐                 ‐              1,275         ‐          1,362         ‐ 
                      
                                                   Condo – Sale Price Vs. List Price % Rates
                   Jan         Feb             Mar         Apr          May        Jun          Jul            Aug         Sept      Oct         Nov         Dec 
   2010            92.5        92.4            92.5        93.2         94.2       93.7        94.2            93.5        93.2      94.3        94.5        92.9 
   2011            93.4        91.2            92.2        93.4         94.5        ‐            ‐              ‐            ‐        ‐           ‐           ‐ 
               
Median sales price is the middle value, where half of the homes sold for more, and half sold for less. Listings sold were closed transac-
tions during the month. Pending sales are sales where an offer has been accepted during the month, but the sale has not yet closed. Even
though some pending sales never close, pending sales are an indicator of current buyer activity. DOM indicates the average number of
days that sold properties were on the market before a contract was executed.
                                                                                                               Sarasota Association of Realtors® MLS
www.sarasotarealtors.com                                                   Sarasota Realtor® Magazine                                        JULY 2011                 17
Single Family
                                                   Days on Market


                                                                                                                                           The Xtra Pages - Digital Version Only
                                                                                           Condo
250

200

150

100

 50

  0
        May‐10   Jun‐10   Jul‐10     Aug‐10   Sep‐10     Oct‐10    Nov‐10    Dec‐10    Jan‐11     Feb‐11   Mar‐11    Apr‐11 May‐11

                                                                                                                 Single Family
                                                       New Listings                                              Condo
900
800
700
600
500
400
300
200
100
 0
        May‐10 Jun‐10     Jul‐10     Aug‐10     Sep‐10    Oct‐10    Nov‐10    Dec‐10     Jan‐11     Feb‐11 Mar‐11          Apr‐11 May‐11
                                                                                                           Single Family
                                                   Months of Inventory                                     Condo
 18.0
 16.0
 14.0
 12.0
 10.0
  8.0
  6.0
  4.0
  2.0
  0.0
         May‐10 Jun‐10      Jul‐10     Aug‐10    Sep‐10    Oct‐10    Nov‐10 Dec‐10        Jan‐11     Feb‐11 Mar‐11 Apr‐11 May‐11

                                                                                                            Single Family
                                                           Sales Volume                                     Condo
 $200,000,000 
 $180,000,000 
 $160,000,000 
 $140,000,000 
 $120,000,000 
 $100,000,000                                                                           Sarasota Association of Realtors® MLS
  $80,000,000 
  $60,000,000 
  $40,000,000 
  $20,000,000 
           $0 
                  May‐10 Jun‐10       Jul‐10 Aug‐10 Sep‐10 Oct‐10 Nov‐10 Dec‐10 Jan‐11 Feb‐11 Mar‐11 Apr‐11 May‐11
First Quarter 2011 Report
                                Single Family Sales ‐ By Quarter                                          REO           Short      Arm's Length
1000

800

600

400

200

   0
         2008‐Q3     2008‐Q4     2009‐Q1     2009‐Q2     2009‐Q3         2009‐Q4       2010‐Q1     2010‐Q2       2010‐Q3        2010‐Q4     2011‐Q1
                                                                                                   * Homebuyer Tax
                                                                                                   Credit In Effect

                                 Condo Sales ‐ By Quarter                                                    REO        Short      Arm's Length
500

400

300

200

100

  0
        2008‐Q3     2008‐Q4     2009‐Q1     2009‐Q2     2009‐Q3      2009‐Q4       2010‐Q1         2010‐Q2      2010‐Q3         2010‐Q4     2011‐Q1
                                                                                                 * Homebuyer Tax
                                                                                                 Credit In Effect

                     Single Family Median Sale Price                                                REO         Short       Arm's Length
$300,000 

$250,000 

$200,000 

$150,000 

$100,000 

 $50,000 

       $0 
             2008‐3rdQ   2008‐4thQ   2009‐1stQ   2009‐2ndQ   2009‐3rdQ     2009‐4thQ     2010‐Q1      2010‐Q2      2010‐Q3        2010‐Q4     2011‐Q1


                               Condo Median Sale Price                                              REO         Short        Arm's Length
$350,000 

$300,000 

$250,000 

$200,000 

$150,000 

$100,000                                                                                  Source: Sarasota Association of Realtors®

 $50,000 

       $0 
             2008‐3rdQ   2008‐4thQ   2009‐1stQ   2009‐2ndQ   2009‐3rdQ     2009‐4thQ     2010‐Q1      2010‐Q2      2010‐Q3        2010‐Q4     2011‐Q1
Single Family
                                   REO Sales ‐ By Quarter                                 Condo
600
500
400
300
200
100
 0
          2008‐Q1 2008‐Q2 2008‐Q3 2008‐Q4 2009‐Q1 2009‐Q2 2009‐Q3 2009‐Q4 2010‐Q1 2010‐Q2 2010‐Q3 2010‐Q4 2011‐Q1
                                                                                 * Homebuyer Tax
                                                                                 Credit In Effect
                                                                                         Single Family
                                Short Sales ‐ By Quarter                                 Condo
400
350
300
250
200
150
100
 50
  0
          2008‐Q3    2008‐Q4    2009‐Q1    2009‐Q2    2009‐Q3    2009‐Q4    2010‐Q1    2010‐Q2    2010‐Q3    2010‐Q4    2011‐Q1
                                                                                      * Homebuyer Tax
                                                                                      Credit In Effect
                                                                                          Single Family
                               Arm's Length Sales ‐ By Quarter                            Condo
1000

 800

 600

 400

 200

      0
           2008‐Q3    2008‐Q4    2009‐Q1    2009‐Q2    2009‐Q3    2009‐Q4    2010‐Q1    2010‐Q2    2010‐Q3    2010‐Q4    2011‐Q1
                                                                                        * Homebuyer Tax
                                                                                        Credit In Effect


                                                                                  Source: Sarasota Association of Realtors®
Annual Sales ‐ 2000 to 2010
                                                                                            Single Family
                                                                                            Single Family                Condo             Total
                                                               11267
                                                                             10562
                                                  9697


                                   8167
                                                                7,596                                                                               7603
                    7036                                                         6,841
     6533                                                                                                                               6739
                                                  6,504
                                                  6 504                                        6358
                                                                                                             6042         5820
                                   5,603                                                                                                            5,466
                                                                                                                                        5,183
                    4,940
                                                                                                                          4,626
    4,349                                                                                      4,353
                                                                                 3,721
                                                                                 3 721                       3,922
                                                                                                              ,
                                                                3,671
                                                                3 671
                                                  3,193
                                   2,564
    2,184           2,096                                                                      2,005         2,120                                  2,137
                                                                                                                                        1,556
                                                                                                                          1,194


     2000           2001           2002           2003          2004             2005          2006          2007         2008          2009        2010


Annual Median Sale Price ‐ 2000 to 2010 
            Condo           Single Family                                        $351,000
                                                                                                $342,000      $336,250
                                                                                                                           $320,000

                                                                $272,500
                                                                                                  $301,225
                                                                                    $305,000
                                                    $226,000
                                                                      $225,000                                $303,000
                                      $191,000                                                                                           $210,000
                    $172,500
                                                        $191,000                                                          $230,000                   $163,000
$142,000
                                     $173,000
                    $145,000                                                                                                          $160,000       $163,000
      $132,300


   2000          2001            2002            2003          2004          2005           2006             2007         2008          2009        2010

May2011 stats

  • 1.
    For Immediate Release SarasotaAssociation of Realtors® June 14, 2011 For more information contact Kathy Roberts, 941-328-1170 Sales surge continues in May; condo prices soar The Sarasota real estate market continued its strong spring showing in May 2011, with 796 total sales reported by members of the Sarasota Association of Realtors® - the second highest total in the past six years. Only the March 2011 sales figure of 800 has been higher since the end of the real estate boom of 2003-2005. Prices for both single family homes and condos also climbed in May 2011, with the condo median sales price of $218,750 at the highest since October 2009. For single family homes, the figure in May rose to $159,000, just under the March high of $159,250, continuing the 2011 upward trend. The total available property inventory dropped to 5,010, another big decrease from last month’s level of 5,258, and once again the lowest level in the past six years. The inventory reached its apex in April 2007, when 17,089 properties were on the market. The lower inventory, combined with the higher sales rate, has now dropped the months of inventory to 5.8 months for single family homes and 7.4 months for condos, both figures the lowest since 2005. The 6 month level is traditionally a point which represents equilibrium in the market between buyers and sellers. At the point when the market was at its most unbalanced in favor of buyers, in November 2008, the figures were 24 months for single family homes and an incredible 41.7 months for condos. Once the figure trends downward below 6 months, buyers are often forced to compete for properties, which generally drives prices higher. “Clearly, we’ve seen an amazing improvement in our market in the past three years,” said SAR President Michael Bruno. “We have been trending in the right direction for several months now, and we’re starting to witness a return to the point where multiple buyers bid on a particular property. As the inventory of available properties drops, competition increases for the homes for sale, and prices naturally rise. The only thing holding back even greater appreciation appears to be the high percentage of distressed properties.” Even that statistic is trending in a healthy direction, as the overall percentage of distressed sales (short sales and foreclosure sales) dropped to 38 percent of the May 2011 sales. That compares to 47 percent as recently as February 2011 and a high of 51 percent in November 2010.
  • 2.
    The May statisticsalso compare favorably to May 2010, when the $8,000 federal homebuyer tax credit initiative was helping improve local sales. The tax credit drove up spring sales last year, but this year’s numbers are strong simply on the basis of the market’s wealth of quality homes and condos. Buyers are finding tremendous values at all price ranges and are making offers. Single family home sales stood at 546 for May 2011, roughly the same as last May (539). Condo sales were at 250, about 10 percent higher than last May (227). Median sales prices for single family homes was at $159,000, a little lower than last year at this time ($169,000), but higher than last month ($155,430) and comparable to the March 2011 high of the year ($159,250). For condominiums, the median sale price hit $218,750 in May, up from $185,500 last month, and 18 percent higher than May 2010 ($184,500). Pending sales dropped to 841 after hitting a recent peak of 1,208 in March 2011, continuing to reflect the seasonal population migration north. Pending sales are properties going under contract during the month, and the statistic is a strong indicator for the next two or three months of sales, as pending sales reflect current buyer activity. Last May, pending sales were at 857. “We aren’t seeing any lingering negative issues with our local market,” explained Bruno. “Judging from the statistics, and the continuing positive word of mouth I’ve been hearing from SAR members, the Sarasota real estate market is demonstrating strength and resilience during these difficult times.” ###
  • 3.
    Sarasota MLSSM Statistics- May 2011 Single Family Unit Sales Condo 700 600 500 400 300 200 100 0 May‐10 Jun‐10 Jul‐10 Aug‐10 Sep‐10 Oct‐10 Nov‐10 Dec‐10 Jan‐11 Feb‐11 Mar‐11 Apr‐11 May‐11 Single Family Median Sale Price Condo $250,000 $200,000 $150,000 $100,000 $50,000 $0 May‐10 Jun‐10 Jul‐10 Aug‐10 Sep‐10 Oct‐10 Nov‐10 Dec‐10 Jan‐11 Feb‐11 Mar‐11 Apr‐11 May‐11 Single Family    Average  Median  Median Last  Months  Pending  # New  # Off  #Active  #Sold  %Sold  %Pending  DOM  Sale Prices  12 Months  Inventory  Reported  Listings  Market  This  Month  3,148  546  17.3  192  $159,000  $155,990  5.8  609  19.3  434  186  This  Month  3,883  539  13.9  168  $169,000  $165,000  7.2  626  16.1  711  214  Last Year  Last  Month  3,321  533  16.0  169  $155,430  $158,000  6.2  687  20.7  512  166  YTD  ‐  2,599  ‐  179  $150,000  ‐  ‐  3,669  ‐  2,842  ‐      Single Family – Sale Price Vs. List Price % Rates   Jan  Feb  Mar  Apr  May  Jun  Jul  Aug  Sept  Oct  Nov  Dec  2010  94.4  92.8  95.2  94.8  95.2  95.3  94.7  95.2  94.6  95.2  94.8  94.1  2011  94.5  94.1  94.7  94.1  94.2  ‐  ‐  ‐  ‐  ‐  ‐  ‐    Statistics were compiled on properties listed in the MLS by members of the Sarasota Association of Realtors® as of June 10th, 2011, including some listings in Manatee, Englewood, Venice, and other areas. Single-family statistics are tabulated using property styles of single-family and villa. Condo statistics include condo, co-op, and townhouse. Source: Sarasota Association of Realtors® 16 JULY 2011 Sarasota Realtor® Magazine www.sarasotarealtors.com
  • 4.
    Sarasota MLSSM Statistics- May 2011 Single Family Inventory Condo 5,000 4,000 3,000 2,000 1,000 0 May‐10 Jun‐10 Jul‐10 Aug‐10 Sep‐10 Oct‐10 Nov‐10 Dec‐10 Jan‐11 Feb‐11 Mar‐11 Apr‐11 May‐11 Single Family Pending Sales Condo 1000 900 800 700 600 500 400 300 200 100 0 May‐10 Jun‐10 Jul‐10 Aug‐10 Sep‐10 Oct‐10 Nov‐10 Dec‐10 Jan‐11 Feb‐11 Mar‐11 Apr‐11 May‐11 Condo    Average  Median Sale  Median Last  Months of Pending  # New  # Off  #Active  #Sold  %Sold  %Pending  DOM  Prices  12 Months  Inventory  Reported  Listings  Market  This  Month  1,862  250  13.4  228  $218,750  $160,000  7.4  232  12.4  212  211  This  Month  2,211  227  10.3  213  $184,500  $192,000  9.7  231  10.4  298  209  Last Year  Last  Month  1,937  226  11.7  230  $185,500  $160,000  8.6  272  14.0  224  197  YTD  ‐  1,076  ‐  214  $170,000  ‐  ‐  1,275  ‐  1,362  ‐    Condo – Sale Price Vs. List Price % Rates   Jan  Feb  Mar  Apr  May  Jun  Jul  Aug  Sept  Oct  Nov  Dec  2010  92.5  92.4  92.5  93.2  94.2  93.7  94.2  93.5  93.2  94.3  94.5  92.9  2011  93.4  91.2  92.2  93.4  94.5  ‐  ‐  ‐  ‐  ‐  ‐  ‐    Median sales price is the middle value, where half of the homes sold for more, and half sold for less. Listings sold were closed transac- tions during the month. Pending sales are sales where an offer has been accepted during the month, but the sale has not yet closed. Even though some pending sales never close, pending sales are an indicator of current buyer activity. DOM indicates the average number of days that sold properties were on the market before a contract was executed. Sarasota Association of Realtors® MLS www.sarasotarealtors.com Sarasota Realtor® Magazine JULY 2011 17
  • 5.
    Single Family Days on Market The Xtra Pages - Digital Version Only Condo 250 200 150 100 50 0 May‐10 Jun‐10 Jul‐10 Aug‐10 Sep‐10 Oct‐10 Nov‐10 Dec‐10 Jan‐11 Feb‐11 Mar‐11 Apr‐11 May‐11 Single Family New Listings Condo 900 800 700 600 500 400 300 200 100 0 May‐10 Jun‐10 Jul‐10 Aug‐10 Sep‐10 Oct‐10 Nov‐10 Dec‐10 Jan‐11 Feb‐11 Mar‐11 Apr‐11 May‐11 Single Family Months of Inventory Condo 18.0 16.0 14.0 12.0 10.0 8.0 6.0 4.0 2.0 0.0 May‐10 Jun‐10 Jul‐10 Aug‐10 Sep‐10 Oct‐10 Nov‐10 Dec‐10 Jan‐11 Feb‐11 Mar‐11 Apr‐11 May‐11 Single Family Sales Volume Condo $200,000,000  $180,000,000  $160,000,000  $140,000,000  $120,000,000  $100,000,000  Sarasota Association of Realtors® MLS $80,000,000  $60,000,000  $40,000,000  $20,000,000  $0  May‐10 Jun‐10 Jul‐10 Aug‐10 Sep‐10 Oct‐10 Nov‐10 Dec‐10 Jan‐11 Feb‐11 Mar‐11 Apr‐11 May‐11
  • 6.
    First Quarter 2011Report Single Family Sales ‐ By Quarter REO Short Arm's Length 1000 800 600 400 200 0 2008‐Q3 2008‐Q4 2009‐Q1 2009‐Q2 2009‐Q3 2009‐Q4 2010‐Q1 2010‐Q2 2010‐Q3 2010‐Q4 2011‐Q1 * Homebuyer Tax Credit In Effect Condo Sales ‐ By Quarter REO Short Arm's Length 500 400 300 200 100 0 2008‐Q3 2008‐Q4 2009‐Q1 2009‐Q2 2009‐Q3 2009‐Q4 2010‐Q1 2010‐Q2 2010‐Q3 2010‐Q4 2011‐Q1 * Homebuyer Tax Credit In Effect Single Family Median Sale Price REO Short Arm's Length $300,000  $250,000  $200,000  $150,000  $100,000  $50,000  $0  2008‐3rdQ 2008‐4thQ 2009‐1stQ 2009‐2ndQ 2009‐3rdQ 2009‐4thQ 2010‐Q1 2010‐Q2 2010‐Q3 2010‐Q4 2011‐Q1 Condo Median Sale Price REO Short Arm's Length $350,000  $300,000  $250,000  $200,000  $150,000  $100,000  Source: Sarasota Association of Realtors® $50,000  $0  2008‐3rdQ 2008‐4thQ 2009‐1stQ 2009‐2ndQ 2009‐3rdQ 2009‐4thQ 2010‐Q1 2010‐Q2 2010‐Q3 2010‐Q4 2011‐Q1
  • 7.
    Single Family REO Sales ‐ By Quarter Condo 600 500 400 300 200 100 0 2008‐Q1 2008‐Q2 2008‐Q3 2008‐Q4 2009‐Q1 2009‐Q2 2009‐Q3 2009‐Q4 2010‐Q1 2010‐Q2 2010‐Q3 2010‐Q4 2011‐Q1 * Homebuyer Tax Credit In Effect Single Family Short Sales ‐ By Quarter Condo 400 350 300 250 200 150 100 50 0 2008‐Q3 2008‐Q4 2009‐Q1 2009‐Q2 2009‐Q3 2009‐Q4 2010‐Q1 2010‐Q2 2010‐Q3 2010‐Q4 2011‐Q1 * Homebuyer Tax Credit In Effect Single Family Arm's Length Sales ‐ By Quarter Condo 1000 800 600 400 200 0 2008‐Q3 2008‐Q4 2009‐Q1 2009‐Q2 2009‐Q3 2009‐Q4 2010‐Q1 2010‐Q2 2010‐Q3 2010‐Q4 2011‐Q1 * Homebuyer Tax Credit In Effect Source: Sarasota Association of Realtors®
  • 8.
    Annual Sales ‐ 2000 to 2010 Single Family Single Family Condo Total 11267 10562 9697 8167 7,596 7603 7036 6,841 6533 6739 6,504 6 504 6358 6042 5820 5,603 5,466 5,183 4,940 4,626 4,349 4,353 3,721 3 721 3,922 , 3,671 3 671 3,193 2,564 2,184 2,096 2,005 2,120 2,137 1,556 1,194 2000 2001 2002 2003 2004 2005 2006 2007 2008 2009 2010 Annual Median Sale Price ‐ 2000 to 2010  Condo Single Family $351,000 $342,000 $336,250 $320,000 $272,500 $301,225 $305,000 $226,000 $225,000 $303,000 $191,000 $210,000 $172,500 $191,000 $230,000 $163,000 $142,000 $173,000 $145,000 $160,000 $163,000 $132,300 2000 2001 2002 2003 2004 2005 2006 2007 2008 2009 2010