
More Related Content
What's hot
What's hot (10)
Viewers also liked
Similar to Toronto Market Trends
Similar to Toronto Market Trends (20)
Recently uploaded
Recently uploaded (11)
Toronto Market Trends
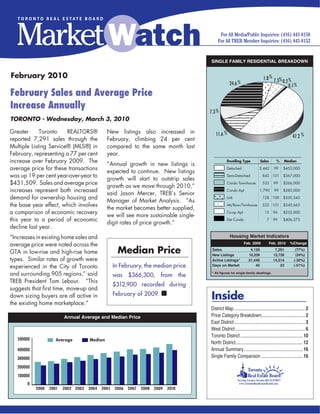
- 1. SINGLE FAMILY RESIDENTIAL BREAKDOWN February 2010 1.8 % 7.3% % 24.6 % 0.2 0.1 % February Sales and Average Price Increase Annually 7.3 % TORONTO - Wednesday, March 3, 2010 Greater Toronto REALTORS® New listings also increased in 11.6 % 47.2 % reported 7,291 sales through the February, climbing 24 per cent Multiple Listing Service® (MLS®) in compared to the same month last February, representing a 77 per cent year. increase over February 2009. The 2.3 % 7.0 % % Dwelling Type Sales % Median “Annual 21.5 % growth in new listings is 0.3 average price for these transactions 0.1 % Single Detached 3,442 Detached 99 $453,000 expected to continue. New listings was up 19 per cent year-over-year to Semi Detached Semi-Detached 843 101 $367,000 growth will start to outstrip sales $431,509. Sales and average price Condo T.H. Condo Townhouse 533 99 $266,000 growth as we move through 2010,” increases represent both increased Condo Apt. Condo Apt 1,790 99 $285,000 said % Jason Mercer, TREB’s Senior 8.5 demand for ownership housing and Link Link 128 100 $350,345 Manager of Market Analysis. “As the base year effect, which involves Attached/Row Att/Row/Twnhouse 533 101 $343,663 the market becomes better supplied, a comparison of economic recovery 12.0 % Co-op Apt. Co-op Apt 15 96 $232,000 we will see more sustainable single- % 48.3 this year to a period of economic Detached Condo Det Condo 7 99 $406,573 digit rates of price growth.” decline last year. “Increases in existing home sales and Housing Market Indicators Feb. 2009 Feb. 2010 %Change average price were noted across the GTA in low-rise and high-rise home Median Price Sales New Listings 4,120 10,239 7,291 12,726 (77%) (24%) types. Similar rates of growth were Active Listings* 21,440 14,514 (-32%) experienced in the City of Toronto In February, the median price Days on Market 45 22 (-51%) and surrounding 905 regions,” said was $366,300, from the * All figures for single-family dwellings. TREB President Tom Lebour. “This $312,900 recorded during suggests that first time, move-up and down sizing buyers are all active in the existing home marketplace.” February of 2009. n Inside District Map ............................................................. 2 Annual Average and Median Price Price Category Breakdown......................................2 East District ............................................................. 3 West District ............................................................ 6 Toronto District ......................................................10 500000 Average Median North District..........................................................12 400000 Annual Summary ...................................................16 300000 Single Family Comparison ....................................16 200000 100000 0 2000 2001 2002 2003 2004 2005 2006 2007 2008 2009 2010
- 2. District Map Price Category Breakdown - February 2010 Price Range Total S.F.D %S.F.D Condo Apt. %Condo Apt. Condo T.H. %Condo T.H. - - $90,000 28 0.4 16 0.9 5 0.9 $90,001 - $100,000 8 0.1 4 0.2 3 0.6 $100,001 - $110,000 14 0.2 8 0.4 3 0.6 $110,001 - $120,000 21 0.3 14 0.8 5 0.9 $120,001 - $130,000 30 0.4 20 1.1 3 0.6 $130,001 - $140,000 34 0.5 22 1.2 5 0.9 $140,001 - $150,000 43 0.6 30 1.7 5 0.9 $150,001 - $160,000 64 0.9 40 2.2 15 2.8 $160,001 - $170,000 82 1.1 50 2.8 17 3.2 $170,001 - $180,000 79 1.1 46 2.6 15 2.8 $180,001 - $190,000 106 1.5 52 2.9 17 3.2 $190,001 - $200,000 94 1.3 49 2.7 9 1.7 $200,001 - $225,000 319 4.4 152 8.5 56 10.5 $225,001 - $250,000 401 5.5 153 8.5 66 12.4 $250,001 - $300,000 912 12.5 341 19.1 99 18.6 $300,001 - $400,000 2,046 28.1 479 26.8 143 26.8 $400,001 - $500,000 1,258 17.3 180 10.1 34 6.4 $500,001 - $750,000 1,201 16.5 99 5.5 24 4.5 $750,001 - $1,000,000 290 4.0 25 1.4 6 1.1 $1,000,001 - $1,500,000 170 2.3 6 0.3 3 0.6 $1,500,001 - - 91 1.2 4 0.2 - - Total: 7,291 100 1,790 100 533 100 2 TORONTO REAL ESTATE BOARD
- 3. East District Current Month: February 2010 Area Active New Sales $ Volume Avg Price Med Price Avg DOM Avg %List E01 85 114 61 $30,683,604 $503,010 $470,000 11 107 E02 80 94 63 $38,789,397 $615,705 $550,011 19 104 E03 133 151 96 $41,975,028 $437,240 $420,000 18 102 E04 145 126 80 $22,242,920 $278,037 $285,000 23 101 E05 114 121 72 $24,050,600 $334,036 $305,425 22 100 E06 97 105 49 $18,779,801 $383,261 $352,000 15 102 E07 109 106 56 $18,209,905 $325,177 $337,250 18 101 E08 155 133 76 $22,944,420 $301,900 $319,400 25 98 E09 239 181 104 $27,925,375 $268,513 $261,500 24 99 E10 72 74 45 $18,565,388 $412,564 $412,000 18 99 E11 196 150 102 $30,925,000 $303,186 $289,500 26 99 E12 35 29 17 $5,090,000 $299,412 $267,000 21 98 E13 160 169 77 $26,352,800 $342,244 $330,000 23 99 E14 245 280 180 $58,407,957 $324,489 $310,000 22 99 E15 254 261 116 $35,932,204 $309,760 $291,000 17 99 E16 483 375 215 $48,630,145 $226,187 $215,000 31 98 E17 214 184 123 $30,396,040 $247,122 $232,000 28 98 E18 24 13 4 $1,656,000 $414,000 $350,500 64 94 E19 86 65 38 $14,552,310 $382,956 $349,500 20 99 E20 79 39 18 $4,238,900 $235,494 $238,000 58 96 E21 136 66 31 $9,498,000 $306,387 $270,000 44 95 TOTAL 3,141 2,836 1,623 $529,845,794 $326,461 $297,000 24 100 Year-to-Date: February 2010 Area Listed Sales $ Volume Avg Price Med Price Avg DOM Avg %List E01 183 96 $45,496,284 $473,920 $456,000 16 105 E02 168 105 $63,274,325 $602,613 $549,900 17 103 E03 272 161 $66,423,278 $412,567 $395,400 21 101 E04 237 131 $36,760,720 $280,616 $290,000 23 100 E05 206 130 $41,480,498 $319,081 $283,000 23 101 E06 163 81 $30,974,101 $382,396 $351,000 18 102 E07 183 110 $36,104,305 $328,221 $340,500 29 101 E08 244 126 $37,114,520 $294,560 $318,000 27 98 E09 349 196 $51,008,193 $260,246 $250,875 26 99 E10 132 86 $34,093,088 $396,431 $380,000 21 100 E11 285 162 $47,104,702 $290,770 $280,850 28 98 E12 60 29 $8,820,700 $304,162 $281,500 22 99 E13 264 127 $42,682,522 $336,083 $326,000 22 99 E14 481 279 $90,332,997 $323,774 $310,000 22 99 E15 429 210 $63,613,454 $302,921 $287,650 20 99 E16 690 343 $77,674,798 $226,457 $214,000 32 97 E17 328 194 $48,563,230 $250,326 $235,500 31 98 E18 22 5 $2,279,500 $455,900 $366,000 70 94 E19 129 59 $21,995,798 $372,810 $345,000 22 99 E20 73 38 $10,466,000 $275,421 $261,200 55 97 E21 124 52 $17,643,400 $339,296 $295,000 49 96 TOTAL 5,022 2,720 $873,906,413 $321,289 $295,000 26 99 TORONTO REAL ESTATE BOARD 3
- 4. SINGLE FAMILY EAST BREAKDOWN - FEBRuARY 2010 East District East District East District 80 Days on Market 80 Sales Active Listing Ratio 60 60 40 40 20 20 0 0 Feb Mar Apr May Jun Jul Aug Sep Oct Nov Dec Jan Feb Feb Mar Apr May Jun Jul Aug Sep Oct Nov Dec Jan Fab 2009 2010 2009 2010 Detached Houses Semi-Detached Houses Area Act Sales Av. Price Med. Price % S-A Av. % List Area Act Sales Av. Price Med. Price % S-A Av. % List E01 16 14 $575,759 $462,000 87.5 107 E01 41 29 $485,879 $486,000 70.7 108 E02 34 22 $756,069 $704,008 64.7 102 E02 24 28 $546,606 $511,500 116.7 106 E03 68 46 $556,355 $482,323 67.7 103 E03 24 22 $458,286 $435,000 91.7 105 E04 45 34 $377,877 $373,300 75.6 104 E04 11 3 $266,000 $258,000 27.3 96 E05 26 22 $497,741 $470,000 84.6 101 E05 4 3 $389,333 $400,000 75.0 100 E06 81 36 $377,678 $326,000 44.4 101 E06 8 6 $394,833 $332,500 75.0 103 E07 38 21 $432,399 $435,000 55.3 104 E07 5 8 $346,899 $344,000 160.0 103 E08 70 41 $386,336 $368,000 58.6 99 E08 5 1 $275,000 $275,000 20.0 99 E09 54 31 $348,264 $356,000 57.4 100 E09 3 3 $310,167 $319,000 100.0 101 E10 53 33 $452,466 $435,000 62.3 100 E10 3 4 $355,750 $349,000 133.3 99 E11 56 42 $391,036 $409,500 75.0 99 E11 14 17 $310,165 $305,000 121.4 99 E12 14 7 $322,071 $325,000 50.0 98 E12 1 5 $307,700 $267,000 500.0 100 E13 103 40 $421,860 $400,000 38.8 99 E13 5 4 $338,625 $341,250 80.0 100 E14 176 114 $360,269 $341,000 64.8 99 E14 12 17 $286,146 $289,000 141.7 98 E15 179 72 $344,275 $328,000 40.2 100 E15 4 6 $253,067 $262,500 150.0 99 E16 379 147 $251,383 $244,500 38.8 98 E16 37 34 $180,262 $186,500 91.9 98 E17 148 82 $268,063 $249,000 55.4 98 E17 7 4 $184,625 $177,000 57.1 96 E18 24 4 $414,000 $350,500 16.7 94 E18 - - - - - - E19 81 31 $410,930 $353,000 38.3 99 E19 - - - - - - E20 72 16 $240,025 $252,000 22.2 96 E20 1 - - - - - E21 132 28 $318,143 $289,500 21.2 95 E21 1 3 $196,667 $192,000 300.0 98 4 TORONTO REAL ESTATE BOARD
- 5. SINGLE FAMILY EAST BREAKDOWN - FEBRuARY 2010 East District Condo Apartment Link Area Act Sales Av. Price Med. Price % S-A Av. % List Area Act Sales Av. Price Med. Price % S-A Av. % List E01 16 8 $443,250 $446,000 50.0 105 E01 - - - - - - E02 11 2 $438,450 $438,450 18.2 100 E02 - - - - - - E03 33 21 $200,448 $159,500 63.6 97 E03 - - - - - - E04 66 36 $185,801 $183,000 54.6 97 E04 - - - - - - E05 58 27 $223,354 $206,000 46.6 99 E05 8 2 $425,000 $425,000 25.0 103 E06 4 1 $401,900 $401,900 25.0 122 E06 - - - - - - E07 54 21 $202,502 $202,000 38.9 99 E07 6 3 $362,767 $355,300 50.0 102 E08 55 23 $181,059 $175,000 41.8 98 E08 1 - - - - - E09 146 61 $233,541 $230,500 41.8 98 E09 - - - - - - E10 3 2 $142,000 $142,000 66.7 97 E10 1 1 $470,000 $470,000 100.0 96 E11 86 16 $158,069 $158,800 18.6 98 E11 3 4 $293,250 $301,500 133.3 100 E12 1 1 $190,000 $190,000 100.0 96 E12 1 - - - - - E13 13 10 $217,430 $184,950 76.9 99 E13 1 3 $320,167 $330,000 300.0 100 E14 13 6 $214,167 $194,750 46.2 101 E14 1 6 $258,667 $249,000 600.0 100 E15 33 8 $245,382 $245,500 24.2 98 E15 10 9 $282,189 $282,100 90.0 99 E16 22 - - - - - E16 5 5 $218,770 $217,000 100.0 97 E17 12 4 $161,000 $158,250 33.3 97 E17 22 13 $232,154 $231,000 59.1 99 E18 - - - - - - E18 - - - - - - E19 - - - - - - E19 1 1 $295,000 $295,000 100.0 102 E20 2 1 $173,500 $173,500 50.0 97 E20 2 1 $225,000 $225,000 50.0 99 E21 2 - - - - - E21 - - - - - - Condo Townhouse Detached Condo Area Act Sales Av. Price Med. Price % S-A Av. % List Area Act Sales Av. Price Med. Price % S-A Av. % List E01 2 1 $450,000 $450,000 50.0 118 E01 - - - - - - E02 6 6 $515,833 $532,150 100.0 101 E02 - - - - - - E03 2 5 $294,200 $303,000 250.0 98 E03 - - - - - - E04 16 7 $272,613 $275,000 43.8 103 E04 - - - - - - E05 16 16 $267,884 $262,500 100.0 101 E05 - - - - - - E06 2 - - - - - E06 - - - - - - E07 5 - - - - - E07 - - - - - - E08 20 9 $227,378 $217,000 45.0 98 E08 - - - - - - E09 31 6 $201,117 $197,500 19.4 96 E09 - - - - - - E10 7 2 $196,000 $196,000 28.6 99 E10 - - - - - - E11 26 13 $219,877 $222,000 50.0 98 E11 1 - - - - - E12 10 3 $202,333 $185,000 30.0 96 E12 - - - - - - E13 24 10 $224,400 $232,000 41.7 99 E13 - - - - - - E14 18 15 $230,684 $236,000 83.3 98 E14 - - - - - - E15 15 5 $212,650 $195,000 33.3 97 E15 - - - - - - E16 36 22 $132,989 $128,675 61.1 97 E16 - - - - - - E17 8 4 $172,875 $167,000 50.0 97 E17 - - - - - - E18 - - - - - - E18 - - - - - - E19 1 - - - - - E19 - - - - - - E20 2 - - - - - E20 - - - - - - E21 1 - - - - - E21 - - - - - - TORONTO REAL ESTATE BOARD 5
- 6. SINGLE FAMILY EAST BREAKDOWN - FEBRuARY 2010 East District Co-op Apartment Attached/Row/Townhouse Area Act Sales Av. Price Med. Price % S-A Av. % List Area Act Sales Av. Price Med. Price % S-A Av. % List E01 - - - - - - E01 10 9 $504,056 $500,000 90.0 107 E02 - - - - - - E02 5 5 $575,800 $495,900 100.0 105 E03 1 - - - - - E03 5 2 $310,000 $310,000 40.0 100 E04 - - - - - - E04 7 - - - - - E05 - - - - - - E05 2 2 $382,800 $382,800 100.0 105 E06 - - - - - - E06 2 6 $402,083 $402,250 300.0 100 E07 - - - - - - E07 1 3 $337,833 $338,000 300.0 96 E08 - - - - - - E08 4 2 $309,450 $309,450 50.0 100 E09 - 1 $107,000 $107,000 - 98 E09 5 2 $319,500 $319,500 40.0 98 E10 - - - - - - E10 5 3 $355,000 $370,000 60.0 102 E11 - - - - - - E11 10 10 $266,820 $258,000 100.0 99 E12 - - - - - - E12 8 1 $500,000 $500,000 12.5 99 E13 - - - - - - E13 14 10 $274,510 $277,500 71.4 99 E14 - - - - - - E14 25 22 $280,705 $284,500 88.0 100 E15 - - - - - - E15 13 16 $253,750 $256,250 123.1 100 E16 - - - - - - E16 4 7 $218,343 $215,000 175.0 98 E17 - - - - - - E17 17 16 $207,681 $204,500 94.1 99 E18 - - - - - - E18 - - - - - - E19 - - - - - - E19 3 6 $253,079 $253,738 200.0 100 E20 - - - - - - E20 - - - - - - E21 - - - - - - E21 - - - - - - West District Current Month: February 2010 Area Active New Sales $ Volume Avg Price Med Price Avg DOM Avg %List W01 67 56 39 $20,088,888 $515,100 $456,000 14 104 W02 81 88 53 $25,356,492 $478,424 $440,000 16 105 W03 134 110 58 $19,066,624 $328,735 $335,750 25 99 W04 186 108 65 $20,217,200 $311,034 $294,000 35 98 W05 368 219 84 $26,591,350 $316,564 $331,500 24 98 W06 200 183 107 $41,747,680 $390,165 $380,000 29 100 W07 81 86 57 $29,171,705 $511,784 $492,500 22 101 W08 165 155 102 $68,713,100 $673,658 $505,500 23 100 W09 126 69 44 $17,184,338 $390,553 $396,250 31 98 W10 287 164 83 $21,276,950 $256,349 $245,000 32 98 W12 193 153 88 $43,221,299 $491,151 $417,500 24 98 W13 188 148 68 $51,995,900 $764,646 $491,000 29 98 W14 104 104 47 $16,737,904 $356,126 $325,000 19 98 W15 339 296 191 $51,840,456 $271,416 $247,000 23 98 W16 86 92 75 $31,232,000 $416,427 $395,000 15 99 W17 - - - - - - - - W18 96 64 35 $9,586,000 $273,886 $285,000 40 98 W19 326 325 174 $71,870,043 $413,046 $407,750 15 100 W20 301 348 200 $77,356,114 $386,781 $374,000 17 99 W21 358 288 154 $92,453,659 $600,348 $509,850 27 99 W22 129 194 130 $49,737,379 $382,595 $368,750 12 100 W23 683 693 377 $129,965,006 $344,735 $335,000 18 99 W24 557 515 274 $101,596,284 $370,789 $348,950 20 98 W25 96 72 37 $15,329,638 $414,315 $375,000 27 98 W26 30 14 5 $2,820,000 $564,000 $570,000 48 97 W27 137 128 98 $41,290,030 $421,327 $385,750 28 99 W28 176 120 63 $30,669,114 $486,811 $453,000 28 99 W29 109 70 45 $13,208,400 $293,520 $280,000 33 97 TOTAL 5,603 4,862 2,753 $1,120,323,553 $406,946 $358,000 22 99 6 TORONTO REAL ESTATE BOARD
- 7. SINGLE FAMILY WEST BREAKDOWN - FEBRuARY 2010 West District West District West District 80 Days on Market 80 Sales Active Listing Ratio 60 60 40 40 20 20 0 0 Feb Mar Apr May Jun Jul Aug Sep Oct Nov Dec Jan Feb Feb Mar Apr May Jun Jul Aug Sep Oct Nov Dec Jan Feb 2009 2010 2009 2010 Year-to-Date: February 2010 Area Listed Sales $ Volume Avg Price Med Price Avg DOM Avg %List W01 113 71 $35,582,655 $501,164 $441,123 20 103 W02 160 99 $46,914,496 $473,884 $425,000 18 105 W03 200 94 $30,625,624 $325,805 $329,250 24 100 W04 222 125 $39,639,450 $317,116 $306,000 35 98 W05 405 153 $46,579,550 $304,442 $319,500 28 98 W06 290 168 $65,123,234 $387,638 $371,250 29 100 W07 165 95 $46,784,718 $492,471 $481,750 20 101 W08 275 167 $104,394,400 $625,116 $445,000 27 100 W09 141 72 $25,398,916 $352,763 $352,500 30 97 W10 333 139 $34,893,850 $251,035 $221,000 34 97 W12 277 147 $70,182,985 $477,435 $389,900 30 98 W13 256 101 $77,193,400 $764,291 $493,000 27 98 W14 158 77 $27,482,503 $356,916 $325,000 24 98 W15 579 329 $89,354,921 $271,596 $246,000 24 98 W16 191 130 $54,329,360 $417,918 $394,500 22 99 W17 - - - - - - - W18 106 65 $17,981,651 $276,641 $284,000 37 97 W19 566 289 $116,886,358 $404,451 $392,000 17 99 W20 608 329 $130,977,930 $398,109 $378,000 17 99 W21 490 268 $162,021,546 $604,558 $521,650 27 99 W22 319 217 $82,881,679 $381,943 $368,000 14 100 W23 1,217 667 $227,307,681 $340,791 $331,000 22 99 W24 886 469 $173,023,585 $368,920 $349,900 23 98 W25 123 68 $27,133,988 $399,029 $371,000 32 98 W26 22 10 $5,600,500 $560,050 $526,250 81 96 W27 223 156 $64,741,130 $415,007 $388,200 30 99 W28 204 105 $50,680,914 $482,675 $450,000 30 99 W29 143 77 $22,925,913 $297,739 $274,513 33 97 TOTAL 8,672 4,687 $1,876,642,937 $400,393 $352,000 24 99 TORONTO REAL ESTATE BOARD 7
- 8. SINGLE FAMILY WEST BREAKDOWN - FEBRuARY 2010 West District Detached Houses Semi-Detached Houses Area Act Sales Av. Price Med. Price % S-A Av. % List Area Act Sales Av. Price Med. Price % S-A Av. % List W01 30 11 $772,591 $775,000 36.7 105 W01 10 8 $552,738 $579,250 80.0 110 W02 35 20 $597,946 $621,500 57.1 105 W02 19 17 $442,633 $425,000 89.5 111 W03 84 31 $340,784 $345,000 36.9 99 W03 27 19 $354,670 $336,500 70.4 101 W04 75 28 $406,357 $409,750 37.3 99 W04 6 10 $335,950 $358,000 166.7 98 W05 68 26 $419,477 $404,000 38.2 101 W05 63 30 $382,768 $336,500 47.6 97 W06 42 38 $463,603 $436,000 90.5 102 W06 3 3 $489,000 $510,000 100.0 108 W07 38 25 $665,456 $595,000 65.8 102 W07 - - - - - - W08 106 57 $990,388 $795,000 53.8 101 W08 1 3 $444,333 $437,000 300.0 107 W09 38 22 $567,123 $549,000 57.9 100 W09 3 1 $328,500 $328,500 33.3 100 W10 65 37 $361,908 $350,000 56.9 100 W10 11 2 $349,100 $349,100 18.2 99 W12 126 49 $635,088 $540,000 38.9 97 W12 4 4 $363,125 $363,000 100.0 105 W13 118 41 $1,084,805 $730,000 34.8 97 W13 15 7 $329,443 $327,000 46.7 100 W14 23 10 $635,750 $604,000 43.5 99 W14 7 8 $412,563 $414,250 114.3 101 W15 16 10 $506,950 $460,000 62.5 100 W15 9 7 $381,143 $382,000 77.8 100 W16 44 37 $523,414 $470,000 84.1 99 W16 9 19 $361,442 $365,000 211.1 101 W17 - - - - - - W17 - - - - - - W18 32 13 $335,923 $340,000 40.6 99 W18 25 11 $279,645 $283,000 44.0 98 W19 100 72 $544,439 $514,194 72.0 99 W19 35 31 $405,276 $408,000 88.6 100 W20 127 70 $521,536 $488,000 55.1 99 W20 47 43 $379,867 $380,500 91.5 100 W21 236 100 $715,478 $585,500 42.4 98 W21 9 12 $411,825 $405,000 133.3 101 W22 88 57 $455,440 $440,000 64.8 100 W22 19 28 $354,471 $353,000 147.4 101 W23 430 225 $385,624 $372,000 52.3 99 W23 119 80 $304,373 $309,500 67.2 99 W24 326 160 $437,118 $430,500 49.1 98 W24 75 51 $319,926 $316,000 68.0 99 W25 59 19 $542,267 $500,000 32.2 97 W25 2 4 $367,250 $372,500 200.0 100 W26 30 5 $564,000 $570,000 16.7 97 W26 - - - - - - W27 117 67 $480,812 $460,000 57.3 99 W27 2 3 $347,767 $344,000 150.0 99 W28 163 50 $524,512 $467,450 30.7 98 W28 7 3 $361,333 $359,000 42.9 101 W29 84 34 $326,297 $308,250 40.5 97 W29 9 1 $205,000 $205,000 11.1 98 Condo Apartment Link Area Act Sales Av. Price Med. Price % S-A Av. % List Area Act Sales Av. Price Med. Price % S-A Av. % List W01 17 12 $340,949 $338,500 70.6 102 W01 - - - - - - W02 14 11 $354,209 $381,000 78.6 99 W02 - - - - - - W03 20 5 $175,200 $153,000 25.0 96 W03 - - - - - - W04 71 16 $166,219 $165,000 22.5 96 W04 - - - - - - W05 128 16 $132,344 $132,250 12.5 96 W05 - - - - - - W06 145 60 $335,728 $310,000 41.4 99 W06 - - - - - - W07 34 26 $348,223 $323,250 76.5 100 W07 - - - - - - W08 49 36 $256,028 $252,000 73.5 98 W08 - - - - - - W09 76 15 $161,433 $118,500 19.7 94 W09 - - - - - - W10 150 34 $158,541 $161,000 22.7 97 W10 3 - - - - - W12 33 22 $250,923 $231,500 66.7 98 W12 - - - - - - W13 13 3 $220,333 $192,000 23.1 98 W13 - - - - - - W14 31 13 $221,885 $218,000 41.9 98 W14 1 - - - - - W15 285 153 $244,166 $237,000 53.7 98 W15 1 - - - - - W16 14 9 $233,922 $182,000 64.3 97 W16 - 1 $426,000 $426,000 - 107 W17 - - - - - - W17 - - - - - - W18 21 3 $148,333 $146,000 14.3 98 W18 - - - - - - W19 124 33 $225,779 $214,000 26.6 98 W19 1 1 $407,500 $407,500 100.0 102 W20 40 18 $202,833 $203,750 45.0 98 W20 2 4 $415,500 $417,500 200.0 99 W21 74 9 $330,000 $265,000 12.2 98 W21 1 1 $389,900 $389,900 100.0 100 W22 1 4 $227,775 $220,000 400.0 100 W22 - - - - - - W23 27 14 $196,761 $201,000 51.9 98 W23 5 4 $315,500 $322,000 80.0 103 W24 57 13 $163,323 $158,500 22.8 97 W24 3 - - - - - W25 16 6 $202,167 $211,000 37.5 99 W25 - - - - - - W26 - - - - - - W26 - - - - - - W27 4 - - - - - W27 1 2 $327,000 $327,000 200.0 99 W28 - 1 $499,514 $499,514 - 106 W28 1 - - - - - W29 13 2 $169,250 $169,250 15.4 97 W29 1 - - - - - 8 TORONTO REAL ESTATE BOARD
- 9. SINGLE FAMILY WEST BREAKDOWN - FEBRuARY 2010 West District Condo Townhouse Detached Condo Area Act Sales Av. Price Med. Price % S-A Av. % List Area Act Sales Av. Price Med. Price % S-A Av. % List W01 5 7 $369,443 $375,000 140.0 101 W01 - - - - - - W02 5 3 $324,667 $315,000 60.0 98 W02 - - - - - - W03 2 1 $351,000 $351,000 50.0 106 W03 - - - - - - W04 30 9 $244,022 $230,000 30.0 97 W04 - - - - - - W05 98 9 $176,767 $167,000 9.2 97 W05 - - - - - - W06 5 3 $387,033 $399,000 60.0 100 W06 - - - - - - W07 - - - - - - W07 - - - - - - W08 4 6 $285,167 $283,500 150.0 98 W08 - - - - - - W09 3 4 $359,410 $365,444 133.3 101 W09 - - - - - - W10 54 9 $156,972 $177,500 16.7 95 W10 - - - - - - W12 21 11 $315,836 $323,000 52.4 100 W12 7 2 $827,500 $827,500 28.6 97 W13 39 16 $269,488 $261,000 41.0 98 W13 - - - - - - W14 37 16 $262,213 $306,000 43.2 97 W14 - - - - - - W15 28 21 $321,219 $280,000 75.0 98 W15 - - - - - - W16 18 9 $274,111 $265,000 50.0 100 W16 - - - - - - W17 - - - - - - W17 - - - - - - W18 14 7 $200,414 $186,000 50.0 96 W18 - - - - - - W19 58 26 $308,700 $319,000 44.8 100 W19 - - - - - - W20 65 47 $271,727 $265,000 72.3 99 W20 1 - - - - - W21 11 12 $285,158 $294,500 109.1 99 W21 - - - - - - W22 2 6 $238,717 $226,400 300.0 100 W22 - - - - - - W23 58 17 $239,947 $240,000 29.3 99 W23 - - - - - - W24 60 16 $191,506 $184,500 26.7 97 W24 4 1 $360,000 $360,000 25.0 97 W25 8 5 $255,180 $227,900 62.5 97 W25 - - - - - - W26 - - - - - - W26 - - - - - - W27 12 13 $225,346 $224,000 108.3 98 W27 - - - - - - W28 1 1 $358,000 $358,000 100.0 98 W28 - - - - - - W29 2 3 $154,667 $155,000 150.0 96 W29 - - - - - - Co-op Apartment Attached/Row/Townhouse Area Act Sales Av. Price Med. Price % S-A Av. % List Area Act Sales Av. Price Med. Price % S-A Av. % List W01 - - - - - - W01 5 1 $491,000 $491,000 20.0 109 W02 - - - - - - W02 8 2 $501,250 $501,250 25.0 96 W03 - - - - - - W03 1 2 $268,300 $268,300 200.0 100 W04 - - - - - - W04 4 2 $312,000 $312,000 50.0 96 W05 7 2 $89,250 $89,250 28.6 90 W05 4 1 $315,000 $315,000 25.0 97 W06 3 1 $134,000 $134,000 33.3 100 W06 2 2 $612,500 $612,500 100.0 98 W07 1 - - - - - W07 8 6 $580,250 $597,000 75.0 100 W08 4 - - - - - W08 1 - - - - - W09 4 1 $165,000 $165,000 25.0 98 W09 2 1 $355,000 $355,000 50.0 99 W10 1 - - - - - W10 3 1 $385,000 $385,000 33.3 98 W12 - - - - - - W12 2 - - - - - W13 - - - - - - W13 3 1 $240,000 $240,000 33.3 96 W14 - - - - - - W14 5 - - - - - W15 - - - - - - W15 - - - - - - W16 - - - - - - W16 1 - - - - - W17 - - - - - - W17 - - - - - - W18 - - - - - - W18 4 1 $295,000 $295,000 25.0 95 W19 - - - - - - W19 8 11 $383,864 $390,000 137.5 103 W20 - - - - - - W20 19 18 $357,233 $359,750 94.7 101 W21 - - - - - - W21 27 20 $459,110 $383,750 74.1 100 W22 - - - - - - W22 19 35 $328,820 $326,000 184.2 101 W23 - - - - - - W2 3 44 37 $290,651 $290,000 84.1 99 W24 - - - - - - W24 32 33 $296,783 $307,000 103.1 98 W25 2 - - - - - W25 9 3 $356,221 $343,663 33.3 102 W26 - - - - - - W26 - - - - - - W27 - - - - - - W27 1 13 $342,218 $318,0001,300.0 100 W28 1 - - - - - W28 3 8 $312,750 $309,500 266.7 101 W29 - - - - - - W29 - 5 $221,360 $227,000 - 98 TORONTO REAL ESTATE BOARD 9
- 10. Central District Current Month: February 2010 Area Active New Sales $ Volume Avg Price Med Price Avg DOM Avg%List C01 627 617 365 $153,628,059 $420,899 $370,000 15 101 C02 178 141 60 $46,387,242 $773,121 $609,000 24 103 C03 102 83 46 $39,487,361 $858,421 $681,500 23 100 C04 174 182 112 $92,724,673 $827,899 $760,500 15 102 C06 68 48 20 $12,578,090 $628,905 $554,500 24 100 C07 184 177 132 $59,596,747 $451,491 $386,000 21 100 C08 244 240 144 $53,985,233 $374,897 $340,000 18 102 C09 65 54 33 $47,273,649 $1,432,535 $970,000 14 101 C10 125 129 81 $54,476,600 $672,551 $549,000 15 102 C11 67 47 29 $14,838,870 $511,685 $569,000 20 101 C12 107 70 38 $50,185,550 $1,320,672 $1,200,000 28 99 C13 116 110 49 $19,054,250 $388,862 $362,000 19 100 C14 213 264 163 $86,453,207 $530,388 $387,500 17 101 C15 197 209 123 $59,722,548 $485,549 $390,000 24 100 TOTAL 2,467 2,371 1,395 $790,392,079 $566,589 $415,500 18 101 Central District Central District 80 Days on Market 80 Sales Active Listing Ratio 60 60 40 40 20 20 0 0 Feb Mar Apr May Jun Jul Aug Sep Oct Nov Dec Jan Feb Feb Mar Apr May Jun Jul Aug Sep Oct Nov Dec Jan Feb 2009 2010 2009 2010 Year-to-Date: February 2010 Area Listed Sales $ Volume Avg Price Med Price Avg DOM Avg%List C01 1,093 571 $239,539,121 $419,508 $370,000 18 101 C02 236 94 $71,562,345 $761,302 $597,000 26 102 C03 141 78 $61,996,261 $794,824 $565,000 26 100 C04 323 174 $138,792,907 $797,660 $749,500 19 102 C06 85 37 $21,677,290 $585,873 $520,000 22 99 C07 353 223 $97,466,115 $437,068 $366,000 21 100 C08 451 243 $90,943,528 $374,253 $339,000 17 102 C09 98 46 $62,483,829 $1,358,344 $927,500 15 101 C10 235 125 $83,769,600 $670,157 $552,500 16 103 C11 92 53 $27,098,270 $511,288 $551,000 20 100 C12 129 59 $80,170,400 $1,358,820 $1,210,000 33 99 C13 194 82 $31,775,164 $387,502 $334,000 21 100 C14 451 280 $139,759,795 $499,142 $375,000 19 101 C15 370 203 $95,175,898 $468,847 $368,000 25 100 TOTAL 4,251 2,268 $1,242,210,523 $547,712 $401,800 20 101 10 TORONTO REAL ESTATE BOARD
- 11. SINGLE FAMILY CENTRAL BREAKDOWN - FEBRuARY 2010 Central District Detached Houses Semi-Detached Houses Area Act Sales Av. Price Med. Price % S-A Av. % List Area Act Sales Av. Price Med. Price % S-A Av.% List C01 12 3 $619,000 $607,000 25.0 106 C01 24 20 $680,880 $660,250 83.3 104 C02 35 7 $1,094,357 $915,000 20.0 103 C02 27 24 $789,342 $636,374 88.9 105 C03 64 30 $923,012 $724,000 46.9 101 C03 11 6 $801,333 $821,500 54.6 97 C04 123 68 $1,104,832 $1,027,500 55.3 103 C04 4 11 $599,973 $641,700 275.0 105 C06 43 14 $778,964 $655,000 32.6 100 C06 3 - - - - - C07 58 39 $681,551 $600,000 67.2 101 C07 8 4 $506,650 $459,050 50.0 99 C08 7 - - - - - C08 9 4 $576,000 $592,500 44.4 100 C09 36 15 $1,994,800 $1,520,000 41.7 100 C09 4 2 $1,870,000 $1,870,000 50.0 103 C10 53 20 $1,177,875 $916,000 37.7 102 C10 10 10 $697,000 $668,500 100.0 108 C11 13 10 $813,650 $736,250 76.9 101 C11 2 5 $666,414 $682,000 250.0 106 C12 88 26 $1,591,154 $1,437,500 29.6 99 C12 1 1 $551,000 $551,000 100.0 125 C13 26 12 $623,033 $622,500 46.2 102 C13 8 9 $381,744 $385,000 112.5 101 C14 62 37 $1,034,859 $1,060,000 59.7 99 C14 - - - - - - C15 33 41 $778,253 $702,990 124.2 101 C15 16 12 $450,771 $458,875 75.0 100 Condo Apartment Link Area Act Sales Av. Price Med. Price % S-A Av. % List Area Act Sales Av. Price Med. Price % S-A Av.% List C01 546 304 $394,550 $356,000 55.7 101 C01 - - - - - - C02 90 19 $574,580 $525,000 21.1 100 C02 - - - - - - C03 20 8 $623,000 $547,500 40.0 99 C03 - - - - - - C04 36 29 $344,538 $285,000 80.6 99 C04 - - - - - - C06 21 5 $267,778 $261,490 23.8 100 C06 - - - - - - C07 96 74 $328,935 $314,500 77.1 100 C07 1 - - - - - C08 208 129 $362,275 $339,000 62.0 102 C08 - - - - - - C09 20 9 $985,433 $516,000 45.0 103 C09 - - - - - - C10 53 46 $464,915 $401,500 86.8 102 C10 - - - - - - C11 43 12 $232,150 $236,500 27.9 99 C11 - - - - - - C12 14 8 $794,944 $578,150 57.1 98 C12 - - - - - - C13 78 25 $260,776 $240,000 32.1 98 C13 - - - - - - C14 135 116 $369,564 $340,250 85.9 101 C14 - - - - - - C15 118 56 $300,498 $282,600 47.5 99 C15 1 1 $485,000 $485,000 100.0 108 Condo Townhouse Detached Condo Area Act Sales Av. Price Med. Price % S-A Av. % List Area Act Sales Av. Price Med. Price % S-A Av.% List C01 28 27 $408,330 $391,000 96.4 106 C01 - - - - - - C02 6 2 $941,500 $941,500 33.3 98 C02 - - - - - - C03 - 1 $1,360,000 $1,360,000 - 97 C03 - - - - - - C04 3 - - - - - C04 - - - - - - C06 - 1 $333,700 $333,700 - 97 C06 - - - - - - C07 16 9 $338,944 $346,000 56.3 101 C07 - - - - - - C08 8 6 $404,283 $407,200 75.0 103 C08 - - - - - - C09 - 5 $767,950 $760,000 - 103 C09 - - - - - - C10 8 2 $570,500 $570,500 25.0 101 C10 1 - - - - - C11 7 2 $292,250 $292,250 28.6 97 C11 - - - - - - C12 4 3 $635,000 $480,000 75.0 98 C12 - - - - - - C13 1 - - - - - C13 - - - - - - C14 12 7 $456,000 $387,500 58.3 101 C14 - - - - - - C15 29 13 $391,692 $330,000 44.8 101 C15 - - - - - - TORONTO REAL ESTATE BOARD 11
- 12. SINGLE FAMILY CENTRAL BREAKDOWN - FEBRuARY 2010 Central District Co-op Apartment Attached/Row/Townhouse Area Act Sales Av. Price Med. Price % S-A Av. % List Area Act Sales Av. Price Med. Price % S-A Av. % List C01 1 1 $335,000 $335,000 100.0 102 C01 16 10 $685,028 $565,125 62.5 104 C02 5 1 $265,000 $265,000 20.0 92 C02 15 7 $959,643 $845,000 46.7 104 C03 6 1 $645,000 $645,000 16.7 99 C03 1 - - - - - C04 7 3 $177,967 $174,900 42.9 96 C04 1 1 $470,888 $470,888 100.0 103 C06 - - - - - - C06 1 - - - - - C07 - - - - - - C07 5 6 $599,665 $587,500 120.0 101 C08 - 1 $250,000 $250,000 - 100 C08 12 4 $568,000 $579,500 33.3 105 C09 5 1 $273,000 $273,000 20.0 93 C09 - 1 $630,000 $630,000 - 97 C10 - 1 $232,000 $232,000 - 99 C10 - 2 $595,000 $595,000 - 100 C11 - - - - - - C11 2 - - - - - C12 - - - - - - C12 - - - - - - C13 1 - - - - - C13 2 3 $540,917 $546,750 150.0 102 C14 - 1 $317,000 $317,000 - 99 C14 4 2 $892,500 $892,500 50.0 97 C15 - - - - - - C15 - - - - - - North District Current Month: February 2010 Area Active New Sales $ Volume Avg Price Med Price Avg DOM Avg %List N01 96 85 42 $21,236,750 $505,637 $472,000 17 103 N02 179 171 94 $41,154,935 $437,818 $417,500 18 101 N03 245 301 182 $90,595,871 $497,780 $454,000 17 100 N04 139 158 91 $48,619,300 $534,278 $529,900 17 101 N05 143 135 70 $39,572,907 $565,327 $533,150 21 99 N06 152 126 75 $34,521,000 $460,280 $432,000 21 100 N07 148 176 113 $42,480,318 $375,932 $347,000 18 99 N08 421 409 243 $121,388,839 $499,543 $485,000 21 99 N10 108 102 55 $27,786,256 $505,205 $494,000 18 100 N11 297 314 206 $104,593,509 $507,735 $458,950 19 102 N12 86 80 49 $21,457,940 $437,917 $398,500 24 99 N13 80 26 9 $6,148,900 $683,211 $525,000 88 95 N14 107 47 29 $21,109,000 $727,897 $565,000 55 96 N15 64 39 28 $12,155,300 $434,118 $362,500 41 97 N16 112 53 27 $10,253,500 $379,759 $325,000 53 97 N17 228 119 60 $16,768,350 $279,473 $258,000 40 98 N18 118 74 38 $12,362,400 $325,326 $308,000 27 98 N19 146 68 35 $9,410,523 $268,872 $255,000 45 98 N20 23 8 13 $5,395,100 $415,008 $385,000 64 97 N21 41 13 7 $2,029,500 $289,929 $326,000 55 99 N22 84 34 11 $3,967,000 $360,636 $360,000 58 97 N23 177 71 34 $10,161,100 $298,856 $243,000 54 98 N24 109 48 9 $2,401,402 $266,822 $255,000 44 97 TOTAL 3,303 2,657 1,520 $705,569,700 $464,191 $426,500 25 100 12 TORONTO REAL ESTATE BOARD
- 13. North District North District North District 80 Days on Market 80 Sales Active Listing Ratio 60 60 40 40 20 20 0 0 Feb Mar Apr May Jun Jul Aug Sep Oct Nov Dec Jan Feb Feb Mar Apr May Jun Jul Aug Sep Oct Nov Dec Jan Feb 2009 2010 2009 2010 Year-to-Date: February 2010 Area Listed Sales $ Volume Avg Price Med Price Avg DOM Avg %List N01 145 80 $42,733,000 $534,163 $491,250 21 101 N02 301 151 $69,297,236 $458,922 $417,000 19 101 N03 505 294 $139,905,171 $475,868 $427,750 19 100 N04 276 156 $82,947,688 $531,716 $520,500 20 100 N05 229 130 $71,577,298 $550,595 $523,900 24 99 N06 216 113 $53,346,941 $472,097 $415,000 28 100 N07 305 184 $69,218,808 $376,189 $348,940 21 99 N08 703 388 $191,652,079 $493,949 $468,500 23 99 N10 174 89 $43,691,256 $490,913 $488,000 19 100 N11 545 342 $172,910,493 $505,586 $472,750 21 101 N12 135 80 $35,707,440 $446,343 $398,750 32 99 N13 56 17 $10,848,400 $638,141 $520,000 93 96 N14 89 44 $29,335,800 $666,723 $545,500 54 96 N15 85 46 $20,984,800 $456,191 $376,450 48 97 N16 105 47 $18,074,600 $384,566 $359,000 56 97 N17 216 104 $28,404,950 $273,125 $260,000 42 97 N18 137 59 $19,140,155 $324,409 $305,000 48 98 N19 126 63 $16,665,723 $264,535 $247,500 47 98 N20 17 16 $6,790,100 $424,381 $385,700 68 96 N21 23 8 $2,347,500 $293,438 $322,000 59 99 N22 74 23 $9,620,400 $418,278 $360,000 69 97 N23 143 53 $14,377,100 $271,266 $235,000 60 97 N24 78 14 $3,285,552 $234,682 $226,000 56 95 TOTAL 4,683 2,501 $1,152,862,490 $460,961 $425,000 28 99 TORONTO REAL ESTATE BOARD 13
- 14. SINGLE FAMILY NORTH BREAKDOWN - FEBRuARY 2010 North District Detached Houses Semi-Detached Houses Area Act Sales Av. Price Med. Price % S-A Av. % List Area Act Sales Av. Price Med. Price % S-A Av. % List N01 55 19 $719,684 $733,500 34.6 103 N01 1 1 $368,000 $368,000 100.0 99 N02 96 39 $568,842 $569,000 40.6 103 N02 - 1 $455,000 $455,000 - 100 N03 127 70 $742,274 $682,500 55.1 100 N03 7 6 $485,133 $472,450 85.7 100 N04 96 61 $606,646 $585,000 63.5 100 N04 10 14 $380,836 $346,000 140.0 101 N05 122 47 $640,367 $611,500 38.5 98 N05 2 3 $410,000 $410,000 150.0 102 N06 104 46 $514,820 $485,250 44.2 99 N06 10 13 $349,177 $370,000 130.0 102 N07 101 70 $423,510 $402,450 69.3 99 N07 15 21 $296,190 $301,000 140.0 100 N08 280 144 $572,266 $538,750 51.4 98 N08 32 34 $418,944 $419,000 106.3 100 N10 67 34 $574,855 $584,650 50.8 100 N10 3 2 $400,950 $400,950 66.7 99 N11 175 104 $627,532 $577,950 59.4 101 N11 10 26 $424,018 $417,640 260.0 103 N12 74 37 $465,896 $425,000 50.0 98 N12 4 6 $357,333 $363,500 150.0 102 N13 80 9 $683,211 $525,000 11.3 95 N13 - - - - - - N14 102 28 $745,893 $569,250 27.5 96 N14 1 - - - - - N15 61 24 $459,388 $386,450 39.3 97 N15 - - - - - - N16 92 19 $441,263 $375,000 20.7 97 N16 - 1 $250,000 $250,000 - 96 N17 217 53 $287,978 $268,500 24.4 97 N17 5 4 $236,125 $230,500 80.0 98 N18 100 27 $356,626 $328,000 27.0 98 N18 4 - - - - - N19 85 21 $279,752 $267,500 24.7 98 N19 6 1 $202,000 $202,000 16.7 96 N20 23 13 $415,008 $385,000 56.5 97 N20 - - - - - - N21 41 7 $289,929 $326,000 17.1 99 N21 - - - - - - N22 71 10 $378,300 $364,000 14.1 97 N22 1 - - - - - N23 170 32 $302,944 $249,000 18.8 98 N23 1 - - - - - N24 99 9 $266,822 $255,000 9.1 97 N24 - - - - - - Condo Apartment Link Area Act Sales Av. Price Med. Price % S-A Av. % List Area Act Sales Av. Price Med. Price % S-A Av. % List N01 24 9 $270,917 $264,900 37.5 103 N01 2 6 $457,500 $472,000 300.0 103 N02 65 35 $309,359 $283,000 53.9 99 N02 4 6 $358,667 $348,250 150.0 98 N03 68 60 $280,192 $268,500 88.2 99 N03 5 6 $449,583 $451,750 120.0 99 N04 13 6 $345,417 $233,250 46.2 100 N04 - - - - - - N05 1 - - - - - N05 - 5 $413,080 $425,000 - 102 N06 12 - - - - - N06 1 4 $375,750 $365,000 400.0 99 N07 8 3 $197,300 $182,500 37.5 96 N07 - - - - - - N08 60 15 $369,593 $334,000 25.0 97 N08 4 2 $455,000 $455,000 50.0 98 N10 25 4 $290,000 $298,500 16.0 97 N10 13 14 $420,736 $418,900 107.7 102 N11 64 29 $330,231 $319,000 45.3 99 N11 10 11 $431,309 $425,000 110.0 105 N12 - - - - - - N12 - 1 $350,690 $350,690 - 103 N13 - - - - - - N13 - - - - - - N14 2 1 $224,000 $224,000 50.0 98 N14 - - - - - - N15 - - - - - - N15 - - - - - - N16 11 1 $194,000 $194,000 9.1 97 N16 1 2 $279,250 $279,250 200.0 96 N17 - 2 $158,000 $158,000 - 98 N17 1 - - - - - N18 4 1 $163,500 $163,500 25.0 95 N18 6 7 $276,143 $265,500 116.7 99 N19 10 2 $203,250 $203,250 20.0 96 N19 4 1 $238,000 $238,000 25.0 97 N20 - - - - - - N20 - - - - - - N21 - - - - - - N21 - - - - - - N22 - - - - - - N22 7 - - - - - N23 - - - - - - N23 3 1 $225,900 $225,900 33.3 100 N24 - - - - - - N24 - - - - - - 14 TORONTO REAL ESTATE BOARD
- 15. SINGLE FAMILY NORTH BREAKDOWN - FEBRuARY 2010 North District Condo Townhouse Detached Condo Area Act Sales Av. Price Med. Price % S-A Av. % List Area Act Sales Av. Price Med. Price % S-A Av. % List N01 14 7 $287,357 $288,000 50.0 100 N01 - - - - - - N02 11 7 $389,071 $415,000 63.6 101 N02 1 - - - - - N03 14 12 $303,850 $277,000 85.7 101 N03 - - - - - - N04 7 1 $391,000 $391,000 14.3 100 N04 - - - - - - N05 - 1 $340,500 $340,500 - 103 N05 - - - - - - N06 14 3 $503,333 $520,000 21.4 98 N06 - - - - - - N07 13 5 $289,800 $260,000 38.5 98 N07 - - - - - - N08 9 3 $344,700 $364,100 33.3 100 N08 - - - - - - N10 - - - - - - N10 - - - - - - N11 16 11 $396,909 $340,000 68.8 102 N11 - - - - - - N12 1 - - - - - N12 1 - - - - - N13 - - - - - - N13 - - - - - - N14 2 - - - - - N14 - - - - - - N15 - - - - - - N15 - - - - - - N16 5 1 $138,000 $138,000 20.0 94 N16 - - - - - - N17 1 - - - - - N17 1 - - - - - N18 2 3 $212,333 $212,000 150.0 97 N18 - - - - - - N19 7 - - - - - N19 27 4 $340,643 $345,037 14.8 100 N20 - - - - - - N20 - - - - - - N21 - - - - - - N21 - - - - - - N22 - - - - - - N22 - - - - - - N23 - - - - - - N23 - - - - - - N24 8 - - - - - N24 - - - - - - Co-op Apartment Attached/Row/Townhouse Area Act Sales Av. Price Med. Price % S-A Av. % List Area Act Sales Av. Price Med. Price % S-A Av. % List N01 - - - - - - N01 - - - - - - N02 - - - - - - N02 2 6 $468,667 $475,000 300.0 101 N03 - - - - - - N03 24 28 $448,954 $454,000 116.7 102 N04 - - - - - - N04 13 9 $424,300 $428,000 69.2 103 N05 - - - - - - N05 18 14 $417,125 $428,125 77.8 102 N06 - - - - - - N06 11 9 $365,222 $350,000 81.8 100 N07 - - - - - - N07 11 14 $326,692 $324,950 127.3 101 N08 - - - - - - N08 36 45 $383,344 $380,500 125.0 100 N10 - - - - - - N10 - 1 $389,000 $389,000 - 98 N11 - - - - - - N11 22 25 $384,747 $380,800 113.6 104 N12 - - - - - - N12 6 5 $345,020 $350,000 83.3 105 N13 - - - - - - N13 - - - - - - N14 - - - - - - N14 - - - - - - N15 - - - - - - N15 3 4 $282,500 $285,000 133.3 99 N16 - - - - - - N16 3 3 $243,000 $226,000 100.0 98 N17 - - - - - - N17 3 1 $245,000 $245,000 33.3 100 N18 - - - - - - N18 2 - - - - - N19 - - - - - - N19 7 6 $221,108 $226,500 85.7 99 N20 - - - - - - N20 - - - - - - N21 - - - - - - N21 - - - - - - N22 - - - - - - N22 5 1 $184,000 $184,000 20.0 97 N23 - - - - - - N23 3 1 $241,000 $241,000 33.3 98 N24 - - - - - - N24 2 - - - - - TORONTO REAL ESTATE BOARD 15
- 16. District Totals New Active Listed Sales $ Volume Avg Price Med Price Avg DOM Avg Month Grand Total 12,726 14,514 N/A 7,291 3,146,131,126 431,509 366,300 22 100 Year N/A N/A 22,628 12,176 5,145,622,363 422,604 360,000 25 99 Annual Summary - Single Family Year *Number of Sales *Average Price Year *Number of Sales *Average Price 1976 19,025 $61,389 2009 1977 20,512 $64,559 January 2,670 $343,632 1978 21,184 $67,333 February 4,120 $361,305 1979 23,466 $70,830 March 6,171 $362,050 1980 26,017 $75,694 April 8,107 $385,641 1981 29,625 $90,203 May 9,589 $395,609 1982 25,336 $95,496 June 10,955 $403,972 1983 30,046 $101,626 July 9,967 $395,414 1984 31,905 $102,318 August 8,035 $387,921 1985 45,509 $109,094 September 8,196 $406,877 1986 52,919 $138,925 October 8,476 $423,559 1987 43,475 $189,105 November 7,446 $418,460 1988 49,381 $229,635 December 5,541 $411,931 1989 38,960 $273,698 1990 26,779 $255,020 Total** 87,308 $395,460 1991 38,144 $234,313 1992 41,703 $214,971 2010 1993 38,990 $206,490 January 4,986 $409,058 1994 44,237 $208,921 February 7,291 $431,509 1995 39,273 $203,028 1996 55,779 $198,150 Year-to-Date** 12,176 $422,604 1997 58,014 $211,307 1998 55,344 $216,815 1999 58,957 $228,372 2000 58,343 $243,255 2001 67,612 $251,508 2002 74,759 $275,231 2003 78,898 $293,067 2004 83,501 $315,231 2005 84,145 $335,907 2006 83,084 $351,941 2007 93,193 $376,236 2008 74,552 $379,347 * Due to District revisions, caution should be exercised when undertaking historical comparisons. Please refer to appropriate maps. **This figure may not equal the sum of all monthly totals, as the year-to-date total reflects sales reported in error and deals that have fallen through since January 1st. Single Family Dwelling Sales Comparison Sales Active Listing Average Price 15000 500000 35000 13500 30000 12000 425000 10500 25000 9000 20000 7500 350000 6000 15000 4500 10000 275000 3000 5000 1500 0 0 200000 Feb Mar Apr May Jun Jul Aug Sep Oct Nov Dec Jan Feb Feb Mar Apr May Jun Jul Aug Sep Oct Nov Dec Jan Feb 2000 2001 2002 2003 2004 2005 2006 2007 2008 2009 2010 2009 2010 2009 2010 16 TORONTO REAL ESTATE BOARD