Market watch march 2011
•
0 likes•290 views

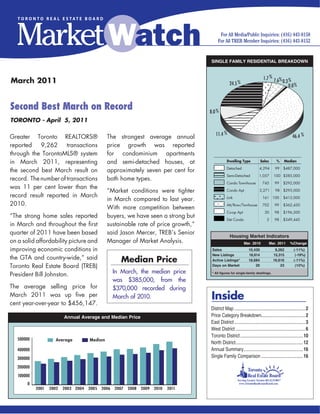
The document provides sales statistics for the single family residential real estate market in Toronto for March 2011, showing that total sales were down 11% from the previous year but the median price rose 5% to $385,000. The strongest price growth was for condominium apartments and semi-detached houses, while market conditions were reported to be tighter with more competition between buyers.

Recommended
More Related Content
What's hot
What's hot (12)
Viewers also liked
Similar to Market watch march 2011
Similar to Market watch march 2011 (20)
Market watch march 2011
- 1. SINGLE FAMILY RESIDENTIAL BREAKDOWN 1.7 % 7.6% % March 2011 24.5 % 0.3 0.0 % Second Best March on Record 8.0 % TORONTO - April 5, 2011 11.4 % 46.4 % Greater Toronto REALTORS® The strongest average annual reported 9,262 transactions price growth was reported through the TorontoMLS® system for condominium apartments in March 2011, representing and semi-detached 2.3 7.0 0.3 at houses, % % Dwelling Type Sales % Median 21.5 % % approximately seven per cent 0.1 for Single Detached 4,294 Detached 99 $487,000 % the second best March result on Semi Detached Semi-Detached 1,057 100 $385,000 record. The number of transactions both home types. Condo T.H. Condo Townhouse 745 99 $292,000 was 11 per cent lower than the “Market conditions were tighter 8.5 % Condo Apt. Condo Apt 2,271 98 $295,000 record result reported in March Link in March compared to last year. Link 161 100 $415,000 2010. Attached/Row Att/Row/Twnhouse 702 99 $362,450 With more competition between 12.0 % Co-op Apt. Co-op Apt 30 98 $196,500 “The strong home sales reported 48.3 buyers, we have seen a strong but % Detached Condo Det Condo 2 98 $349,445 in March and throughout the first sustainable rate of price growth,” quarter of 2011 have been based said Jason Mercer, TREB’s Senior Housing Market Indicators on a solid affordability picture and Manager of Market Analysis. AuguNovMar. 2010 Mar. 2011 %Change improving economic conditions in Sales 10,430 9,262 (-11%) New Listings 18,914 15,315 (-19%) the GTA and country-wide,” said Median Price Active Listings* 18,684 16,616 (-11%) Toronto Real Estate Board (TREB) Days on Market 20 23 (15%) President Bill Johnston. In March, the median price * All figures for single-family dwellings. was $385,000, from the The average selling price for $370,000 recorded during March 2011 was up five per March of 2010. Inside cent year-over-year to $456,147. District Map ............................................................. 2 Annual Average and Median Price Price Category Breakdown......................................2 East District ............................................................. 3 West District ............................................................ 6 Toronto District ......................................................10 500000 Average Median North District..........................................................12 400000 Annual Summary ...................................................16 300000 Single Family Comparison ....................................16 200000 100000 0 2001 2002 2003 2004 2005 2006 2007 2008 2009 2010 2011
- 2. District Map Price Category Breakdown - March 2011 Price Range Total S.F.D %S.F.D Condo Apt. %Condo Apt. Condo T.H. %Condo T.H. - - $90,000 32 0.3 22 1.0 2 0.3 $90,001 - $100,000 7 0.1 4 0.2 - - $100,001 - $110,000 15 0.2 13 0.6 - - $110,001 - $120,000 31 0.3 19 0.8 7 0.9 $120,001 - $130,000 34 0.4 23 1.0 5 0.7 $130,001 - $140,000 38 0.4 24 1.1 6 0.8 $140,001 - $150,000 57 0.6 43 1.9 9 1.2 $150,001 - $160,000 52 0.6 33 1.5 9 1.2 $160,001 - $170,000 67 0.7 41 1.8 14 1.9 $170,001 - $180,000 91 1.0 55 2.4 10 1.3 $180,001 - $190,000 109 1.2 62 2.7 22 3.0 $190,001 - $200,000 98 1.1 54 2.4 13 1.7 $200,001 - $225,000 322 3.5 149 6.6 71 9.5 $225,001 - $250,000 406 4.4 192 8.5 76 10.2 $250,001 - $300,000 1,102 11.9 442 19.5 157 21.1 $300,001 - $400,000 2,526 27.3 660 29.1 232 31.1 $400,001 - $500,000 1,698 18.3 245 10.8 59 7.9 $500,001 - $750,000 1,776 19.2 142 6.3 43 5.8 $750,001 - $1,000,000 410 4.4 27 1.2 6 0.8 $1,000,001 - $1,500,000 264 2.9 12 0.5 4 0.5 $1,500,001 - - 127 1.4 9 0.4 - - Total: 9,262 100 2,271 100 745 100 2 TORONTO REAL ESTATE BOARD
- 3. East District Current Month: March 2011 Area Active New Sales $ Volume Avg Price Med Price Avg DOM Avg %List E01 109 151 95 $48,829,927 $513,999 $502,200 11 105 E02 101 154 94 $59,607,182 $634,119 $549,500 13 100 E03 187 206 135 $63,968,933 $473,844 $451,880 18 102 E04 161 171 90 $29,601,201 $328,902 $354,000 19 99 E05 118 142 109 $37,716,664 $346,024 $315,000 18 100 E06 97 103 61 $27,224,401 $446,302 $392,000 26 100 E07 129 160 92 $35,013,454 $380,581 $376,500 17 101 E08 174 146 92 $29,339,652 $318,909 $332,500 30 98 E09 218 208 117 $33,305,752 $284,665 $269,000 24 98 E10 78 88 54 $20,620,700 $381,865 $393,500 15 99 E11 225 192 93 $27,865,586 $299,630 $292,000 23 98 E12 30 33 26 $9,173,555 $352,829 $320,000 23 99 E13 151 168 110 $35,583,956 $323,491 $311,500 24 99 E14 281 300 191 $64,531,872 $337,863 $323,000 23 98 E15 292 308 182 $57,914,400 $318,211 $301,250 21 98 E16 562 442 263 $62,950,513 $239,356 $226,500 32 98 E17 251 216 120 $32,352,228 $269,602 $257,500 29 98 E18 20 11 6 $4,602,000 $767,000 $751,500 92 92 E19 79 73 33 $13,542,300 $410,373 $370,000 20 98 E20 113 55 20 $5,961,200 $298,060 $274,450 35 97 E21 133 60 30 $9,324,500 $310,817 $279,500 57 97 TOTAL 3,509 3,387 2,013 $709,029,976 $352,226 $322,000 23 99 Year-to-Date: March 2011 Area Listed Sales $ Volume Avg Price Med Price Avg DOM Avg %List E01 342 197 $101,989,838 $517,715 $501,000 15 103 E02 323 177 $109,496,708 $618,625 $537,000 17 100 E03 481 278 $122,547,879 $440,820 $418,250 23 101 E04 363 196 $61,074,171 $311,603 $339,500 22 99 E05 335 200 $70,460,464 $352,302 $317,250 19 100 E06 242 142 $62,743,080 $441,853 $370,000 25 99 E07 337 190 $70,589,649 $371,524 $368,900 19 100 E08 327 203 $67,117,652 $330,629 $330,000 34 98 E09 450 274 $77,290,636 $282,083 $268,750 31 98 E10 189 117 $47,300,977 $404,282 $403,000 23 99 E11 426 216 $63,129,546 $292,266 $283,500 33 98 E12 87 51 $17,537,955 $343,881 $310,000 25 99 E13 374 224 $75,712,867 $338,004 $319,500 30 98 E14 699 420 $142,866,138 $340,157 $325,250 27 98 E15 685 383 $121,216,450 $316,492 $300,000 24 98 E16 1,110 576 $137,830,713 $239,289 $223,950 35 98 E17 529 264 $68,991,888 $261,333 $248,500 30 98 E18 22 11 $8,768,300 $797,118 $778,000 72 94 E19 164 78 $29,283,050 $375,424 $360,000 28 98 E20 140 43 $13,184,100 $306,607 $276,000 49 97 E21 165 64 $21,696,559 $339,009 $296,250 55 96 TOTAL 7,790 4,304 $1,490,828,620 $346,382 $317,000 27 99 TORONTO REAL ESTATE BOARD 3
- 4. SINGLE FAMILY EAST BREAKDOWN - MARCH 2011 East District East District East District 80 Days on Market 80 Sales Active Listing Ratio 60 60 40 40 20 20 0 0 Mar Apr May Jun Jul Aug Sep Oct Nov Dec Jan Feb Mar Mar Apr May Jun Jul Aug Sep Oct Nov Dec Jan Feb Mar 2010 2011 2010 2011 Detached Houses Semi-Detached Houses Area Act Sales Av. Price Med. Price % S-A Av. % List Area Act Sales Av. Price Med. Price % S-A Av. % List E01 24 19 $616,594 $625,000 79.2 105 E01 52 42 $523,046 $500,500 80.8 106 E02 36 34 $845,703 $795,000 94.4 100 E02 32 35 $524,062 $492,500 109.4 102 E03 81 82 $560,679 $501,000 101.2 102 E03 34 25 $474,580 $439,000 73.5 106 E04 58 45 $402,339 $397,000 77.6 101 E04 4 7 $330,143 $312,000 175.0 99 E05 31 26 $525,883 $515,900 83.9 102 E05 2 9 $381,633 $376,000 450.0 102 E06 66 38 $510,582 $431,000 57.6 99 E06 13 12 $341,625 $324,500 92.3 101 E07 35 39 $504,289 $465,388 111.4 102 E07 10 11 $383,273 $378,000 110.0 103 E08 81 49 $415,478 $358,750 60.5 100 E08 3 1 $310,000 $310,000 33.3 97 E09 46 40 $389,434 $381,500 87.0 99 E09 - 4 $309,815 $311,080 - 103 E10 42 39 $446,215 $418,000 92.9 99 E10 2 2 $395,050 $395,050 100.0 106 E11 42 29 $450,660 $464,000 69.1 100 E11 17 7 $330,555 $294,000 41.2 101 E12 19 19 $389,187 $364,500 100.0 98 E12 - 2 $265,000 $265,000 - 101 E13 105 51 $409,991 $388,000 48.6 98 E13 10 8 $314,113 $319,000 80.0 101 E14 198 129 $373,282 $354,700 65.2 99 E14 13 15 $286,933 $288,000 115.4 98 E15 201 109 $361,181 $345,000 54.2 99 E15 11 10 $260,100 $264,500 90.9 99 E16 410 186 $265,767 $255,800 45.4 97 E16 50 31 $184,226 $183,000 62.0 98 E17 184 85 $293,450 $268,000 46.2 98 E17 8 3 $199,500 $205,500 37.5 96 E18 20 6 $767,000 $751,500 30.0 92 E18 - - - - - - E19 70 28 $430,407 $382,500 40.0 98 E19 - - - - - - E20 106 18 $311,456 $275,450 17.0 98 E20 - - - - - - E21 132 29 $313,517 $280,000 22.0 97 E21 - 1 $232,500 $232,500 - 97 4 TORONTO REAL ESTATE BOARD
- 5. SINGLE FAMILY EAST BREAKDOWN - MARCH 2011 East District Condo Apartment Link Area Act Sales Av. Price Med. Price % S-A Av. % List Area Act Sales Av. Price Med. Price % S-A Av. % List E01 17 14 $397,686 $399,000 82.4 101 E01 - - - - - - E02 11 11 $457,318 $395,000 100.0 98 E02 - - - - - - E03 61 27 $212,732 $186,750 44.3 97 E03 - - - - - - E04 64 21 $202,322 $215,000 32.8 97 E04 - - - - - - E05 55 42 $237,798 $243,000 76.4 97 E05 5 5 $460,220 $456,800 100.0 106 E06 8 6 $303,050 $256,250 75.0 99 E06 - - - - - - E07 69 20 $202,034 $209,500 29.0 97 E07 6 4 $407,150 $421,400 66.7 103 E08 71 32 $167,977 $151,250 45.1 96 E08 - - - - - - E09 138 60 $233,529 $232,500 43.5 98 E09 - - - - - - E10 12 4 $184,250 $191,500 33.3 97 E10 - - - - - - E11 104 32 $160,411 $164,000 30.8 97 E11 2 3 $357,000 $364,000 150.0 101 E12 2 - - - - - E12 - 1 $336,000 $336,000 - 99 E13 10 15 $218,033 $190,000 150.0 97 E13 - 2 $287,500 $287,500 - 108 E14 9 7 $200,971 $177,800 77.8 97 E14 4 3 $281,667 $285,000 75.0 98 E15 22 11 $229,845 $225,000 50.0 97 E15 13 6 $289,667 $280,000 46.2 99 E16 37 9 $129,911 $126,800 24.3 96 E16 6 4 $222,125 $220,750 66.7 97 E17 15 3 $156,500 $148,000 20.0 98 E17 21 11 $247,150 $248,000 52.4 99 E18 - - - - - - E18 - - - - - - E19 - - - - - - E19 3 3 $316,000 $318,000 100.0 99 E20 4 1 $170,000 $170,000 25.0 90 E20 - 1 $185,000 $185,000 - 103 E21 1 - - - - - E21 - - - - - - Condo Townhouse Detached Condo Area Act Sales Av. Price Med. Price % S-A Av. % List Area Act Sales Av. Price Med. Price % S-A Av. % List E01 8 6 $378,583 $348,250 75.0 99 E01 - - - - - - E02 7 5 $645,000 $552,000 71.4 98 E02 - - - - - - E03 4 - - - - - E03 - - - - - - E04 27 11 $271,091 $264,000 40.7 99 E04 - - - - - - E05 25 18 $271,979 $274,500 72.0 99 E05 - - - - - - E06 3 2 $350,500 $350,500 66.7 103 E06 - - - - - - E07 8 12 $294,416 $286,000 150.0 101 E07 - - - - - - E08 16 7 $296,857 $305,000 43.8 96 E08 - - - - - - E09 33 13 $190,569 $212,000 39.4 97 E09 - - - - - - E10 13 3 $160,333 $133,000 23.1 96 E10 - - - - - - E11 41 11 $235,636 $212,000 26.8 96 E11 3 - - - - - E12 6 3 $234,333 $230,000 50.0 99 E12 - - - - - - E13 14 21 $218,000 $213,000 150.0 98 E13 - - - - - - E14 12 16 $236,119 $237,500 133.3 98 E14 1 1 $239,900 $239,900 100.0 96 E15 21 11 $218,500 $217,000 52.4 99 E15 - - - - - - E16 47 21 $162,752 $155,000 44.7 97 E16 - - - - - - E17 9 5 $162,380 $139,000 55.6 99 E17 - - - - - - E18 - - - - - - E18 - - - - - - E19 1 - - - - - E19 - - - - - - E20 3 - - - - - E20 - - - - - - E21 - - - - - - E21 - - - - - - TORONTO REAL ESTATE BOARD 5
- 6. SINGLE FAMILY EAST BREAKDOWN - MARCH 2011 East District Co-op Apartment Attached/Row/Townhouse Area Act Sales Av. Price Med. Price % S-A Av. % List Area Act Sales Av. Price Med. Price % S-A Av. % List E01 - - - - - - E01 8 14 $521,971 $520,550 175.0 106 E02 4 1 $318,000 $318,000 25.0 96 E02 11 8 $492,200 $500,800 72.7 99 E03 1 - - - - - E03 6 1 $385,000 $385,000 16.7 110 E04 3 1 $120,000 $120,000 33.3 96 E04 5 5 $366,838 $389,000 100.0 100 E05 - - - - - - E05 - 9 $380,533 $385,000 - 103 E06 - - - - - - E06 7 3 $401,167 $410,500 42.9 102 E07 - 1 $224,000 $224,000 - 98 E07 1 5 $340,780 $347,000 500.0 100 E08 - - - - - - E08 3 3 $406,000 $420,000 100.0 98 E09 - - - - - - E09 1 - - - - - E10 6 4 $132,300 $144,750 66.7 98 E10 3 2 $340,500 $340,500 66.7 100 E11 - - - - - - E11 16 11 $335,127 $319,900 68.8 98 E12 - - - - - - E12 3 1 $210,000 $210,000 33.3 102 E13 - - - - - - E13 12 13 $287,538 $290,000 108.3 99 E14 - - - - - - E14 44 20 $290,245 $287,500 45.5 98 E15 - - - - - - E15 24 35 $264,997 $273,000 145.8 98 E16 - - - - - - E16 12 12 $194,284 $207,450 100.0 103 E17 - - - - - - E17 14 13 $216,185 $214,000 92.9 98 E18 - - - - - - E18 - - - - - - E19 - - - - - - E19 5 2 $271,450 $271,450 40.0 100 E20 - - - - - - E20 - - - - - - E21 - - - - - - E21 - - - - - - West District Current Month: March 2011 Area Active New Sales $ Volume Avg Price Med Price Avg DOM Avg %List W01 119 105 85 $44,299,794 $521,174 $410,000 19 100 W02 82 110 77 $39,500,585 $512,995 $466,000 14 102 W03 139 138 72 $23,460,925 $325,846 $327,000 21 100 W04 175 125 69 $23,454,708 $339,923 $342,500 25 98 W05 301 214 105 $35,711,038 $340,105 $340,000 32 97 W06 303 233 112 $45,900,892 $409,829 $378,750 24 99 W07 89 84 64 $35,684,800 $557,575 $532,450 17 100 W08 200 192 125 $72,838,625 $582,709 $515,000 21 100 W09 171 101 50 $20,394,551 $407,891 $454,500 32 98 W10 237 161 100 $26,924,600 $269,246 $266,200 34 97 W12 184 149 91 $48,989,900 $538,351 $472,500 17 98 W13 197 156 100 $57,548,100 $575,481 $459,950 22 98 W14 95 78 49 $16,680,400 $340,416 $319,000 23 98 W15 400 360 207 $56,995,893 $275,342 $256,000 23 98 W16 134 151 94 $41,529,510 $441,803 $403,750 36 98 W17 1 1 - - - - - - W18 97 80 46 $13,516,375 $293,834 $303,500 30 97 W19 281 361 249 $105,148,455 $422,283 $412,500 18 99 W20 377 487 306 $134,361,434 $439,090 $423,900 15 99 W21 497 355 206 $127,613,581 $619,483 $534,750 26 98 W22 180 232 170 $68,548,851 $403,229 $372,000 16 99 W23 679 755 466 $165,192,345 $354,490 $341,500 20 98 W24 566 592 334 $126,552,838 $378,901 $360,000 19 98 W25 116 99 70 $32,269,788 $460,997 $364,750 30 98 W26 24 6 7 $4,132,000 $590,286 $450,000 66 96 W27 188 144 91 $38,599,200 $424,167 $393,000 30 98 W28 202 112 83 $40,904,102 $492,821 $439,900 32 98 W29 124 90 48 $14,687,438 $305,988 $291,000 34 98 TOTAL 6,158 5,671 3,476 $1,461,440,728 $420,437 $375,000 22 98 6 TORONTO REAL ESTATE BOARD
- 7. SINGLE FAMILY WEST BREAKDOWN - MARCH 2011 West District West District West District 80 Days on Market 80 Sales Active Listing Ratio 60 60 40 40 20 20 0 0 Mar Apr May Jun Jul Aug Sep Oct Nov Dec Jan Feb Mar Mar Apr May Jun Jul Aug Sep Oct Nov Dec Jan Feb Mar 2010 2011 2010 2011 Year-to-Date: March 2011 Area Listed Sales $ Volume Avg Price Med Price Avg DOM Avg %List W01 277 137 $72,633,969 $530,175 $410,000 23 100 W02 258 179 $91,542,872 $511,413 $450,000 20 101 W03 308 169 $56,437,225 $333,948 $339,000 34 99 W04 297 165 $52,652,665 $319,107 $310,000 36 97 W05 500 244 $82,214,774 $336,946 $335,000 36 97 W06 550 238 $102,076,412 $428,892 $393,500 28 99 W07 220 136 $70,717,550 $519,982 $486,250 24 99 W08 459 257 $151,472,440 $589,387 $515,000 27 99 W09 244 100 $38,602,451 $386,025 $432,500 41 97 W10 399 214 $55,359,400 $258,689 $225,750 37 97 W12 359 175 $92,354,150 $527,738 $448,000 27 98 W13 393 206 $109,287,788 $530,523 $440,500 29 97 W14 202 113 $38,178,650 $337,864 $319,000 26 98 W15 902 465 $124,748,679 $268,277 $250,000 28 98 W16 311 180 $76,809,298 $426,718 $391,500 33 98 W17 1 - - - - - - W18 184 89 $26,018,325 $292,341 $305,000 33 97 W19 757 459 $191,658,555 $417,557 $406,000 21 98 W20 1,017 577 $244,886,671 $424,414 $405,000 19 99 W21 894 440 $299,809,637 $681,386 $550,000 31 98 W22 563 365 $144,576,299 $396,099 $370,000 19 99 W23 1,707 1,031 $362,080,189 $351,193 $340,000 24 98 W24 1,326 689 $258,008,729 $374,468 $360,000 22 98 W25 232 144 $68,381,088 $474,869 $365,750 37 98 W26 26 10 $7,096,900 $709,690 $572,450 54 95 W27 370 224 $89,658,850 $400,263 $377,500 30 98 W28 320 170 $83,295,061 $489,971 $440,250 30 98 W29 230 139 $43,762,638 $314,839 $287,500 40 98 TOTAL 13,306 7,315 $3,034,321,265 $414,808 $366,000 27 98 TORONTO REAL ESTATE BOARD 7
- 8. SINGLE FAMILY WEST BREAKDOWN - MARCH 2011 West District Detached Houses Semi-Detached Houses Area Act Sales Av. Price Med. Price % S-A Av. % List Area Act Sales Av. Price Med. Price % S-A Av. % List W01 20 19 $879,455 $849,000 95.0 102 W01 10 12 $587,871 $608,000 120.0 106 W02 28 22 $709,437 $723,550 78.6 105 W02 21 34 $468,819 $463,000 161.9 101 W03 80 37 $351,457 $348,000 46.3 100 W03 33 24 $353,458 $353,500 72.7 101 W04 80 39 $427,430 $412,000 48.8 99 W04 11 4 $404,605 $427,250 36.4 97 W05 66 30 $496,380 $485,250 45.5 98 W05 54 34 $380,141 $345,950 63.0 98 W06 57 36 $516,558 $461,500 63.2 101 W06 7 6 $469,650 $451,750 85.7 101 W07 38 33 $706,639 $620,000 86.8 101 W07 - 1 $462,800 $462,800 - 105 W08 95 68 $783,709 $629,500 71.6 101 W08 1 2 $429,500 $429,500 200.0 97 W09 47 29 $543,993 $518,500 61.7 101 W09 4 1 $340,999 $340,999 25.0 104 W10 75 43 $376,902 $374,000 57.3 97 W10 8 6 $326,000 $334,500 75.0 96 W12 114 49 $709,288 $575,000 43.0 98 W12 7 3 $390,333 $390,000 42.9 98 W13 149 58 $770,233 $698,750 38.9 98 W13 4 12 $336,692 $328,750 300.0 100 W14 28 12 $584,083 $532,500 42.9 100 W14 3 5 $399,600 $395,000 166.7 99 W15 23 7 $613,857 $535,000 30.4 97 W15 8 10 $416,200 $415,000 125.0 100 W16 69 43 $596,047 $491,000 62.3 98 W16 18 15 $380,253 $385,000 83.3 99 W17 - - - - - - W17 - - - - - - W18 33 14 $322,557 $336,900 42.4 96 W18 26 22 $307,258 $315,500 84.6 98 W19 111 81 $598,190 $575,000 73.0 99 W19 25 58 $418,705 $420,000 232.0 99 W20 169 133 $565,354 $549,000 78.7 98 W20 61 55 $412,963 $415,000 90.2 100 W21 331 138 $733,253 $633,500 41.7 98 W21 9 11 $385,818 $370,000 122.2 98 W22 122 72 $488,814 $479,950 59.0 99 W22 20 27 $370,589 $368,000 135.0 99 W23 438 257 $402,361 $394,000 58.7 98 W23 107 113 $320,878 $320,000 105.6 99 W24 365 165 $476,266 $470,000 45.2 98 W24 65 74 $341,199 $336,500 113.9 98 W25 63 37 $610,178 $495,000 58.7 97 W25 6 4 $365,850 $364,500 66.7 99 W26 23 7 $590,286 $450,000 30.4 96 W26 - - - - - - W27 158 71 $462,148 $455,000 44.9 98 W27 3 5 $354,780 $370,000 166.7 99 W28 179 67 $530,259 $459,500 37.4 98 W28 10 7 $342,286 $340,000 70.0 98 W29 88 37 $326,869 $303,000 42.1 98 W29 9 8 $231,800 $235,500 88.9 98 Condo Apartment Link Area Act Sales Av. Price Med. Price % S-A Av. % List Area Act Sales Av. Price Med. Price % S-A Av. % List W01 69 44 $374,020 $326,500 63.8 98 W01 - - - - - - W02 12 7 $394,716 $399,000 58.3 100 W02 - - - - - - W03 21 10 $174,400 $161,500 47.6 97 W03 - - - - - - W04 65 18 $161,528 $162,500 27.7 96 W04 - - - - - - W05 107 21 $134,088 $115,000 19.6 95 W05 - - - - - - W06 217 54 $342,261 $287,500 24.9 97 W06 - - - - - - W07 46 20 $314,295 $307,000 43.5 99 W07 - - - - - - W08 89 44 $317,598 $285,000 49.4 98 W08 - - - - - - W09 109 19 $205,303 $227,000 17.4 94 W09 - - - - - - W10 133 41 $167,044 $160,000 30.8 96 W10 - - - - - - W12 41 25 $255,436 $234,000 61.0 98 W12 - - - - - - W13 24 8 $212,375 $174,500 33.3 97 W13 - - - - - - W14 28 13 $210,492 $210,000 46.4 97 W14 - 1 $426,000 $426,000 - 98 W15 342 156 $245,586 $240,250 45.6 98 W15 1 1 $371,000 $371,000 100.0 98 W16 12 8 $253,813 $243,750 66.7 98 W16 3 - - - - - W17 - - - - - - W17 - - - - - - W18 17 1 $205,000 $205,000 5.9 98 W18 - - - - - - W19 67 43 $227,414 $211,000 64.2 97 W19 1 1 $488,000 $488,000 100.0 98 W20 46 24 $214,104 $216,500 52.2 98 W20 3 3 $423,833 $432,000 100.0 99 W21 65 11 $330,409 $246,000 16.9 98 W21 3 4 $545,163 $555,875 133.3 98 W22 5 2 $284,400 $284,400 40.0 95 W22 - 3 $339,667 $340,000 - 100 W23 50 23 $200,321 $189,000 46.0 97 W23 4 7 $307,486 $318,000 175.0 96 W24 62 32 $177,699 $164,000 51.6 97 W24 - 1 $367,000 $367,000 - 97 W25 25 9 $245,867 $242,000 36.0 98 W25 - - - - - - W26 - - - - - - W26 - - - - - - W27 11 3 $212,467 $199,900 27.3 99 W27 1 1 $277,500 $277,500 100.0 97 W28 2 - - - - - W28 1 - - - - - W29 20 1 $204,000 $204,000 5.0 96 W29 - - - - - - 8 TORONTO REAL ESTATE BOARD
- 9. SINGLE FAMILY WEST BREAKDOWN - MARCH 2011 West District Condo Townhouse Detached Condo Area Act Sales Av. Price Med. Price % S-A Av. % List Area Act Sales Av. Price Med. Price % S-A Av. % List W01 17 7 $340,114 $337,000 41.2 99 W01 - - - - - - W02 15 14 $370,721 $381,950 93.3 100 W02 - - - - - - W03 2 - - - - - W03 - - - - - - W04 13 6 $259,083 $239,000 46.2 98 W04 - - - - - - W05 60 15 $235,500 $249,000 25.0 96 W05 - - - - - - W06 13 8 $407,438 $374,500 61.5 100 W06 - - - - - - W07 3 - - - - - W07 - - - - - - W08 11 8 $451,272 $330,000 72.7 100 W08 - - - - - - W09 7 1 $377,000 $377,000 14.3 97 W09 - - - - - - W10 19 9 $173,111 $186,000 47.4 98 W10 - - - - - - W12 19 14 $476,993 $415,200 73.7 99 W12 - - - - - - W13 15 19 $287,542 $253,000 126.7 99 W13 - - - - - - W14 34 14 $221,929 $177,500 41.2 97 W14 - - - - - - W15 26 33 $298,618 $299,900 126.9 98 W15 - - - - - - W16 31 28 $291,614 $265,200 90.3 98 W16 - - - - - - W17 - - - - - - W17 - - - - - - W18 21 9 $226,211 $185,000 42.9 98 W18 - - - - - - W19 65 50 $315,628 $327,250 76.9 99 W19 - - - - - - W20 78 59 $301,877 $290,000 75.6 99 W20 1 - - - - - W21 22 12 $312,933 $284,000 54.6 97 W21 - - - - - - W22 4 4 $228,875 $229,500 100.0 98 W22 - - - - - - W23 34 29 $252,759 $253,000 85.3 98 W23 - - - - - - W24 43 26 $206,592 $205,450 60.5 97 W24 5 - - - - - W25 13 12 $263,333 $263,500 92.3 98 W25 - - - - - - W26 - - - - - - W26 - - - - - - W27 9 6 $228,817 $224,950 66.7 99 W27 - - - - - - W28 2 1 $260,000 $260,000 50.0 96 W28 - - - - - - W29 5 - - - - - W29 - - - - - - Co-op Apartment Attached/Row/Townhouse Area Act Sales Av. Price Med. Price % S-A Av. % List Area Act Sales Av. Price Med. Price % S-A Av. % List W01 - 1 $193,000 $193,000 - 97 W01 3 2 $752,500 $752,500 66.7 100 W02 1 - - - - - W02 5 - - - - - W03 - - - - - - W03 3 1 $230,000 $230,000 33.3 100 W04 - - - - - - W04 6 2 $352,250 $352,250 33.3 99 W05 6 1 $86,500 $86,500 16.7 96 W05 8 4 $365,000 $362,500 50.0 99 W06 1 3 $102,633 $87,900 300.0 95 W06 8 5 $487,480 $475,000 62.5 101 W07 1 1 $140,000 $140,000 100.0 88 W07 1 9 $608,556 $612,500 900.0 99 W08 2 1 $123,000 $123,000 50.0 100 W08 2 2 $489,963 $489,963 100.0 100 W09 4 - - - - - W09 - - - - - - W10 - - - - - - W10 2 1 $355,000 $355,000 50.0 99 W12 - - - - - - W12 3 - - - - - W13 - - - - - - W13 5 3 $557,333 $443,000 60.0 97 W14 - 1 $145,000 $145,000 - 104 W14 2 3 $419,667 $395,000 150.0 99 W15 - - - - - - W15 - - - - - - W16 - - - - - - W16 1 - - - - - W17 - - - - - - W17 1 - - - - - W18 - - - - - - W18 - - - - - - W19 - - - - - - W19 12 16 $397,625 $392,000 133.3 98 W20 - - - - - - W20 19 32 $382,366 $383,400 168.4 99 W21 1 - - - - - W21 66 30 $420,343 $405,500 45.5 99 W22 - - - - - - W22 29 62 $336,211 $333,250 213.8 99 W23 1 - - - - - W2 3 45 37 $309,095 $305,600 82.2 98 W24 1 - - - - - W24 25 36 $313,762 $314,000 144.0 99 W25 - - - - - - W25 9 8 $357,125 $340,250 88.9 99 W26 - - - - - - W26 1 - - - - - W27 - - - - - - W27 6 5 $345,000 $356,000 83.3 100 W28 - - - - - - W28 8 8 $340,097 $329,750 100.0 98 W29 - - - - - - W29 s2 2 $267,450 $267,450 100.0 99 TORONTO REAL ESTATE BOARD 9
- 10. Central District Current Month: March 2011 Area Active New Sales $ Volume Avg Price Med Price Avg DOM Avg%List C01 1,013 917 523 $223,986,402 $428,272 $380,000 23 99 C02 196 151 100 $93,040,563 $930,406 $720,208 24 102 C03 121 82 57 $44,491,913 $780,560 $511,000 29 100 C04 182 180 103 $94,547,609 $917,938 $833,500 18 101 C06 61 64 39 $17,796,080 $456,310 $445,000 22 98 C07 219 243 146 $67,064,168 $459,344 $373,250 21 99 C08 309 267 160 $68,452,063 $427,825 $379,500 23 99 C09 47 50 53 $59,741,500 $1,127,198 $745,000 26 98 C10 159 144 96 $74,123,420 $772,119 $555,000 17 100 C11 53 54 44 $24,274,335 $551,689 $500,500 27 101 C12 100 71 47 $71,700,600 $1,525,545 $1,388,800 32 98 C13 98 107 80 $38,139,650 $476,746 $399,550 21 100 C14 264 322 206 $108,119,752 $524,853 $395,500 20 100 C15 197 212 145 $68,206,278 $470,388 $390,000 20 100 TOTAL 3,019 2,864 1,799 $1,053,684,333 $585,706 $417,000 22 100 Central District Central District 80 Days on Market 80 Sales Active Listing Ratio 60 60 40 40 20 20 0 0 Mar Apr May Jun Jul Aug Sep Oct Nov Dec Jan Feb Mar Mar Apr May Jun Jul Aug Sep Oct Nov Dec Jan Feb Mar 2010 2011 2010 2011 Year-to-Date: March 2011 Area Listed Sales $ Volume Avg Price Med Price Avg DOM Avg%List C01 2,147 1,123 $476,265,908 $424,101 $374,900 28 99 C02 351 174 $154,597,441 $888,491 $640,000 27 101 C03 249 122 $97,920,781 $802,629 $505,000 27 101 C04 409 217 $190,255,074 $876,751 $750,000 22 100 C06 155 84 $39,838,830 $474,272 $453,500 21 98 C07 533 328 $148,228,078 $451,915 $370,500 26 99 C08 679 361 $153,241,229 $424,491 $378,000 24 99 C09 149 102 $120,390,960 $1,180,304 $758,750 27 99 C10 399 242 $191,916,174 $793,042 $547,950 21 100 C11 152 93 $55,262,388 $594,219 $550,000 26 100 C12 174 85 $130,132,500 $1,530,971 $1,380,000 35 98 C13 253 146 $65,514,850 $448,732 $370,000 24 100 C14 762 501 $251,319,023 $501,635 $391,000 24 100 C15 508 301 $144,004,016 $478,419 $398,800 24 100 TOTAL 6,920 3,879 $2,218,887,252 $572,026 $412,000 26 99 10 TORONTO REAL ESTATE BOARD
- 11. SINGLE FAMILY CENTRAL BREAKDOWN - MARCH 2011 Central District Detached Houses Semi-Detached Houses Area Act Sales Av. Price Med. Price % S-A Av. % List Area Act Sales Av. Price Med. Price % S-A Av.% List C01 4 5 $864,700 $785,000 125.0 101 C01 28 27 $727,743 $753,000 96.4 105 C02 36 31 $1,080,183 $925,000 86.1 105 C02 22 31 $877,863 $640,000 140.9 103 C03 60 32 $912,579 $472,000 53.3 101 C03 19 9 $782,321 $590,000 47.4 104 C04 126 66 $1,172,859 $1,005,000 52.4 101 C04 3 7 $681,636 $688,000 233.3 108 C06 25 18 $605,556 $585,750 72.0 98 C06 1 - - - - - C07 86 40 $719,350 $643,500 46.5 101 C07 3 5 $477,600 $483,000 166.7 102 C08 3 1 $480,000 $480,000 33.3 100 C08 7 6 $969,833 $1,082,500 85.7 106 C09 20 15 $2,033,207 $1,735,000 75.0 99 C09 3 4 $1,567,000 $1,424,000 133.3 97 C10 46 28 $1,388,808 $1,140,560 60.9 102 C10 9 8 $707,625 $650,000 88.9 98 C11 16 16 $1,047,299 $1,005,618 100.0 105 C11 3 5 $582,200 $577,000 166.7 101 C12 80 34 $1,800,900 $1,550,000 42.5 98 C12 - - - - - - C13 9 20 $835,299 $729,300 222.2 103 C13 6 10 $428,470 $399,550 166.7 101 C14 70 49 $991,992 $850,000 70.0 101 C14 - - - - - - C15 31 32 $829,450 $818,750 103.2 105 C15 19 17 $478,047 $490,000 89.5 102 Condo Apartment Link Area Act Sales Av. Price Med. Price % S-A Av. % List Area Act Sales Av. Price Med. Price % S-A Av.% List C01 924 448 $400,598 $362,800 48.5 99 C01 - - - - - - C02 111 27 $863,641 $555,000 24.3 97 C02 - - - - - - C03 37 11 $626,955 $730,000 29.7 98 C03 - - - - - - C04 40 23 $339,372 $286,500 57.5 98 C04 - - - - - - C06 35 17 $304,587 $290,500 48.6 98 C06 - - - - - - C07 104 85 $334,044 $312,000 81.7 98 C07 3 1 $471,000 $471,000 33.3 102 C08 280 138 $391,485 $354,120 49.3 99 C08 - - - - - - C09 18 26 $711,535 $615,000 144.4 98 C09 - - - - - - C10 94 54 $484,807 $406,000 57.5 99 C10 - - - - - - C11 33 19 $157,529 $143,100 57.6 97 C11 - - - - - - C12 15 9 $658,389 $485,000 60.0 97 C12 - - - - - - C13 79 43 $315,139 $282,000 54.4 98 C13 - 1 $549,000 $549,000 - 100 C14 167 128 $356,626 $345,000 76.7 100 C14 - - - - - - C15 119 70 $340,154 $300,000 58.8 98 C15 1 4 $486,500 $476,500 400.0 103 Condo Townhouse Detached Condo Area Act Sales Av. Price Med. Price % S-A Av. % List Area Act Sales Av. Price Med. Price % S-A Av.% List C01 41 30 $429,428 $411,000 73.2 100 C01 - - - - - - C02 8 3 $1,028,604 $1,330,813 37.5 96 C02 - - - - - - C03 - - - - - - C03 - - - - - - C04 2 1 $237,000 $237,000 50.0 99 C04 - - - - - - C06 - 2 $353,050 $353,050 - 102 C06 - - - - - - C07 16 11 $421,127 $375,000 68.8 98 C07 - - - - - - C08 9 10 $453,370 $483,200 111.1 99 C08 - - - - - - C09 - 3 $875,167 $750,000 - 100 C09 - - - - - - C10 6 5 $537,440 $440,200 83.3 98 C10 1 - - - - - C11 1 3 $343,333 $435,000 300.0 98 C11 - - - - - - C12 5 2 $884,750 $884,750 40.0 96 C12 - - - - - - C13 2 2 $354,500 $354,500 100.0 101 C13 - - - - - - C14 17 24 $468,458 $443,944 141.2 100 C14 - - - - - - C15 25 21 $344,166 $358,000 84.0 101 C15 - - - - - - TORONTO REAL ESTATE BOARD 11
- 12. SINGLE FAMILY CENTRAL BREAKDOWN - MARCH 2011 Central District Co-op Apartment Attached/Row/Townhouse Area Act Sales Av. Price Med. Price % S-A Av. % List Area Act Sales Av. Price Med. Price % S-A Av. % List C01 1 - - - - - C01 15 13 $589,462 $566,000 86.7 98 C02 4 - - - - - C02 15 8 $742,125 $830,000 53.3 102 C03 4 5 $270,400 $252,000 125.0 98 C03 1 - - - - - C04 5 3 $256,300 $249,000 60.0 99 C04 6 3 $1,185,333 $1,100,000 50.0 101 C06 - - - - - - C06 - 2 $506,000 $506,000 - 98 C07 - - - - - - C07 7 4 $601,250 $616,500 57.1 100 C08 - - - - - - C08 10 5 $718,900 $565,000 50.0 98 C09 5 5 $370,000 $405,000 100.0 99 C09 1 - - - - - C10 1 - - - - - C10 2 1 $709,000 $709,000 50.0 109 C11 - - - - - - C11 - 1 $583,500 $583,500 - 106 C12 - - - - - - C12 - 2 $1,387,500 $1,387,500 - 98 C13 - - - - - - C13 2 4 $585,000 $570,000 200.0 104 C14 2 2 $193,500 $193,500 100.0 100 C14 8 3 $744,667 $681,000 37.5 98 C15 2 - - - - - C15 - 1 $552,800 $552,800 - 97 North District Current Month: March 2011 Area Active New Sales $ Volume Avg Price Med Price Avg DOM Avg %List N01 95 102 72 $41,740,305 $579,726 $475,500 21 98 N02 215 197 115 $57,540,768 $500,355 $420,000 21 99 N03 313 346 228 $128,251,764 $562,508 $497,500 20 99 N04 199 241 138 $81,633,576 $591,548 $587,950 15 100 N05 180 200 113 $64,026,898 $566,610 $566,000 17 98 N06 183 154 93 $47,576,016 $511,570 $452,000 21 98 N07 181 201 134 $53,704,825 $400,782 $372,500 21 99 N08 434 451 271 $149,118,403 $550,252 $510,000 20 99 N10 116 145 72 $36,673,999 $509,361 $483,500 18 100 N11 357 441 320 $178,915,312 $559,110 $507,000 16 100 N12 110 105 60 $28,552,755 $475,879 $448,750 20 98 N13 67 26 13 $10,287,894 $791,376 $865,000 65 96 N14 160 60 22 $15,915,300 $723,423 $591,950 48 95 N15 72 51 30 $13,397,500 $446,583 $402,500 42 98 N16 148 67 30 $13,389,050 $446,302 $437,500 44 97 N17 257 165 78 $20,972,968 $268,884 $255,000 33 98 N18 108 78 55 $19,709,950 $358,363 $354,000 30 98 N19 176 89 45 $13,638,988 $303,089 $289,000 49 98 N20 25 13 6 $3,142,500 $523,750 $490,000 32 99 N21 45 19 14 $4,657,400 $332,671 $302,750 104 97 N22 147 84 13 $3,304,000 $254,154 $228,000 71 97 N23 210 108 41 $12,037,123 $293,588 $293,000 46 97 N24 132 50 11 $2,490,000 $226,364 $202,000 76 96 TOTAL 3,930 3,393 1,974 $1,000,677,294 $506,929 $462,500 24 99 12 TORONTO REAL ESTATE BOARD
- 13. North District North District North District 80 Days on Market 80 Sales Active Listing Ratio 60 60 40 40 20 20 0 0 Mar Apr May Jun Jul Aug Sep Oct Nov Dec Jan Feb Mar Mar Apr May Jun Jul Aug Sep Oct Nov Dec Jan Feb Mar 2010 2011 2010 2011 Year-to-Date: March 2011 Area Listed Sales $ Volume Avg Price Med Price Avg DOM Avg %List N01 257 172 $98,977,566 $575,451 $466,000 24 98 N02 474 253 $127,856,166 $505,360 $415,000 25 99 N03 798 440 $241,770,440 $549,478 $485,009 22 99 N04 486 265 $150,055,356 $566,247 $562,500 20 99 N05 453 240 $138,711,648 $577,965 $560,500 19 99 N06 366 203 $103,862,316 $511,637 $437,000 25 98 N07 462 287 $114,412,935 $398,651 $368,000 23 98 N08 1,031 596 $324,759,474 $544,898 $498,250 24 98 N10 295 153 $78,895,099 $515,654 $483,500 22 100 N11 977 620 $339,247,258 $547,173 $490,000 20 99 N12 220 129 $59,264,555 $459,415 $427,900 27 98 N13 68 24 $19,228,644 $801,194 $782,500 95 96 N14 149 47 $36,198,050 $770,171 $719,000 61 95 N15 113 54 $23,867,800 $441,996 $416,500 46 97 N16 188 72 $30,821,450 $428,076 $419,000 44 97 N17 357 160 $43,183,018 $269,894 $260,500 40 98 N18 193 116 $39,035,850 $336,516 $323,750 34 98 N19 208 97 $28,996,535 $298,933 $283,000 53 98 N20 27 9 $4,864,500 $540,500 $550,000 42 98 N21 46 20 $7,150,400 $357,520 $309,000 105 97 N22 148 31 $9,551,500 $308,113 $255,500 71 97 N23 233 92 $27,092,523 $294,484 $283,500 56 97 N24 125 32 $7,441,980 $232,562 $206,000 73 96 TOTAL 7,674 4,112 $2,055,245,063 $499,816 $450,000 28 98 TORONTO REAL ESTATE BOARD 13
- 14. SINGLE FAMILY NORTH BREAKDOWN - MARCH 2011 North District Detached Houses Semi-Detached Houses Area Act Sales Av. Price Med. Price % S-A Av. % List Area Act Sales Av. Price Med. Price % S-A Av. % List N01 50 34 $864,150 $725,450 68.0 99 N01 2 2 $482,000 $482,000 100.0 99 N02 88 48 $712,965 $603,000 54.6 100 N02 - 1 $455,000 $455,000 - 101 N03 129 90 $855,982 $748,500 69.8 99 N03 17 10 $518,000 $499,000 58.8 99 N04 137 101 $654,246 $645,100 73.7 100 N04 8 13 $446,685 $481,000 162.5 102 N05 149 86 $608,501 $600,900 57.7 98 N05 9 6 $443,583 $436,000 66.7 102 N06 118 60 $587,906 $501,500 50.9 99 N06 6 8 $360,813 $346,000 133.3 99 N07 132 86 $445,733 $427,500 65.2 98 N07 17 21 $328,374 $332,000 123.5 98 N08 291 163 $648,158 $578,000 56.0 98 N08 44 32 $445,347 $450,500 72.7 100 N10 73 26 $622,612 $596,750 35.6 99 N10 3 4 $415,950 $411,000 133.3 101 N11 187 168 $694,806 $631,000 89.8 100 N11 22 34 $446,074 $438,750 154.6 100 N12 89 38 $545,023 $485,500 42.7 98 N12 12 13 $367,762 $367,000 108.3 98 N13 67 13 $791,376 $865,000 19.4 96 N13 - - - - - - N14 147 20 $763,645 $689,500 13.6 95 N14 1 - - - - - N15 67 25 $478,940 $445,500 37.3 97 N15 - 1 $265,000 $265,000 - 99 N16 133 26 $478,944 $457,125 19.6 97 N16 - 1 $165,000 $165,000 - 97 N17 243 68 $273,272 $273,500 28.0 98 N17 6 2 $269,000 $269,000 33.3 99 N18 93 40 $390,881 $381,000 43.0 97 N18 4 1 $296,600 $296,600 25.0 99 N19 120 36 $315,764 $298,450 30.0 98 N19 1 1 $210,000 $210,000 100.0 98 N20 25 6 $523,750 $490,000 24.0 99 N20 - - - - - - N21 45 14 $332,671 $302,750 31.1 97 N21 - - - - - - N22 108 8 $272,375 $244,500 7.4 96 N22 3 - - - - - N23 205 37 $303,165 $300,000 18.1 97 N23 - - - - - - N24 126 10 $232,000 $206,000 7.9 96 N24 1 - - - - - Condo Apartment Link Area Act Sales Av. Price Med. Price % S-A Av. % List Area Act Sales Av. Price Med. Price % S-A Av. % List N01 21 19 $304,500 $282,500 90.5 97 N01 2 1 $524,000 $524,000 50.0 99 N02 108 47 $313,797 $302,000 43.5 98 N02 4 7 $408,214 $398,000 175.0 99 N03 105 80 $300,611 $283,500 76.2 98 N03 6 4 $477,750 $440,500 66.7 99 N04 26 6 $270,250 $252,000 23.1 96 N04 - - - - - - N05 - - - - - - N05 1 4 $462,750 $457,500 400.0 98 N06 24 5 $343,400 $312,000 20.8 97 N06 - 1 $455,000 $455,000 - 99 N07 12 5 $281,500 $267,000 41.7 100 N07 - 1 $357,500 $357,500 - 99 N08 57 12 $274,292 $282,500 21.1 97 N08 - 2 $435,000 $435,000 - 100 N10 13 2 $292,750 $292,750 15.4 96 N10 19 37 $461,211 $449,000 194.7 102 N11 73 41 $332,570 $323,000 56.2 98 N11 11 19 $514,674 $490,000 172.7 100 N12 - - - - - - N12 - - - - - - N13 - - - - - - N13 - - - - - - N14 11 1 $219,900 $219,900 9.1 100 N14 - - - - - - N15 - - - - - - N15 - - - - - - N16 7 1 $200,000 $200,000 14.3 99 N16 3 1 $316,500 $316,500 33.3 96 N17 - - - - - - N17 1 - - - - - N18 2 2 $179,500 $179,500 100.0 98 N18 4 9 $294,611 $298,000 225.0 99 N19 8 - - - - - N19 2 1 $236,000 $236,000 50.0 96 N20 - - - - - - N20 - - - - - - N21 - - - - - - N21 - - - - - - N22 - - - - - - N22 17 2 $250,500 $250,500 11.8 99 N23 - - - - - - N23 - 1 $221,500 $221,500 - 98 N24 - - - - - - N24 - - - - - - 14 TORONTO REAL ESTATE BOARD
- 15. SINGLE FAMILY NORTH BREAKDOWN - MARCH 2011 North District Condo Townhouse Detached Condo Area Act Sales Av. Price Med. Price % S-A Av. % List Area Act Sales Av. Price Med. Price % S-A Av. % List N01 18 15 $313,047 $305,000 83.3 98 N01 - - - - - - N02 14 10 $410,750 $397,000 71.4 98 N02 - - - - - - N03 22 10 $329,200 $307,000 45.5 98 N03 - - - - - - N04 9 4 $351,250 $345,000 44.4 100 N04 - - - - - - N05 1 - - - - - N05 - - - - - - N06 13 3 $552,667 $638,000 23.1 97 N06 - - - - - - N07 4 6 $277,167 $260,000 150.0 101 N07 - - - - - - N08 7 10 $354,250 $351,000 142.9 99 N08 - - - - - - N10 6 - - - - - N10 - - - - - - N11 24 20 $374,025 $359,500 83.3 99 N11 - - - - - - N12 - - - - - - N12 - - - - - - N13 - - - - - - N13 - - - - - - N14 1 1 $422,500 $422,500 100.0 94 N14 - - - - - - N15 - - - - - - N15 - - - - - - N16 4 - - - - - N16 - - - - - - N17 1 - - - - - N17 1 - - - - - N18 1 - - - - - N18 - - - - - - N19 11 - - - - - N19 25 1 $458,989 $458,989 4.0 99 N20 - - - - - - N20 - - - - - - N21 - - - - - - N21 - - - - - - N22 - - - - - - N22 - - - - - - N23 - - - - - - N23 - - - - - - N24 2 - - - - - N24 - - - - - - Co-op Apartment Attached/Row/Townhouse Area Act Sales Av. Price Med. Price % S-A Av. % List Area Act Sales Av. Price Med. Price % S-A Av. % List N01 - - - - - - N01 2 1 $390,000 $390,000 50.0 104 N02 - - - - - - N02 1 2 $575,000 $575,000 200.0 99 N03 - - - - - - N03 34 34 $493,574 $505,000 100.0 100 N04 - - - - - - N04 19 14 $480,093 $482,500 73.7 100 N05 - - - - - - N05 20 17 $422,546 $430,000 85.0 100 N06 - - - - - - N06 22 16 $349,072 $354,051 72.7 99 N07 - - - - - - N07 16 15 $336,527 $330,000 93.8 99 N08 - - - - - - N08 35 52 $413,721 $415,000 148.6 100 N10 - - - - - - N10 2 3 $390,667 $385,000 150.0 99 N11 - - - - - - N11 40 38 $424,386 $410,645 95.0 100 N12 - - - - - - N12 9 9 $340,111 $345,000 100.0 99 N13 - - - - - - N13 - - - - - - N14 - - - - - - N14 - - - - - - N15 - - - - - - N15 5 4 $289,750 $289,000 80.0 99 N16 - - - - - - N16 1 1 $255,000 $255,000 100.0 94 N17 - - - - - - N17 5 8 $231,563 $232,500 160.0 98 N18 - - - - - - N18 4 3 $255,867 $257,500 75.0 100 N19 - - - - - - N19 9 6 $227,750 $230,750 66.7 98 N20 - - - - - - N20 - - - - - - N21 - - - - - - N21 - - - - - - N22 - - - - - - N22 19 3 $208,000 $210,000 15.8 98 N23 - - - - - - N23 5 3 $199,500 $190,000 60.0 97 N24 - - - - - - N24 3 1 $170,000 $170,000 33.3 97 TORONTO REAL ESTATE BOARD 15
- 16. District Totals New Active Listed Sales $ Volume Avg Price Med Price Avg DOM Avg %List Grand Total 15,315 16,616 N/A 9,262 4,224,832,331 456,147 385,000 23 99 Year N/A N/A 35,690 19,610 8,799,282,200 448,714 377,000 27 99 Annual Summary - Single Family Year *Number of Sales *Average Price Year *Number of Sales *Average Price 1977 20,512 $64,559 2010 1978 21,184 $67,333 January 4,986 $409,058 1979 23,466 $70,830 February 7,291 $431,509 1980 26,017 $75,694 March 10,430 $434,696 1981 29,625 $90,203 April 10,898 $437,600 1982 25,336 $95,496 May 9,470 $446,593 1983 30,046 $101,626 June 8,442 $435,034 1984 31,905 $102,318 July 6,564 $420,482 1985 45,509 $109,094 August 6,232 $411,012 1986 52,919 $138,925 September 6,310 $427,329 1987 43,475 $189,105 October 6,681 $443,729 1988 49,381 $229,635 November 6,510 $438,030 1989 38,960 $273,698 December 4,395 $433,946 1990 26,779 $255,020 1991 38,144 $234,313 Year-to-Date** 86,170 $431,463 1992 41,703 $214,971 1993 38,990 $206,490 2011 1994 44,237 $208,921 January 4,337 $427,037 1995 39,273 $203,028 February 6,266 $454,423 1996 55,779 $198,150 March 9,262 $456,147 1997 58,014 $211,307 1998 55,344 $216,815 Year-to-Date** 19,610 $448,714 1999 58,957 $228,372 2000 58,343 $243,255 2001 67,612 $251,508 2002 74,759 $275,231 2003 78,898 $293,067 2004 83,501 $315,231 2005 84,145 $335,907 2006 83,084 $351,941 2007 93,193 $376,236 2008 74,552 $379,347 2009 87,308 $395,460 * Due to District revisions, caution should be exercised when undertaking historical comparisons. Please refer to appropriate maps. **This figure may not equal the sum of all monthly totals, as the year-to-date total reflects sales reported in error and deals that have fallen through since January 1st. Single Family Dwelling Sales Comparison Sales Active Listings Average Price 15000 500000 35000 13500 30000 12000 425000 10500 25000 9000 20000 7500 350000 6000 15000 4500 10000 275000 3000 5000 1500 0 0 200000 Mar Apr May Jun Jul Aug Sep Oct Nov Dec Jan Feb Mar Mar Apr May Jun Jul Aug Sep Oct Nov Dec Jan Feb Mar 2001 2002 2003 2004 2005 2006 2007 2008 2009 2010 2011 2010 2011 2010 2011 16 TORONTO REAL ESTATE BOARD