The January 2013 real estate statistics for Sarasota show:
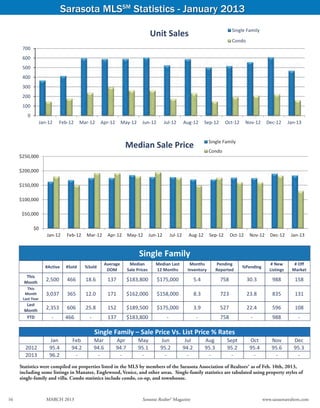
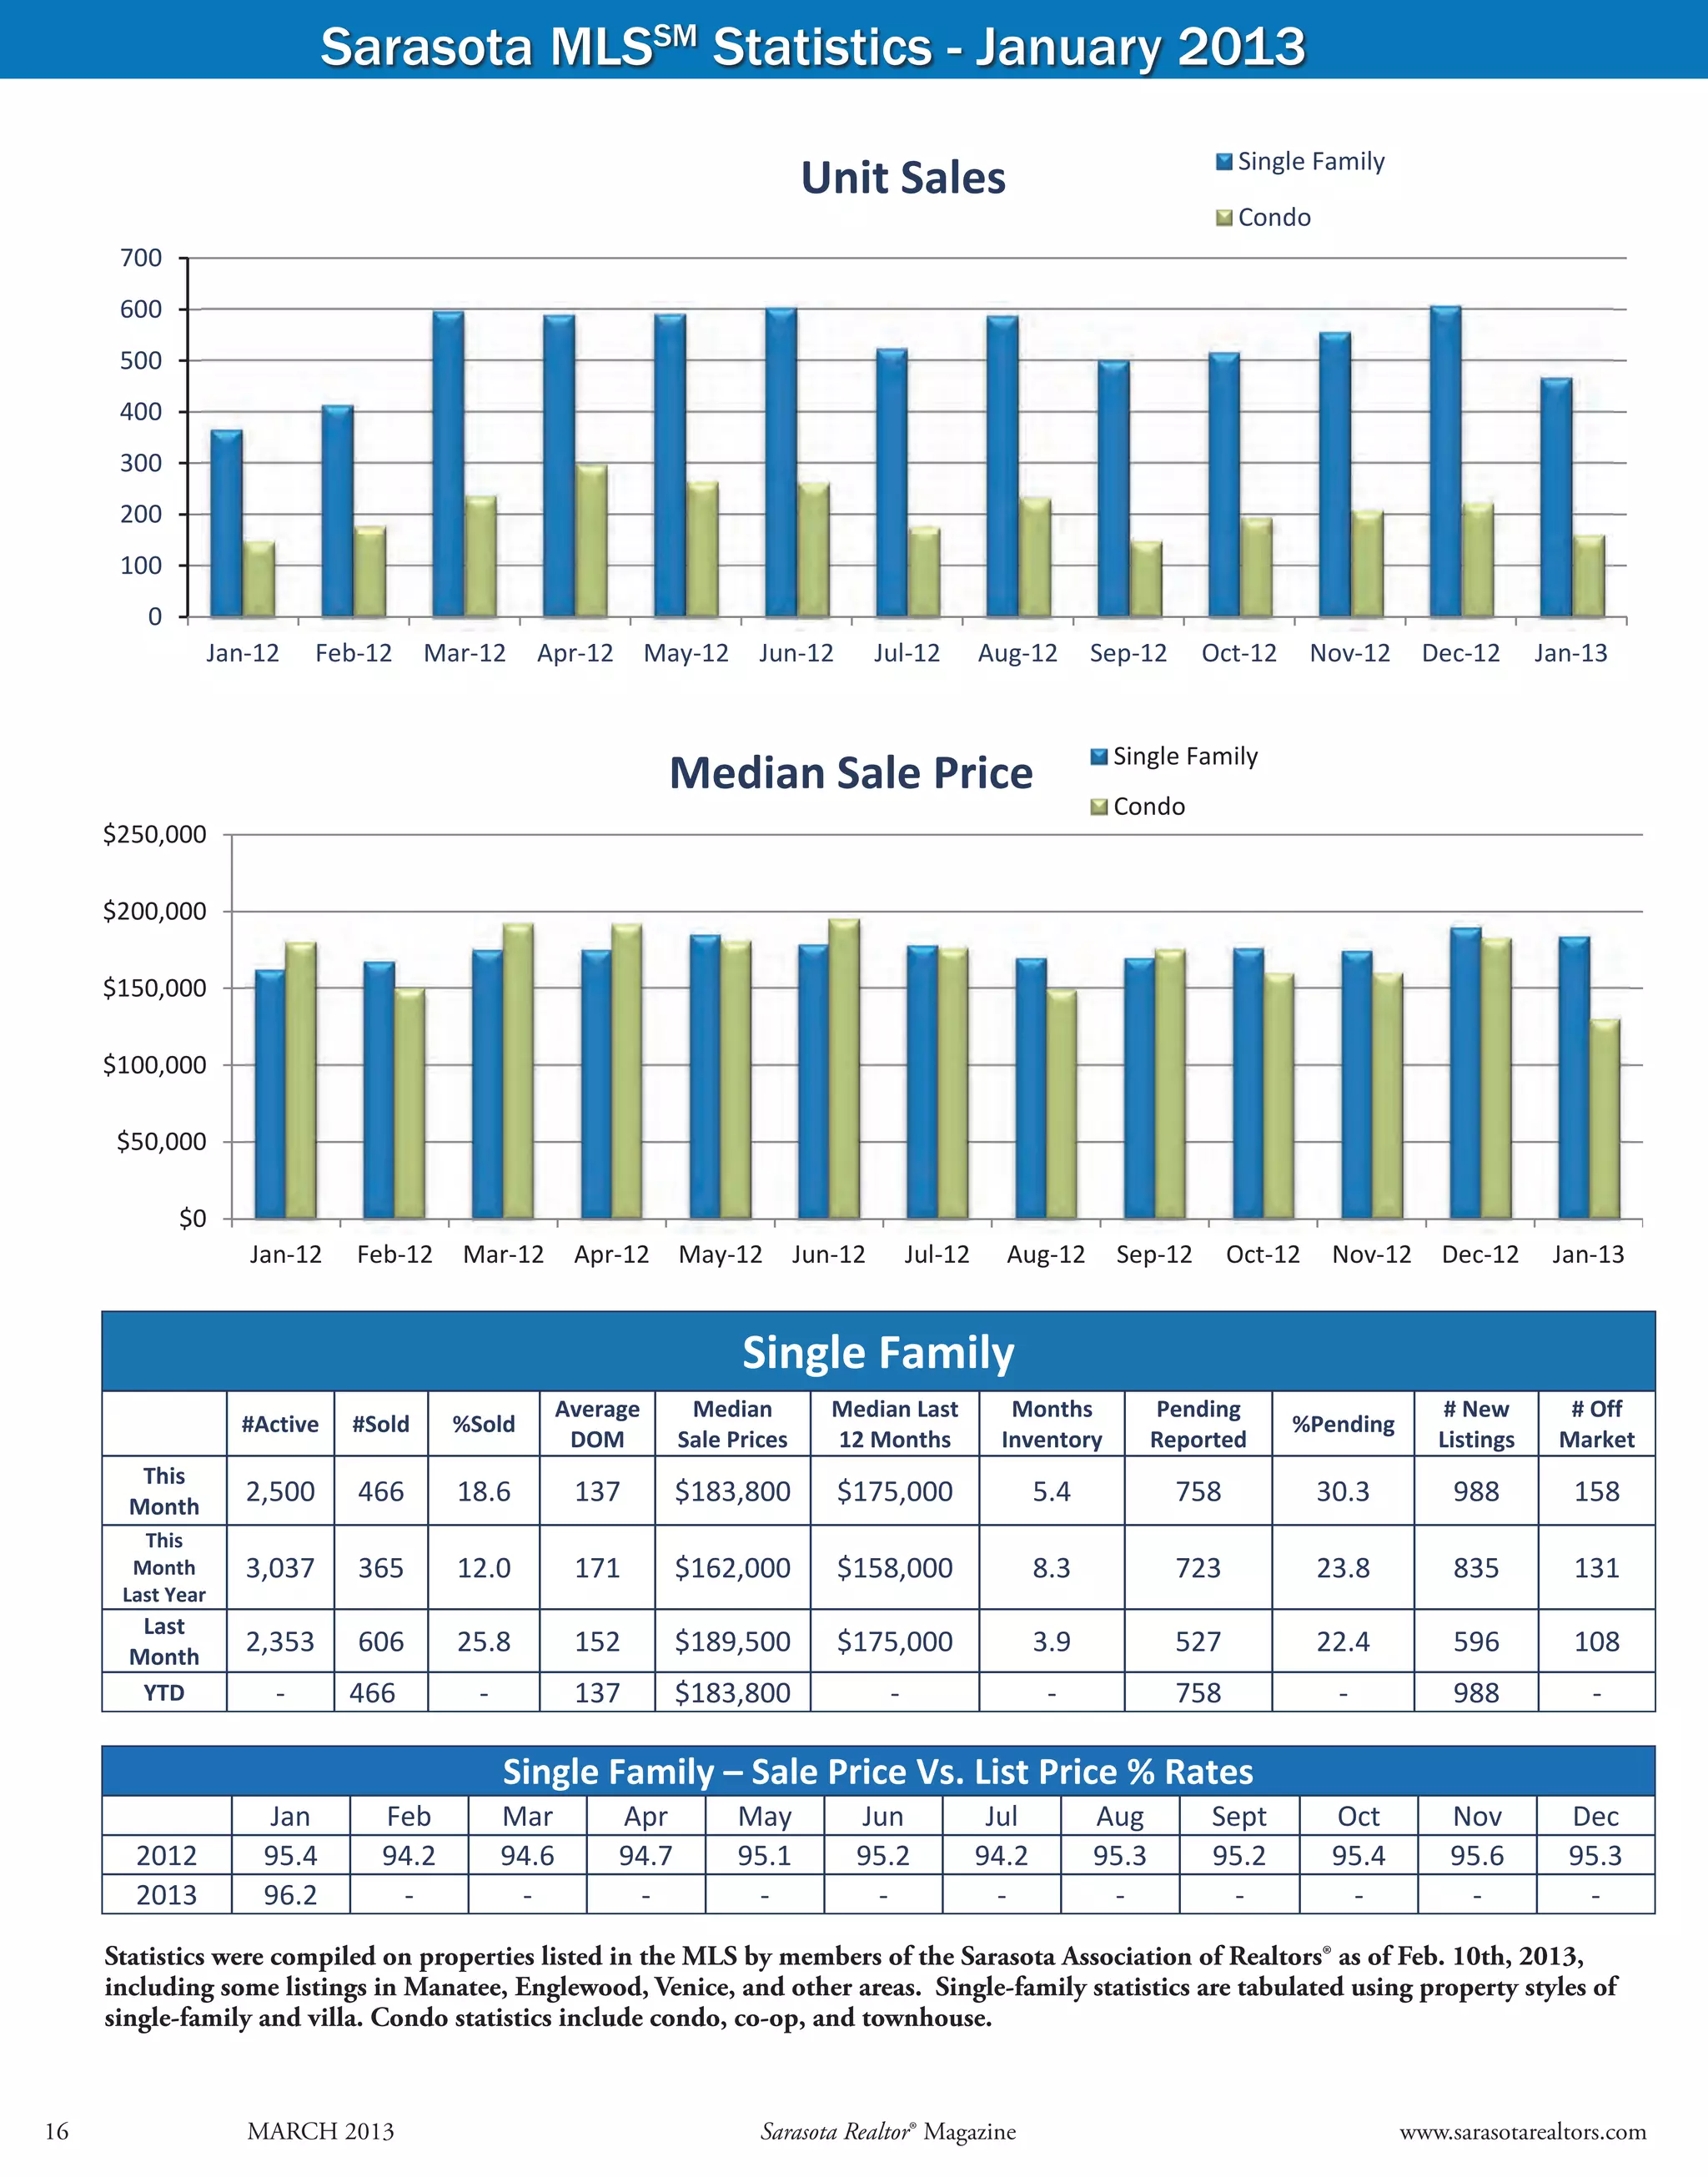
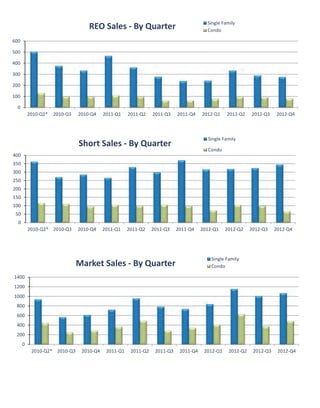
- Single family home sales decreased 18.6% compared to last January, while condo sales decreased 11.9%
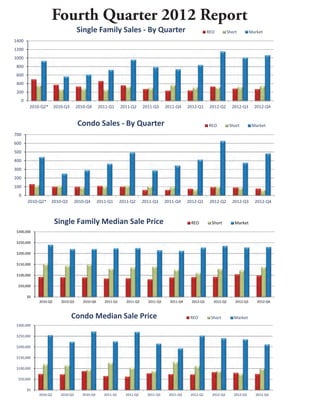
- The median sale price of single family homes was $183,800, up 4.3% from last January. The condo median was $130,000, down 28.6%.
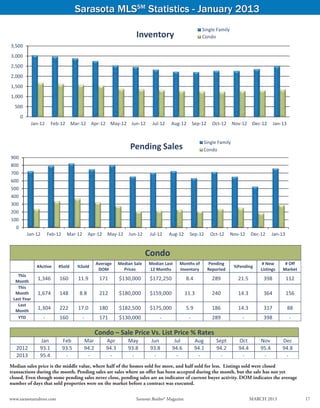
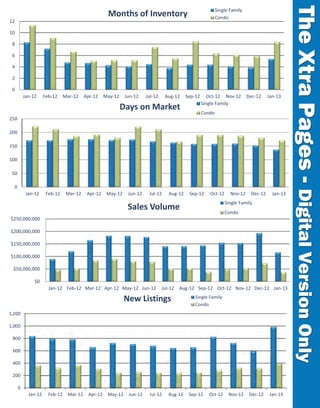
- Both single family and condo inventory levels increased compared to last year, with months of inventory at 5.4 and 8.4 respectively.