TREB
•
0 likes•307 views

- Sales of single family homes in the Greater Toronto Area were down 14% in February 2011 compared to February 2010, though the average selling price increased over 5%. - The median home price in February 2011 was $379,000, up 3.5% from February 2010. - Market conditions remain tight with competition between buyers continuing to drive price growth, though sales activity is lower than the record set in February 2010.

More Related Content
What's hot
What's hot (12)
Similar to TREB
Similar to TREB (20)
More from Harish Maraj
More from Harish Maraj (20)
Recently uploaded
Recently uploaded (15)
TREB
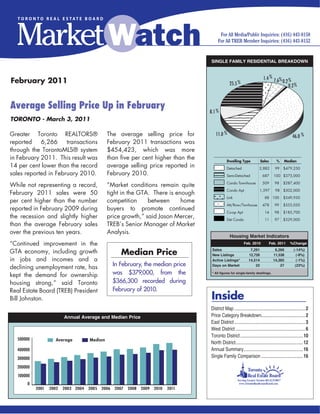
- 1. SINGLE FAMILY RESIDENTIAL BREAKDOWN 1.4 % 7.6% % February 2011 25.5 % 0.2 0.2 % Average Selling Price Up in February 8.1 % TORONTO - March 3, 2011 Greater Toronto REALTORS® The average selling price for 11.0 % 46.0 % reported 6,266 transactions February 2011 transactions was through the TorontoMLS® system $454,423, which was more in February 2011. This result was than five per cent higher than the 2.3 7.0 % % Dwelling Type Sales % Median 14 per cent lower than the record average 21.5 selling price reported in % 0.3 0.1 % % Single Detached 2,882 Detached 99 $479,250 sales reported in February 2010. February 2010. Semi Detached Semi-Detached 687 100 $375,000 Condo T.H. Condo Townhouse 509 98 $287,400 While not representing a record, “Market conditions remain quite Condo Apt. Condo Apt 1,597 98 $302,000 February 2011 sales were 50 tight in the GTA. There is enough 8.5 % Link Link 88 100 $349,950 per cent higher than the number competition between home Attached/Row Att/Row/Twnhouse 478 99 $353,050 reported in February 2009 during buyers to promote continued Co-op Apt. 12.0 % Co-op Apt 14 98 $185,700 48.3 % the recession and slightly higher price growth,” said Jason Mercer, Detached Condo Det Condo 11 97 $329,000 than the average February sales TREB’s Senior Manager of Market over the previous ten years. Analysis. Housing Market Indicators “Continued improvement in the AuguNovFeb. 2010 Feb. 2011 %Change GTA economy, including growth Median Price Sales New Listings 7,291 12,726 6,266 11,538 (-14%) (-9%) in jobs and incomes and a Active Listings* 14,514 14,365 (-1%) declining unemployment rate, has In February, the median price Days on Market 22 27 (23%) kept the demand for ownership was $379,000, from the * All figures for single-family dwellings. housing strong,” said Toronto $366,300 recorded during Real Estate Board (TREB) President February of 2010. Bill Johnston. Inside District Map ............................................................. 2 Annual Average and Median Price Price Category Breakdown......................................2 East District ............................................................. 3 West District ............................................................ 6 Toronto District ......................................................10 500000 Average Median North District..........................................................12 400000 Annual Summary ...................................................16 300000 Single Family Comparison ....................................16 200000 100000 0 2001 2002 2003 2004 2005 2006 2007 2008 2009 2010 2011
- 2. District Map Price Category Breakdown - February 2011 Price Range Total S.F.D %S.F.D Condo Apt. %Condo Apt. Condo T.H. %Condo T.H. - - $90,000 18 0.3 11 0.7 4 0.8 $90,001 - $100,000 5 0.1 1 0.1 - - $100,001 - $110,000 6 0.1 3 0.2 2 0.4 $110,001 - $120,000 13 0.2 9 0.6 2 0.4 $120,001 - $130,000 12 0.2 9 0.6 1 0.2 $130,001 - $140,000 32 0.5 19 1.2 9 1.8 $140,001 - $150,000 29 0.5 20 1.3 3 0.6 $150,001 - $160,000 37 0.6 20 1.3 6 1.2 $160,001 - $170,000 67 1.1 40 2.5 14 2.8 $170,001 - $180,000 75 1.2 43 2.7 14 2.8 $180,001 - $190,000 66 1.1 33 2.1 13 2.6 $190,001 - $200,000 80 1.3 39 2.4 21 4.1 $200,001 - $225,000 233 3.7 119 7.5 44 8.6 $225,001 - $250,000 295 4.7 129 8.1 52 10.2 $250,001 - $300,000 724 11.6 296 18.5 104 20.4 $300,001 - $400,000 1,764 28.2 468 29.3 152 29.9 $400,001 - $500,000 1,139 18.2 181 11.3 37 7.3 $500,001 - $750,000 1,153 18.4 128 8.0 27 5.3 $750,001 - $1,000,000 275 4.4 16 1.0 4 0.8 $1,000,001 - $1,500,000 152 2.4 7 0.4 - - $1,500,001 - - 91 1.5 6 0.4 - - Total: 6,266 100 1,597 100 509 100 2 TORONTO REAL ESTATE BOARD
- 3. East District Current Month: February 2011 Area Active New Sales $ Volume Avg Price Med Price Avg DOM Avg %List E01 95 122 69 $37,055,130 $537,031 $500,000 13 103 E02 92 114 60 $35,719,926 $595,332 $519,469 16 101 E03 168 168 78 $33,379,250 $427,939 $394,500 22 101 E04 127 110 57 $16,843,770 $295,505 $338,000 23 99 E05 115 124 55 $20,370,300 $370,369 $346,000 16 100 E06 84 76 46 $21,185,779 $460,560 $385,051 16 99 E07 98 103 57 $21,253,595 $372,870 $347,000 20 99 E08 158 105 61 $22,176,100 $363,543 $344,000 36 98 E09 174 138 96 $27,309,348 $284,472 $267,500 34 98 E10 57 59 38 $16,148,127 $424,951 $426,450 23 99 E11 174 128 72 $21,066,910 $292,596 $279,250 36 98 E12 32 24 16 $4,733,400 $295,838 $296,450 29 99 E13 132 130 68 $24,677,111 $362,899 $336,450 30 98 E14 234 210 141 $47,962,216 $340,158 $325,000 26 98 E15 227 209 105 $32,497,550 $309,500 $292,000 23 98 E16 507 364 170 $41,024,150 $241,319 $225,000 32 98 E17 219 161 87 $22,847,470 $262,615 $248,500 29 98 E18 19 6 4 $2,544,300 $636,075 $640,650 68 98 E19 61 53 33 $11,581,250 $350,947 $355,000 35 98 E20 93 43 13 $3,650,900 $280,838 $274,900 65 98 E21 116 48 16 $5,593,000 $349,563 $305,000 36 98 TOTAL 2,982 2,495 1,342 $469,619,582 $349,940 $318,500 27 99 Year-to-Date: February 2011 Area Listed Sales $ Volume Avg Price Med Price Avg DOM Avg %List E01 193 102 $53,159,911 $521,176 $499,750 20 102 E02 171 84 $50,299,526 $598,804 $519,469 20 101 E03 277 145 $60,476,746 $417,081 $385,000 27 100 E04 194 107 $31,587,970 $295,215 $338,000 25 99 E05 197 95 $34,292,600 $360,975 $330,000 20 100 E06 142 83 $36,168,780 $435,768 $360,000 24 99 E07 180 99 $36,096,195 $364,608 $350,000 20 99 E08 183 111 $37,778,000 $340,342 $325,000 37 97 E09 244 158 $44,527,884 $281,822 $269,000 37 98 E10 101 65 $27,577,777 $424,273 $420,000 29 98 E11 236 125 $35,588,960 $284,712 $275,000 43 98 E12 54 25 $8,364,400 $334,576 $298,000 26 98 E13 209 115 $40,484,911 $352,043 $330,000 36 98 E14 400 234 $79,984,516 $341,814 $327,250 30 98 E15 379 202 $63,712,050 $315,406 $299,050 26 98 E16 669 318 $76,151,700 $239,471 $222,000 37 98 E17 314 149 $38,500,160 $258,390 $245,500 31 99 E18 11 6 $4,944,300 $824,050 $804,000 64 97 E19 91 45 $15,740,750 $349,794 $337,000 34 98 E20 85 23 $7,222,900 $314,039 $282,500 62 97 E21 106 35 $12,707,059 $363,059 $335,000 54 96 TOTAL 4,436 2,326 $795,367,095 $341,946 $313,000 31 99 TORONTO REAL ESTATE BOARD 3
- 4. SINGLE FAMILY EAST BREAKDOWN - FEBRuARY 2011 East District East District East District 80 Days on Market 80 Sales Active Listing Ratio 60 60 40 40 20 20 0 0 Feb Mar Apr May Jun Jul Aug Sep Oct Nov Dec Jan Feb Fab Mar Apr May Jun Jul Aug Sep Oct Nov Dec Jan Feb 2010 2011 2010 2011 Detached Houses Semi-Detached Houses Area Act Sales Av. Price Med. Price % S-A Av. % List Area Act Sales Av. Price Med. Price % S-A Av. % List E01 18 21 $603,465 $580,000 116.7 101 E01 33 29 $567,882 $535,000 87.9 104 E02 32 25 $711,344 $629,900 78.1 101 E02 26 25 $544,545 $510,000 96.2 102 E03 82 40 $503,091 $452,500 48.8 102 E03 21 17 $491,994 $530,000 81.0 105 E04 46 31 $374,089 $379,900 67.4 100 E04 4 2 $309,000 $309,000 50.0 98 E05 25 15 $554,520 $550,000 60.0 103 E05 4 2 $370,000 $370,000 50.0 101 E06 55 34 $505,800 $424,500 61.8 99 E06 11 6 $335,100 $313,500 54.6 100 E07 27 25 $512,808 $475,000 92.6 101 E07 9 2 $358,044 $358,044 22.2 103 E08 73 35 $495,337 $405,000 48.0 99 E08 3 4 $247,250 $243,500 133.3 96 E09 32 33 $373,972 $365,786 103.1 100 E09 3 4 $328,872 $312,850 133.3 97 E10 33 32 $459,270 $447,500 97.0 99 E10 1 - - - - - E11 27 24 $388,521 $395,000 88.9 98 E11 6 8 $313,438 $288,500 133.3 98 E12 25 8 $325,925 $323,250 32.0 99 E12 - 1 $230,000 $230,000 - 94 E13 82 34 $462,939 $405,806 41.5 98 E13 5 8 $324,988 $334,950 160.0 100 E14 150 88 $380,320 $368,750 58.7 98 E14 17 9 $295,278 $286,000 52.9 98 E15 150 68 $341,780 $326,500 45.3 98 E15 11 1 $286,000 $286,000 9.1 99 E16 366 115 $269,889 $256,000 31.4 98 E16 44 24 $180,533 $179,500 54.6 98 E17 162 56 $292,226 $267,750 34.6 99 E17 8 5 $197,880 $205,900 62.5 98 E18 19 4 $636,075 $640,650 21.1 98 E18 - - - - - - E19 55 25 $373,030 $377,000 45.5 98 E19 - - - - - - E20 85 13 $280,838 $274,900 15.3 98 E20 - - - - - - E21 113 15 $358,800 $315,000 13.3 97 E21 - 1 $211,000 $211,000 - 98 4 TORONTO REAL ESTATE BOARD
- 5. SINGLE FAMILY EAST BREAKDOWN - FEBRuARY 2011 East District Condo Apartment Link Area Act Sales Av. Price Med. Price % S-A Av. % List Area Act Sales Av. Price Med. Price % S-A Av. % List E01 21 7 $391,200 $349,000 33.3 101 E01 - - - - - - E02 13 4 $443,225 $351,000 30.8 99 E02 - - - - - - E03 59 18 $228,906 $176,000 30.5 97 E03 - - - - - - E04 47 20 $162,686 $168,500 42.6 96 E04 - - - - - - E05 67 13 $249,062 $206,000 19.4 97 E05 5 2 $416,500 $416,500 40.0 100 E06 9 2 $221,000 $221,000 22.2 98 E06 - - - - - - E07 50 19 $220,700 $215,000 38.0 97 E07 4 3 $332,667 $347,000 75.0 97 E08 68 17 $155,224 $163,500 25.0 96 E08 - - - - - - E09 114 46 $242,652 $250,500 40.4 97 E09 - - - - - - E10 6 2 $148,500 $148,500 33.3 96 E10 - - - - - - E11 100 16 $170,244 $163,500 16.0 98 E11 4 1 $330,000 $330,000 25.0 100 E12 1 - - - - - E12 - 1 $291,000 $291,000 - 99 E13 16 10 $222,150 $188,500 62.5 97 E13 1 3 $261,267 $265,000 300.0 99 E14 12 7 $253,071 $180,000 58.3 97 E14 4 4 $285,475 $284,000 100.0 100 E15 18 2 $214,000 $214,000 11.1 97 E15 10 4 $267,000 $266,500 40.0 99 E16 41 1 $165,000 $165,000 2.4 92 E16 5 1 $191,500 $191,500 20.0 96 E17 13 3 $159,000 $155,000 23.1 98 E17 14 8 $248,563 $245,250 57.1 98 E18 - - - - - - E18 - - - - - - E19 - - - - - - E19 2 3 $319,333 $325,000 150.0 99 E20 5 - - - - - E20 1 - - - - - E21 1 - - - - - E21 2 - - - - - Condo Townhouse Detached Condo Area Act Sales Av. Price Med. Price % S-A Av. % List Area Act Sales Av. Price Med. Price % S-A Av. % List E01 11 4 $369,325 $348,000 36.4 100 E01 - 1 $515,000 $515,000 - 99 E02 7 - - - - - E02 - - - - - - E03 2 2 $290,000 $290,000 100.0 97 E03 - - - - - - E04 19 4 $343,825 $352,650 21.1 98 E04 - - - - - - E05 12 17 $289,553 $285,000 141.7 99 E05 - - - - - - E06 2 2 $320,995 $320,995 100.0 102 E06 - - - - - - E07 5 6 $308,833 $312,000 120.0 99 E07 - - - - - - E08 12 4 $217,875 $193,000 33.3 97 E08 - - - - - - E09 24 13 $191,600 $205,000 54.2 96 E09 - - - - - - E10 7 3 $266,500 $265,000 42.9 99 E10 - - - - - - E11 30 12 $204,458 $206,250 40.0 96 E11 1 - - - - - E12 6 5 $264,300 $243,000 83.3 99 E12 - - - - - - E13 16 8 $239,950 $251,450 50.0 96 E13 - - - - - - E14 17 4 $235,625 $232,500 23.5 98 E14 - 2 $196,000 $196,000 - 94 E15 15 9 $207,111 $212,000 60.0 99 E15 - - - - - - E16 38 13 $141,446 $150,000 34.2 99 E16 - - - - - - E17 9 3 $167,667 $169,000 33.3 97 E17 - - - - - - E18 - - - - - - E18 - - - - - - E19 1 1 $283,500 $283,500 100.0 98 E19 - - - - - - E20 2 - - - - - E20 - - - - - - E21 - - - - - - E21 - - - - - - TORONTO REAL ESTATE BOARD 5
- 6. SINGLE FAMILY EAST BREAKDOWN - FEBRuARY 2011 East District Co-op Apartment Attached/Row/Townhouse Area Act Sales Av. Price Med. Price % S-A Av. % List Area Act Sales Av. Price Med. Price % S-A Av. % List E01 - - - - - - E01 12 7 $454,728 $405,000 58.3 103 E02 3 - - - - - E02 11 6 $424,967 $432,500 54.6 98 E03 1 1 $191,400 $191,400 100.0 101 E03 3 - - - - - E04 3 - - - - - E04 8 - - - - - E05 - - - - - - E05 2 6 $386,550 $387,250 300.0 106 E06 - - - - - - E06 7 2 $447,000 $447,000 28.6 96 E07 1 - - - - - E07 2 2 $336,500 $336,500 100.0 97 E08 - - - - - - E08 2 1 $340,000 $340,000 50.0 96 E09 - - - - - - E09 1 - - - - - E10 9 - - - - - E10 1 1 $355,000 $355,000 100.0 97 E11 - - - - - - E11 6 11 $338,864 $322,000 183.3 100 E12 - - - - - - E12 - 1 $283,500 $283,500 - 98 E13 - - - - - - E13 12 5 $282,480 $285,500 41.7 99 E14 - - - - - - E14 34 27 $281,063 $280,000 79.4 98 E15 - - - - - - E15 23 21 $267,167 $265,000 91.3 99 E16 - - - - - - E16 13 16 $216,175 $220,000 123.1 98 E17 - - - - - - E17 13 12 $210,408 $210,000 92.3 98 E18 - - - - - - E18 - - - - - - E19 - - - - - - E19 3 4 $253,500 $255,000 133.3 100 E20 - - - - - - E20 - - - - - - E21 - - - - - - E21 - - - - - - West District Current Month: February 2011 Area Active New Sales $ Volume Avg Price Med Price Avg DOM Avg %List W01 128 92 32 $17,322,887 $541,340 $404,000 18 100 W02 69 80 58 $30,563,300 $526,953 $447,500 24 101 W03 121 91 50 $17,562,800 $351,256 $344,500 46 99 W04 146 92 59 $18,477,850 $313,184 $290,000 45 97 W05 277 164 81 $27,132,320 $334,967 $338,000 35 97 W06 255 172 88 $41,140,030 $467,500 $415,000 29 99 W07 90 69 42 $21,047,750 $501,137 $510,500 23 99 W08 181 151 89 $52,360,915 $588,325 $515,000 28 99 W09 147 78 23 $10,648,200 $462,965 $535,500 35 97 W10 230 127 60 $14,957,200 $249,287 $215,000 46 97 W12 180 127 52 $28,389,350 $545,949 $440,250 28 98 W13 181 129 69 $36,758,688 $532,735 $441,000 30 97 W14 81 63 37 $12,922,950 $349,269 $309,000 20 98 W15 348 270 154 $40,429,275 $262,528 $250,425 28 97 W16 101 102 59 $23,595,888 $399,930 $372,000 30 98 W17 - - - - - - - - W18 89 63 19 $5,911,350 $311,124 $325,000 23 97 W19 249 253 126 $54,212,500 $430,258 $411,000 20 99 W20 297 304 159 $63,414,461 $398,833 $390,000 19 99 W21 430 289 141 $103,621,393 $734,904 $550,000 31 97 W22 162 202 129 $49,776,315 $385,863 $372,000 18 99 W23 573 536 356 $125,513,926 $352,567 $341,500 24 98 W24 469 440 208 $79,196,541 $380,753 $367,750 22 98 W25 107 75 50 $25,232,400 $504,648 $369,000 37 98 W26 28 11 2 $1,214,900 $607,450 $607,450 27 98 W27 166 123 87 $33,011,300 $379,440 $365,000 31 98 W28 204 120 56 $27,436,490 $489,937 $446,000 25 98 W29 103 69 47 $14,224,000 $302,638 $285,000 36 98 TOTAL 5,412 4,292 2,333 $976,074,979 $418,378 $365,000 27 98 6 TORONTO REAL ESTATE BOARD
- 7. SINGLE FAMILY WEST BREAKDOWN - FEBRuARY 2011 West District West District West District 80 Days on Market 80 Sales Active Listing Ratio 60 60 40 40 20 20 0 0 Feb Mar Apr May Jun Jul Aug Sep Oct Nov Dec Jan Feb Feb Mar Apr May Jun Jul Aug Sep Oct Nov Dec Jan Feb 2010 2011 2010 2011 Year-to-Date: February 2011 Area Listed Sales $ Volume Avg Price Med Price Avg DOM Avg %List W01 173 55 $29,084,075 $528,801 $404,000 29 100 W02 149 103 $52,387,287 $508,614 $445,000 25 100 W03 172 97 $32,976,300 $339,962 $340,000 43 98 W04 174 97 $29,626,957 $305,433 $295,100 44 97 W05 292 140 $46,892,736 $334,948 $331,250 39 97 W06 318 127 $56,602,520 $445,689 $408,500 31 99 W07 135 73 $35,322,750 $483,873 $458,000 29 99 W08 269 136 $80,784,615 $594,005 $513,500 34 99 W09 143 51 $18,570,200 $364,122 $392,500 50 96 W10 240 115 $28,789,800 $250,346 $217,000 39 97 W12 212 85 $45,689,250 $537,521 $440,000 38 97 W13 237 109 $54,422,188 $499,286 $419,000 36 97 W14 126 66 $22,169,250 $335,898 $320,500 28 97 W15 544 259 $68,009,786 $262,586 $243,000 31 97 W16 163 87 $36,194,788 $416,032 $381,000 31 98 W17 - - - - - - - W18 107 44 $12,751,950 $289,817 $300,250 36 97 W19 402 217 $90,970,100 $419,217 $405,000 24 98 W20 532 277 $113,680,537 $410,399 $395,000 23 98 W21 539 237 $173,881,056 $733,675 $553,000 35 98 W22 331 201 $78,512,448 $390,609 $370,000 21 99 W23 966 577 $201,362,744 $348,982 $338,000 27 98 W24 741 365 $136,119,892 $372,931 $360,000 24 98 W25 133 74 $36,111,300 $487,991 $369,000 42 98 W26 20 3 $2,964,900 $988,300 $735,000 26 95 W27 226 133 $51,059,650 $383,907 $365,000 30 98 W28 208 90 $43,649,959 $485,000 $442,750 28 98 W29 141 94 $29,980,200 $318,938 $287,150 43 98 TOTAL 7,693 3,912 $1,608,567,238 $411,188 $360,000 31 98 TORONTO REAL ESTATE BOARD 7
- 8. SINGLE FAMILY WEST BREAKDOWN - FEBRuARY 2011 West District Detached Houses Semi-Detached Houses Area Act Sales Av. Price Med. Price % S-A Av. % List Area Act Sales Av. Price Med. Price % S-A Av. % List W01 16 6 $1,281,423 $1,220,469 37.5 99 W01 8 6 $505,108 $482,950 75.0 109 W02 18 23 $686,348 $620,000 127.8 100 W02 19 19 $417,163 $430,000 100.0 100 W03 68 27 $355,111 $339,000 39.7 100 W03 31 15 $395,033 $400,000 48.4 99 W04 62 30 $411,743 $399,000 48.4 97 W04 6 4 $343,475 $373,000 66.7 97 W05 58 25 $456,647 $449,900 43.1 97 W05 54 29 $369,276 $330,000 53.7 98 W06 43 31 $536,877 $460,000 72.1 100 W06 6 11 $502,127 $495,000 183.3 99 W07 33 21 $609,293 $568,250 63.6 100 W07 - 1 $393,000 $393,000 - 88 W08 96 52 $814,834 $707,000 54.2 99 W08 1 - - - - - W09 37 17 $565,441 $560,000 46.0 99 W09 4 2 $360,350 $360,350 50.0 97 W10 64 17 $392,347 $395,000 26.6 98 W10 9 2 $346,000 $346,000 22.2 99 W12 106 29 $704,288 $540,000 27.4 98 W12 6 7 $401,714 $395,000 116.7 99 W13 133 37 $731,486 $678,000 27.8 96 W13 8 9 $329,033 $329,000 112.5 97 W14 19 11 $552,168 $582,500 57.9 97 W14 7 5 $417,000 $420,000 71.4 98 W15 15 3 $548,833 $525,500 20.0 96 W15 6 2 $411,250 $411,250 33.3 98 W16 62 24 $524,063 $489,500 38.7 98 W16 11 13 $359,922 $364,900 118.2 99 W17 - - - - - - W17 - - - - - - W18 27 8 $341,581 $362,500 29.6 97 W18 25 8 $294,588 $300,600 32.0 97 W19 79 48 $582,344 $573,750 60.8 99 W19 30 22 $415,932 $412,500 73.3 100 W20 151 57 $535,706 $490,000 37.8 98 W20 37 29 $398,341 $396,000 78.4 99 W21 293 100 $877,998 $719,650 34.1 97 W21 8 10 $366,540 $348,500 125.0 98 W22 100 57 $465,303 $460,000 57.0 98 W22 17 21 $356,200 $360,000 123.5 100 W23 349 204 $396,166 $384,500 58.5 98 W23 101 76 $321,663 $326,763 75.3 98 W24 274 103 $470,725 $476,000 37.6 98 W24 61 43 $340,416 $345,000 70.5 99 W25 58 25 $724,540 $528,400 43.1 97 W25 2 3 $355,333 $375,000 150.0 96 W26 27 2 $607,450 $607,450 7.4 98 W26 - - - - - - W27 140 62 $419,955 $407,000 44.3 99 W27 3 5 $310,600 $340,000 166.7 98 W28 181 40 $546,085 $519,250 22.1 98 W28 9 10 $349,140 $351,000 111.1 100 W29 73 34 $333,206 $312,000 46.6 97 W29 10 6 $240,967 $237,500 60.0 99 Condo Apartment Link Area Act Sales Av. Price Med. Price % S-A Av. % List Area Act Sales Av. Price Med. Price % S-A Av. % List W01 89 15 $298,380 $320,000 16.9 99 W01 - - - - - - W02 8 8 $402,313 $364,500 100.0 98 W02 - - - - - - W03 17 6 $219,050 $224,250 35.3 97 W03 - - - - - - W04 62 19 $171,903 $157,000 30.7 97 W04 - - - - - - W05 103 12 $150,000 $141,000 11.7 96 W05 - - - - - - W06 189 38 $405,961 $326,000 20.1 98 W06 - - - - - - W07 46 14 $297,221 $282,400 30.4 98 W07 - - - - - - W08 73 34 $268,434 $254,220 46.6 99 W08 - - - - - - W09 99 4 $78,750 $72,500 4.0 90 W09 - - - - - - W10 137 27 $174,811 $165,000 19.7 96 W10 - 2 $300,000 $300,000 - 95 W12 50 6 $240,583 $234,000 12.0 98 W12 - - - - - - W13 18 10 $250,100 $244,000 55.6 98 W13 - - - - - - W14 25 15 $220,140 $212,500 60.0 98 W14 1 - - - - - W15 291 129 $249,475 $240,000 44.3 97 W15 1 - - - - - W16 11 2 $296,500 $296,500 18.2 97 W16 - 4 $381,250 $385,000 - 97 W17 - - - - - - W17 - - - - - - W18 18 - - - - - W18 - - - - - - W19 76 22 $252,700 $227,750 29.0 97 W19 2 2 $378,500 $378,500 100.0 103 W20 34 17 $205,300 $198,500 50.0 98 W20 - 1 $372,500 $372,500 - 96 W21 49 4 $301,250 $302,500 8.2 94 W21 2 3 $378,000 $352,000 150.0 102 W22 4 4 $305,125 $309,250 100.0 99 W22 2 3 $355,333 $362,100 150.0 100 W23 58 18 $209,278 $205,000 31.0 97 W23 3 3 $301,033 $288,100 100.0 98 W24 63 14 $183,007 $186,000 22.2 96 W24 - - - - - - W25 23 7 $239,071 $252,500 30.4 98 W25 - 2 $384,450 $384,450 - 102 W26 - - - - - - W26 - - - - - - W27 11 1 $247,000 $247,000 9.1 97 W27 1 - - - - - W28 2 1 $384,990 $384,990 50.0 100 W28 - 1 $350,000 $350,000 - 97 W29 15 - - - - - W29 - - - - - - 8 TORONTO REAL ESTATE BOARD
- 9. SINGLE FAMILY WEST BREAKDOWN - FEBRuARY 2011 West District Condo Townhouse Detached Condo Area Act Sales Av. Price Med. Price % S-A Av. % List Area Act Sales Av. Price Med. Price % S-A Av. % List W01 9 5 $425,600 $398,000 55.6 97 W01 - - - - - - W02 20 5 $432,380 $398,000 25.0 102 W02 - - - - - - W03 2 1 $250,000 $250,000 50.0 97 W03 - - - - - - W04 11 6 $247,583 $243,500 54.6 98 W04 - - - - - - W05 46 12 $201,117 $209,950 26.1 97 W05 - - - - - - W06 10 2 $347,450 $347,450 20.0 100 W06 - - - - - - W07 1 - - - - - W07 - - - - - - W08 8 1 $235,800 $235,800 12.5 99 W08 - - - - - - W09 3 - - - - - W09 - - - - - - W10 19 9 $147,500 $166,500 47.4 96 W10 - - - - - - W12 15 10 $370,950 $362,500 66.7 98 W12 - - - - - - W13 18 8 $276,000 $310,500 44.4 98 W13 - 1 $499,888 $499,888 - 102 W14 25 6 $243,667 $268,000 24.0 100 W14 1 - - - - - W15 35 20 $288,900 $284,500 57.1 98 W15 - - - - - - W16 17 15 $258,227 $245,500 88.2 98 W16 - - - - - - W17 - - - - - - W17 - - - - - - W18 19 2 $253,500 $253,500 10.5 99 W18 - - - - - - W19 55 25 $319,332 $318,000 45.5 98 W19 - - - - - - W20 58 45 $299,138 $287,400 77.6 99 W20 - - - - - - W21 28 10 $386,140 $332,750 35.7 99 W21 - - - - - - W22 1 9 $221,211 $212,000 900.0 99 W22 - - - - - - W23 34 19 $246,579 $248,000 55.9 98 W23 - - - - - - W24 28 21 $230,433 $204,500 75.0 97 W24 3 2 $428,500 $428,500 66.7 99 W25 16 5 $249,200 $260,000 31.3 98 W25 - 1 $322,000 $322,000 - 98 W26 - - - - - - W26 - - - - - - W27 5 15 $248,793 $252,000 300.0 97 W27 - - - - - - W28 1 - - - - - W28 - - - - - - W29 4 4 $179,750 $187,500 100.0 98 W29 - - - - - - Co-op Apartment Attached/Row/Townhouse Area Act Sales Av. Price Med. Price % S-A Av. % List Area Act Sales Av. Price Med. Price % S-A Av. % List W01 1 - - - - - W01 5 - - - - - W02 1 - - - - - W02 3 3 $490,267 $410,700 100.0 114 W03 - - - - - - W03 3 1 $485,000 $485,000 33.3 99 W04 - - - - - - W04 5 - - - - - W05 7 1 $81,500 $81,500 14.3 93 W05 9 2 $356,125 $356,125 22.2 98 W06 3 1 $135,000 $135,000 33.3 100 W06 4 5 $543,400 $526,100 125.0 99 W07 1 - - - - - W07 9 6 $616,417 $623,000 66.7 99 W08 2 1 $142,000 $142,000 50.0 92 W08 1 1 $485,000 $485,000 100.0 98 W09 4 - - - - - W09 - - - - - - W10 - - - - - - W10 1 3 $315,967 $332,900 300.0 98 W12 - - - - - - W12 3 - - - - - W13 - - - - - - W13 4 4 $380,875 $387,500 100.0 96 W14 1 - - - - - W14 2 - - - - - W15 - - - - - - W15 - - - - - - W16 - - - - - - W16 - 1 $348,000 $348,000 - 99 W17 - - - - - - W17 - - - - - - W18 - - - - - - W18 - 1 $315,000 $315,000 - 98 W19 - - - - - - W19 7 7 $401,400 $393,500 100.0 99 W20 - - - - - - W20 17 10 $400,350 $387,750 58.8 98 W21 - - - - - - W21 50 14 $425,414 $423,500 28.0 98 W22 - - - - - - W22 38 35 $328,470 $318,500 92.1 99 W23 1 - - - - - W2 3 27 36 $302,625 $307,450 133.3 99 W24 1 - - - - - W24 39 25 $312,630 $330,000 64.1 99 W25 - 1 $70,000 $70,000 - 88 W25 8 6 $328,750 $325,500 75.0 100 W26 - - - - - - W26 1 - - - - - W27 - - - - - - W27 6 4 $360,550 $346,600 66.7 99 W28 - - - - - - W28 11 4 $341,675 $339,900 36.4 100 W29 - - - - - - W29 1 3 $243,400 $265,500 300.0 101 TORONTO REAL ESTATE BOARD 9
- 10. Central District Current Month: February 2011 Area Active New Sales $ Volume Avg Price Med Price Avg DOM Avg%List C01 875 625 373 $161,723,807 $433,576 $390,400 30 99 C02 178 113 44 $38,131,477 $866,624 $622,000 33 100 C03 124 100 43 $37,312,418 $867,731 $470,000 22 102 C04 144 125 80 $65,879,753 $823,497 $731,250 23 101 C06 56 35 29 $13,957,250 $481,284 $360,000 17 99 C07 167 165 113 $50,981,560 $451,164 $375,000 30 99 C08 277 232 129 $54,063,464 $419,097 $375,000 19 100 C09 64 53 29 $36,943,460 $1,273,912 $848,000 18 98 C10 149 129 102 $82,103,854 $804,940 $526,050 21 100 C11 59 51 33 $22,290,429 $675,468 $705,000 19 102 C12 93 61 27 $45,070,400 $1,669,274 $1,405,000 33 99 C13 98 86 44 $17,785,100 $404,207 $332,000 25 99 C14 230 252 164 $80,951,496 $493,607 $398,000 18 100 C15 181 179 96 $51,091,638 $532,205 $435,000 24 10 TOTAL 2,695 2,206 1,306 $758,286,106 $580,617 $421,750 25 100 Central District Central District 80 Days on Market 80 Sales Active Listing Ratio 60 60 40 40 20 20 0 0 Feb Mar Apr May Jun Jul Aug Sep Oct Nov Dec Jan Feb Feb Mar Apr May Jun Jul Aug Sep Oct Nov Dec Jan Feb 2010 2011 2010 2011 Year-to-Date: February 2011 Area Listed Sales $ Volume Avg Price Med Price Avg DOM Avg%List C01 1,230 603 $253,441,394 $420,301 $370,000 32 99 C02 197 74 $61,556,878 $831,850 $617,500 31 99 C03 172 66 $54,948,868 $832,559 $502,000 25 101 C04 229 115 $95,944,465 $834,300 $700,000 26 100 C06 92 45 $22,042,750 $489,839 $490,000 20 98 C07 291 185 $82,024,910 $443,378 $367,500 30 98 C08 416 204 $85,899,166 $421,074 $375,000 24 100 C09 99 49 $60,649,460 $1,237,744 $870,000 28 99 C10 255 147 $118,212,654 $804,168 $543,000 24 100 C11 98 50 $31,709,053 $634,181 $677,500 26 101 C12 103 40 $63,331,900 $1,583,298 $1,392,500 40 98 C13 146 67 $27,687,700 $413,249 $350,000 27 99 C14 440 296 $143,627,271 $485,227 $386,000 27 100 C15 300 157 $76,350,538 $486,309 $400,000 29 100 TOTAL 4,068 2,098 $1,177,427,007 $561,214 $407,500 29 99 10 TORONTO REAL ESTATE BOARD
- 11. SINGLE FAMILY CENTRAL BREAKDOWN - FEBRuARY 2011 Central District Detached Houses Semi-Detached Houses Area Act Sales Av. Price Med. Price % S-A Av. % List Area Act Sales Av. Price Med. Price % S-A Av.% List C01 7 3 $776,667 $541,000 42.9 114 C01 17 15 $786,320 $650,000 88.2 99 C02 32 9 $890,311 $610,000 28.1 107 C02 27 12 $908,333 $666,000 44.4 102 C03 58 26 $1,154,655 $714,500 44.8 102 C03 18 3 $520,667 $552,000 16.7 105 C04 90 50 $1,097,066 $971,201 55.6 102 C04 1 5 $711,260 $750,000 500.0 110 C06 29 15 $652,233 $600,000 51.7 101 C06 - - - - - - C07 57 31 $707,131 $620,000 54.4 100 C07 5 3 $470,833 $470,000 60.0 100 C08 3 2 $730,000 $730,000 66.7 96 C08 8 5 $571,400 $580,000 62.5 101 C09 25 13 $1,868,692 $2,100,000 52.0 97 C09 3 2 $1,934,500 $1,934,500 66.7 100 C10 49 18 $2,178,141 $1,251,250 36.7 102 C10 8 12 $747,667 $666,000 150.0 102 C11 16 14 $1,046,181 $996,250 87.5 105 C11 1 6 $716,167 $707,500 600.0 105 C12 72 20 $2,059,970 $1,790,000 27.8 98 C12 - - - - - - C13 14 10 $749,810 $680,500 71.4 100 C13 6 6 $367,000 $379,500 100.0 103 C14 52 33 $873,027 $803,000 63.5 104 C14 - - - - - - C15 28 32 $863,397 $755,000 114.3 103 C15 11 12 $463,758 $452,550 109.1 101 Condo Apartment Link Area Act Sales Av. Price Med. Price % S-A Av. % List Area Act Sales Av. Price Med. Price % S-A Av.% List C01 803 327 $405,743 $373,000 40.7 99 C01 - - - - - - C02 94 20 $865,309 $492,450 21.3 96 C02 - - - - - - C03 40 10 $483,040 $448,000 25.0 100 C03 - - - - - - C04 40 20 $289,288 $305,000 50.0 97 C04 - - - - - - C06 27 14 $298,125 $304,000 51.9 97 C06 - - - - - - C07 84 63 $342,000 $319,999 75.0 99 C07 1 3 $497,500 $492,000 300.0 98 C08 246 110 $392,718 $349,500 44.7 100 C08 - - - - - - C09 28 11 $616,724 $540,500 39.3 99 C09 - - - - - - C10 83 64 $453,638 $424,500 77.1 99 C10 - - - - - - C11 40 10 $232,890 $154,000 25.0 97 C11 - - - - - - C12 15 3 $449,667 $493,000 20.0 99 C12 - - - - - - C13 73 26 $283,685 $286,500 35.6 98 C13 - - - - - - C14 149 107 $373,085 $349,000 71.8 99 C14 - - - - - - C15 112 32 $346,498 $294,950 28.6 97 C15 2 1 $469,800 $469,800 50.0 100 Condo Townhouse Detached Condo Area Act Sales Av. Price Med. Price % S-A Av. % List Area Act Sales Av. Price Med. Price % S-A Av.% List C01 35 15 $423,380 $418,000 42.9 101 C01 - - - - - - C02 10 1 $615,000 $615,000 10.0 98 C02 - - - - - - C03 - - - - - - C03 - - - - - - C04 2 2 $249,500 $249,500 100.0 98 C04 - - - - - - C06 - - - - - - C06 - - - - - - C07 16 11 $335,318 $324,500 68.8 97 C07 - 1 $335,000 $335,000 - 96 C08 11 7 $490,426 $468,000 63.6 98 C08 - - - - - - C09 2 1 $556,000 $556,000 50.0 99 C09 - - - - - - C10 8 7 $653,214 $728,500 87.5 99 C10 1 - - - - - C11 2 2 $441,500 $441,500 100.0 98 C11 - - - - - - C12 4 4 $630,500 $621,500 100.0 103 C12 - - - - - - C13 4 2 $354,600 $354,600 50.0 97 C13 - - - - - - C14 18 18 $455,694 $453,444 100.0 100 C14 - - - - - - C15 26 18 $321,517 $318,000 69.2 101 C15 - - - - - - TORONTO REAL ESTATE BOARD 11
- 12. SINGLE FAMILY CENTRAL BREAKDOWN - FEBRuARY 2011 Central District Co-op Apartment Attached/Row/Townhouse Area Act Sales Av. Price Med. Price % S-A Av. % List Area Act Sales Av. Price Med. Price % S-A Av. % List C01 2 - - - - - C01 11 13 $659,269 $655,000 118.2 102 C02 1 - - - - - C02 14 2 $648,750 $648,750 14.3 97 C03 7 4 $224,750 $245,500 57.1 103 C03 1 - - - - - C04 4 1 $180,400 $180,400 25.0 103 C04 7 2 $502,500 $502,500 28.6 98 C06 - - - - - - C06 - - - - - - C07 - - - - - - C07 4 1 $586,000 $586,000 25.0 102 C08 1 - - - - - C08 8 5 $622,900 $670,000 62.5 99 C09 6 1 $460,000 $460,000 16.7 98 C09 - 1 $981,500 $981,500 - 109 C10 - 1 $320,000 $320,000 - 94 C10 - - - - - - C11 - 1 $135,000 $135,000 - 97 C11 - - - - - - C12 - - - - - - C12 2 - - - - - C13 - - - - - - C13 1 - - - - - C14 4 1 $209,000 $209,000 25.0 100 C14 7 5 $762,000 $685,000 71.4 99 C15 2 - - - - - C15 - 1 $552,800 $552,800 - 97 North District Current Month: February 2011 Area Active New Sales $ Volume Avg Price Med Price Avg DOM Avg %List N01 91 89 60 $34,183,200 $569,720 $510,000 22 99 N02 178 163 78 $40,928,848 $524,729 $410,759 23 99 N03 281 291 129 $70,870,468 $549,383 $487,000 21 99 N04 149 157 77 $40,763,400 $529,395 $492,000 18 99 N05 143 155 85 $50,872,350 $598,498 $561,000 17 99 N06 157 126 70 $38,509,600 $550,137 $444,000 25 98 N07 141 150 103 $40,674,560 $394,899 $363,500 22 98 N08 379 336 194 $102,931,354 $530,574 $499,250 21 98 N10 90 93 45 $23,109,500 $513,544 $493,000 17 100 N11 320 342 185 $101,582,116 $549,093 $475,000 21 99 N12 90 73 39 $17,480,300 $448,213 $430,000 34 99 N13 63 23 6 $5,040,750 $840,125 $936,500 96 96 N14 135 45 13 $11,310,750 $870,058 $737,000 83 94 N15 65 36 14 $5,969,400 $426,386 $434,750 39 98 N16 125 72 25 $10,982,400 $439,296 $420,000 37 97 N17 198 87 44 $12,967,100 $294,707 $286,000 45 97 N18 102 65 33 $10,649,500 $322,712 $321,000 32 98 N19 145 72 27 $7,744,397 $286,830 $255,000 63 98 N20 20 8 2 $1,182,000 $591,000 $591,000 87 96 N21 47 13 5 $2,137,000 $427,400 $357,000 130 97 N22 89 38 5 $1,266,000 $253,200 $243,500 77 96 N23 159 66 31 $8,695,900 $280,513 $259,000 56 97 N24 109 45 15 $3,583,980 $238,932 $215,000 75 96 TOTAL 3,276 2,545 1,285 $643,434,873 $500,728 $452,000 27 98 12 TORONTO REAL ESTATE BOARD
- 13. North District North District North District 80 Days on Market 80 Sales Active Listing Ratio 60 60 40 40 20 20 0 0 Feb Mar Apr May Jun Jul Aug Sep Oct Nov Dec Jan Feb Feb Mar Apr May Jun Jul Aug Sep Oct Nov Dec Jan Feb 2010 2011 2010 2011 Year-to-Date: February 2011 Area Listed Sales $ Volume Avg Price Med Price Avg DOM Avg %List N01 156 103 $59,805,261 $580,634 $420,000 26 98 N02 277 140 $71,305,648 $509,326 $406,759 29 98 N03 455 215 $114,978,676 $534,785 $469,000 24 99 N04 247 129 $69,344,780 $537,556 $532,000 26 99 N05 254 131 $76,967,550 $587,539 $560,000 22 99 N06 211 111 $56,861,300 $512,264 $429,000 29 98 N07 264 157 $62,954,010 $400,981 $362,000 26 98 N08 581 329 $177,700,071 $540,122 $493,000 27 98 N10 152 82 $42,626,100 $519,830 $480,250 26 99 N11 536 307 $164,947,746 $537,289 $465,000 23 99 N12 116 72 $32,255,200 $447,989 $427,450 31 98 N13 42 11 $8,940,750 $812,795 $700,000 130 95 N14 89 26 $20,722,750 $797,029 $763,500 73 94 N15 62 25 $11,268,300 $450,732 $429,500 53 97 N16 121 43 $17,902,400 $416,335 $412,000 43 97 N17 193 87 $23,582,950 $271,068 $271,000 45 97 N18 114 63 $19,888,400 $315,689 $312,000 36 98 N19 120 52 $15,357,547 $295,337 $270,700 57 98 N20 14 3 $1,722,000 $574,000 $550,000 62 96 N21 26 6 $2,493,000 $415,500 $356,500 108 97 N22 64 18 $6,247,500 $347,083 $322,500 70 96 N23 125 51 $15,055,400 $295,204 $277,500 65 97 N24 76 21 $4,951,980 $235,809 $215,000 71 96 TOTAL 4,295 2,182 $1,077,879,319 $493,987 $436,750 31 98 TORONTO REAL ESTATE BOARD 13
- 14. SINGLE FAMILY NORTH BREAKDOWN - FEBRuARY 2011 North District Detached Houses Semi-Detached Houses Area Act Sales Av. Price Med. Price % S-A Av. % List Area Act Sales Av. Price Med. Price % S-A Av. % List N01 45 28 $842,343 $703,500 62.2 100 N01 - 2 $457,500 $457,500 - 99 N02 67 35 $787,932 $600,000 52.2 100 N02 1 - - - - - N03 125 58 $782,653 $721,500 46.4 99 N03 11 5 $527,800 $535,000 45.5 101 N04 99 44 $653,823 $615,000 44.4 99 N04 7 10 $420,520 $410,600 142.9 102 N05 123 59 $677,407 $630,000 48.0 99 N05 4 3 $432,333 $435,000 75.0 99 N06 107 41 $670,790 $545,000 38.3 98 N06 7 4 $350,000 $361,250 57.1 99 N07 100 63 $447,556 $414,000 63.0 97 N07 15 14 $314,911 $323,000 93.3 99 N08 261 114 $622,216 $572,250 43.7 98 N08 23 31 $442,082 $438,500 134.8 99 N10 48 26 $599,658 $580,050 54.2 99 N10 2 1 $416,000 $416,000 50.0 107 N11 166 92 $714,926 $625,000 55.4 100 N11 25 23 $438,513 $435,000 92.0 100 N12 72 32 $466,500 $453,250 44.4 98 N12 9 3 $365,333 $370,000 33.3 103 N13 63 6 $840,125 $936,500 9.5 96 N13 - - - - - - N14 121 13 $870,058 $737,000 10.7 94 N14 1 - - - - - N15 59 12 $447,283 $456,250 20.3 97 N15 1 - - - - - N16 115 19 $492,232 $470,000 16.5 97 N16 1 - - - - - N17 189 39 $304,287 $317,000 20.6 97 N17 5 1 $254,000 $254,000 20.0 96 N18 87 23 $363,343 $365,000 26.4 98 N18 3 2 $222,200 $222,200 66.7 98 N19 105 13 $347,806 $320,000 12.4 98 N19 1 1 $249,000 $249,000 100.0 100 N20 20 2 $591,000 $591,000 10.0 96 N20 - - - - - - N21 46 5 $427,400 $357,000 10.9 97 N21 1 - - - - - N22 76 5 $253,200 $243,500 6.6 96 N22 1 - - - - - N23 154 29 $285,203 $277,500 18.8 97 N23 - - - - - - N24 102 14 $243,141 $220,500 13.7 96 N24 1 - - - - - Condo Apartment Link Area Act Sales Av. Price Med. Price % S-A Av. % List Area Act Sales Av. Price Med. Price % S-A Av. % List N01 23 15 $289,733 $298,000 65.2 97 N01 3 2 $491,500 $491,500 66.7 104 N02 95 39 $297,095 $280,000 41.1 98 N02 6 2 $388,000 $388,000 33.3 103 N03 106 36 $283,158 $282,450 34.0 98 N03 3 3 $462,333 $470,000 100.0 102 N04 24 9 $209,956 $195,100 37.5 96 N04 - - - - - - N05 - - - - - - N05 1 1 $426,000 $426,000 100.0 98 N06 19 4 $462,475 $387,500 21.1 98 N06 2 1 $335,000 $335,000 50.0 99 N07 9 3 $199,833 $163,500 33.3 97 N07 1 - - - - - N08 47 14 $311,814 $319,000 29.8 97 N08 2 - - - - - N10 12 3 $266,667 $270,000 25.0 97 N10 22 12 $450,825 $457,950 54.6 103 N11 62 37 $331,094 $321,000 59.7 98 N11 11 5 $436,740 $420,000 45.5 100 N12 - - - - - - N12 - 1 $364,100 $364,100 - 103 N13 - - - - - - N13 - - - - - - N14 11 - - - - - N14 - - - - - - N15 - - - - - - N15 - - - - - - N16 5 2 $240,000 $240,000 40.0 95 N16 2 1 $300,000 $300,000 50.0 100 N17 - 2 $186,950 $186,950 - 100 N17 - - - - - - N18 2 1 $158,000 $158,000 50.0 97 N18 8 3 $261,667 $255,000 37.5 96 N19 6 1 $175,000 $175,000 16.7 97 N19 1 2 $237,450 $237,450 200.0 97 N20 - - - - - - N20 - - - - - - N21 - - - - - - N21 - - - - - - N22 - - - - - - N22 5 - - - - - N23 - - - - - - N23 1 - - - - - N24 - - - - - - N24 - - - - - - 14 TORONTO REAL ESTATE BOARD
- 15. SINGLE FAMILY NORTH BREAKDOWN - FEBRuARY 2011 North District Condo Townhouse Detached Condo Area Act Sales Av. Price Med. Price % S-A Av. % List Area Act Sales Av. Price Med. Price % S-A Av. % List N01 19 12 $338,217 $317,500 63.2 98 N01 - 1 $295,000 $295,000 - 95 N02 7 1 $465,000 $465,000 14.3 99 N02 - - - - - - N03 6 11 $333,682 $320,000 183.3 98 N03 - - - - - - N04 7 3 $371,833 $378,000 42.9 98 N04 - - - - - - N05 1 - - - - - N05 - - - - - - N06 9 4 $454,375 $323,750 44.4 99 N06 - - - - - - N07 4 5 $263,400 $247,500 125.0 99 N07 - - - - - - N08 12 5 $336,200 $335,000 41.7 99 N08 - - - - - - N10 3 2 $261,500 $261,500 66.7 99 N10 - - - - - - N11 20 8 $344,663 $377,400 40.0 98 N11 - - - - - - N12 - - - - - - N12 - - - - - - N13 - - - - - - N13 - - - - - - N14 2 - - - - - N14 - - - - - - N15 - - - - - - N15 - - - - - - N16 1 1 $240,000 $240,000 100.0 96 N16 - - - - - - N17 - - - - - - N17 1 - - - - - N18 - 2 $211,350 $211,350 - 98 N18 - - - - - - N19 9 2 $178,509 $178,509 22.2 97 N19 17 2 $325,500 $325,500 11.8 99 N20 - - - - - - N20 - - - - - - N21 - - - - - - N21 - - - - - - N22 - - - - - - N22 - - - - - - N23 - - - - - - N23 - - - - - - N24 2 - - - - - N24 - - - - - - Co-op Apartment Attached/Row/Townhouse Area Act Sales Av. Price Med. Price % S-A Av. % List Area Act Sales Av. Price Med. Price % S-A Av. % List N01 - - - - - - N01 1 - - - - - N02 - - - - - - N02 2 1 $523,500 $523,500 50.0 101 N03 - - - - - - N03 30 16 $474,149 $471,000 53.3 99 N04 - - - - - - N04 12 11 $434,991 $440,000 91.7 99 N05 - - - - - - N05 14 22 $417,380 $424,400 157.1 100 N06 - - - - - - N06 13 16 $350,300 $343,750 123.1 100 N07 - - - - - - N07 12 18 $341,850 $354,000 150.0 99 N08 - - - - - - N08 34 30 $408,260 $417,250 88.2 100 N10 - - - - - - N10 3 1 $369,500 $369,500 33.3 97 N11 - - - - - - N11 36 20 $426,585 $406,500 55.6 100 N12 - - - - - - N12 9 3 $364,067 $361,200 33.3 102 N13 - - - - - - N13 - - - - - - N14 - - - - - - N14 - - - - - - N15 - - - - - - N15 5 2 $301,000 $301,000 40.0 100 N16 - - - - - - N16 1 2 $305,000 $305,000 200.0 99 N17 - - - - - - N17 3 2 $236,000 $236,000 66.7 99 N18 - - - - - - N18 2 2 $241,250 $241,250 100.0 100 N19 - - - - - - N19 6 6 $219,333 $221,250 100.0 98 N20 - - - - - - N20 - - - - - - N21 - - - - - - N21 - - - - - - N22 - - - - - - N22 7 - - - - - N23 - - - - - - N23 4 2 $212,500 $212,500 50.0 97 N24 - - - - - - N24 4 1 $180,000 $180,000 25.0 96 TORONTO REAL ESTATE BOARD 15
- 16. District Totals New Active Listed Sales $ Volume Avg Price Med Price Avg DOM Avg %List Grand Total 11,538 14,365 N/A 6,266 2,847,415,540 454,423 379,000 27 99 Year N/A N/A 20,492 10,518 4,659,240,659 442,978 370,000 30 98 Annual Summary - Single Family Year *Number of Sales *Average Price Year *Number of Sales *Average Price 1977 20,512 $64,559 2010 1978 21,184 $67,333 January 4,986 $409,058 1979 23,466 $70,830 February 7,291 $431,509 1980 26,017 $75,694 March 10,430 $434,696 1981 29,625 $90,203 April 10,898 $437,600 1982 25,336 $95,496 May 9,470 $446,593 1983 30,046 $101,626 June 8,442 $435,034 1984 31,905 $102,318 July 6,564 $420,482 1985 45,509 $109,094 August 6,232 $411,012 1986 52,919 $138,925 September 6,310 $427,329 1987 43,475 $189,105 October 6,681 $443,729 1988 49,381 $229,635 November 6,510 $438,030 1989 38,960 $273,698 December 4,395 $433,946 1990 26,779 $255,020 1991 38,144 $234,313 Year-to-Date** 86,170 $431,463 1992 41,703 $214,971 1993 38,990 $206,490 2011 1994 44,237 $208,921 January 4,337 $427,037 1995 39,273 $203,028 February 6,266 $454,423 1996 55,779 $198,150 1997 58,014 $211,307 Year-to-Date** 10,518 $442,978 1998 55,344 $216,815 1999 58,957 $228,372 2000 58,343 $243,255 2001 67,612 $251,508 2002 74,759 $275,231 2003 78,898 $293,067 2004 83,501 $315,231 2005 84,145 $335,907 2006 83,084 $351,941 2007 93,193 $376,236 2008 74,552 $379,347 2009 87,308 $395,460 * Due to District revisions, caution should be exercised when undertaking historical comparisons. Please refer to appropriate maps. **This figure may not equal the sum of all monthly totals, as the year-to-date total reflects sales reported in error and deals that have fallen through since January 1st. Single Family Dwelling Sales Comparison Sales Active Listings Average Price 15000 500000 35000 13500 30000 12000 425000 10500 25000 9000 20000 7500 350000 6000 15000 4500 10000 275000 3000 5000 1500 0 0 200000 Feb Mar Apr May Jun Jul Aug Sep Oct Nov Dec Jan Feb Feb Mar Apr May Jun Jul Aug Sep Oct Nov Dec Jan Feb 2001 2002 2003 2004 2005 2006 2007 2008 2009 2010 2011 2010 2011 2010 2011 16 TORONTO REAL ESTATE BOARD