Best Practices for Implementing an External Recruiting Partnership
Sar statsemail13052285100.2 7
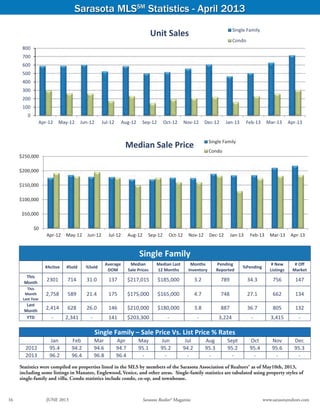
1. Sarasota MLSSM
Statistics - April 2013
Statistics were compiled on properties listed in the MLS by members of the Sarasota Association of Realtors® as of May10th, 2013,
including some listings in Manatee, Englewood, Venice, and other areas. Single-family statistics are tabulated using property styles of
single-family and villa. Condo statistics include condo, co-op, and townhouse.
Single Family – Sale Price Vs. List Price % Rates
Jan Feb Mar Apr May Jun Jul Aug Sept Oct Nov Dec
2012 95.4 94.2 94.6 94.7 95.1 95.2 94.2 95.3 95.2 95.4 95.6 95.3
2013 96.2 96.4 96.8 96.4 ‐ ‐ ‐ ‐ ‐ ‐ ‐ ‐
Single Family
#Active #Sold %Sold
Average
DOM
Median
Sale Prices
Median Last
12 Months
Months
Inventory
Pending
Reported
%Pending
# New
Listings
# Off
Market
This
Month
2301 714 31.0 137 $217,015 $185,000 3.2 789 34.3 756 147
This
Month
Last Year
2,758 589 21.4 175 $175,000 $165,000 4.7 748 27.1 662 134
Last
Month
2,414 628 26.0 146 $210,000 $180,000 3.8 887 36.7 805 132
YTD ‐ 2,341 ‐ 141 $203,300 ‐ ‐ 3,224 ‐ 3,415 ‐
$0
$50,000
$100,000
$150,000
$200,000
$250,000
Apr‐12 May‐12 Jun‐12 Jul‐12 Aug‐12 Sep‐12 Oct‐12 Nov‐12 Dec‐12 Jan‐13 Feb‐13 Mar‐13 Apr‐13
Single Family
Condo
Median Sale Price
Source: Sarasota Association of Realtors®
0
100
200
300
400
500
600
700
800
Apr‐12 May‐12 Jun‐12 Jul‐12 Aug‐12 Sep‐12 Oct‐12 Nov‐12 Dec‐12 Jan‐13 Feb‐13 Mar‐13 Apr‐13
Unit Sales Single Family
Condo
16 JUNE 2013 Sarasota Realtor® Magazine www.sarasotarealtors.com
2. Sarasota MLSSM
Statistics - April 2013
Median sales price is the middle value, where half of the homes sold for more, and half sold for less. Listings sold were closed
transactions during the month. Pending sales are sales where an offer has been accepted during the month, but the sale has not yet
closed. Even though some pending sales never close, pending sales are an indicator of current buyer activity. DOM indicates the average
number of days that sold properties were on the market before a contract was executed.
Condo
#Active #Sold %Sold
Average
DOM
Median Sale
Prices
Median Last
12 Months
Months of
Inventory
Pending
Reported
%Pending
# New
Listings
# Off
Market
This
Month
1,178 303 25.7 166 $185,000 $172,500 3.9 308 26.1 328 106
This
Month
Last Year
1,525 297 19.5 192 $191,750 $165,000 5.1 320 21.0 313 145
Last
Month
1,229 259 21.1 165 $182,000 $174,000 4.7 334 27.2 299 94
YTD ‐ 951 ‐ 167 $170,100 ‐ ‐ 1,276 ‐ 1,350 ‐
0
100
200
300
400
500
600
700
800
900
1000
Apr‐12 May‐12 Jun‐12 Jul‐12 Aug‐12 Sep‐12 Oct‐12 Nov‐12 Dec‐12 Jan‐13 Feb‐13 Mar‐13 Apr‐13
Pending Sales
Single Family
Condo
Sarasota Association of Realtors® MLS
0
500
1,000
1,500
2,000
2,500
3,000
Apr‐12 May‐12 Jun‐12 Jul‐12 Aug‐12 Sep‐12 Oct‐12 Nov‐12 Dec‐12 Jan‐13 Feb‐13 Mar‐13 Apr‐13
Inventory
Single Family
Condo
Condo – Sale Price Vs. List Price % Rates
Jan Feb Mar Apr May Jun Jul Aug Sept Oct Nov Dec
2012 93.1 93.5 94.2 94.3 93.8 93.8 94.6 94.1 94.2 94.4 95.4 94.8
2013 95.4 95.4 95.2 95.4 ‐ ‐ ‐ ‐ ‐ ‐ ‐ ‐
www.sarasotarealtors.com Sarasota Realtor® Magazine JUNE 2013 17
3. TheXtraPages-DigitalVersionOnly
Sarasota Association of Realtors® MLS
0.0
1.0
2.0
3.0
4.0
5.0
6.0
7.0
8.0
9.0
Apr‐12 May‐12 Jun‐12 Jul‐12 Aug‐12 Sep‐12 Oct‐12 Nov‐12 Dec‐12 Jan‐13 Feb‐13 Mar‐13 Apr‐13
Months of Inventory Single Family
Condo
$0
$50,000,000
$100,000,000
$150,000,000
$200,000,000
$250,000,000
$300,000,000
Apr‐12 May‐12 Jun‐12 Jul‐12 Aug‐12 Sep‐12 Oct‐12 Nov‐12 Dec‐12 Jan‐13 Feb‐13 Mar‐13 Apr‐13
Sales Volume
Single Family
Condo
0
50
100
150
200
250
Apr‐12 May‐12 Jun‐12 Jul‐12 Aug‐12 Sep‐12 Oct‐12 Nov‐12 Dec‐12 Jan‐13 Feb‐13 Mar‐13 Apr‐13
Days on Market Single Family
Condo
0
200
400
600
800
1,000
1,200
Apr‐12 May‐12 Jun‐12 Jul‐12 Aug‐12 Sep‐12 Oct‐12 Nov‐12 Dec‐12 Jan‐13 Feb‐13 Mar‐13 Apr‐13
New Listings Single Family
Condo
4. First Quarter 2013 Report
Source: Sarasota Association of Realtors®
0
200
400
600
800
1000
1200
1400
2010‐Q3 2010‐Q4 2011‐Q1 2011‐Q2 2011‐Q3 2011‐Q4 2012‐Q1 2012‐Q2 2012‐Q3 2012‐Q4 2013‐Q1
Single Family Sales ‐ By Quarter REO Short Market
0
100
200
300
400
500
600
700
2010‐Q3 2010‐Q4 2011‐Q1 2011‐Q2 2011‐Q3 2011‐Q4 2012‐Q1 2012‐Q2 2012‐Q3 2012‐Q4 2013‐Q1
Condo Sales ‐ By Quarter REO Short Market
$0
$50,000
$100,000
$150,000
$200,000
$250,000
$300,000
2010‐Q3 2010‐Q4 2011‐Q1 2011‐Q2 2011‐Q3 2011‐Q4 2012‐Q1 2012‐Q2 2012‐Q3 2012‐Q4 2013‐Q1
REO Short MarketSingle Family Median Sale Price
$0
$50,000
$100,000
$150,000
$200,000
$250,000
$300,000
2010‐Q3 2010‐Q4 2011‐Q1 2011‐Q2 2011‐Q3 2011‐Q4 2012‐Q1 2012‐Q2 2012‐Q3 2012‐Q4 2013‐Q1
REO Short MarketCondo Median Sale Price
5. Source: Sarasota Association of Realtors®
0
50
100
150
200
250
300
350
400
450
500
2010‐Q3 2010‐Q4 2011‐Q1 2011‐Q2 2011‐Q3 2011‐Q4 2012‐Q1 2012‐Q2 2012‐Q3 2012‐Q4 2013‐Q1
REO Sales ‐ By Quarter Single Family
Condo
0
50
100
150
200
250
300
350
400
2010‐Q3 2010‐Q4 2011‐Q1 2011‐Q2 2011‐Q3 2011‐Q4 2012‐Q1 2012‐Q2 2012‐Q3 2012‐Q4 2013‐Q1
Short Sales ‐ By Quarter
Single Family
Condo
0
200
400
600
800
1000
1200
1400
2010‐Q3 2010‐Q4 2011‐Q1 2011‐Q2 2011‐Q3 2011‐Q4 2012‐Q1 2012‐Q2 2012‐Q3 2012‐Q4 2013‐Q1
Market Sales ‐ By Quarter
Single Family
Condo