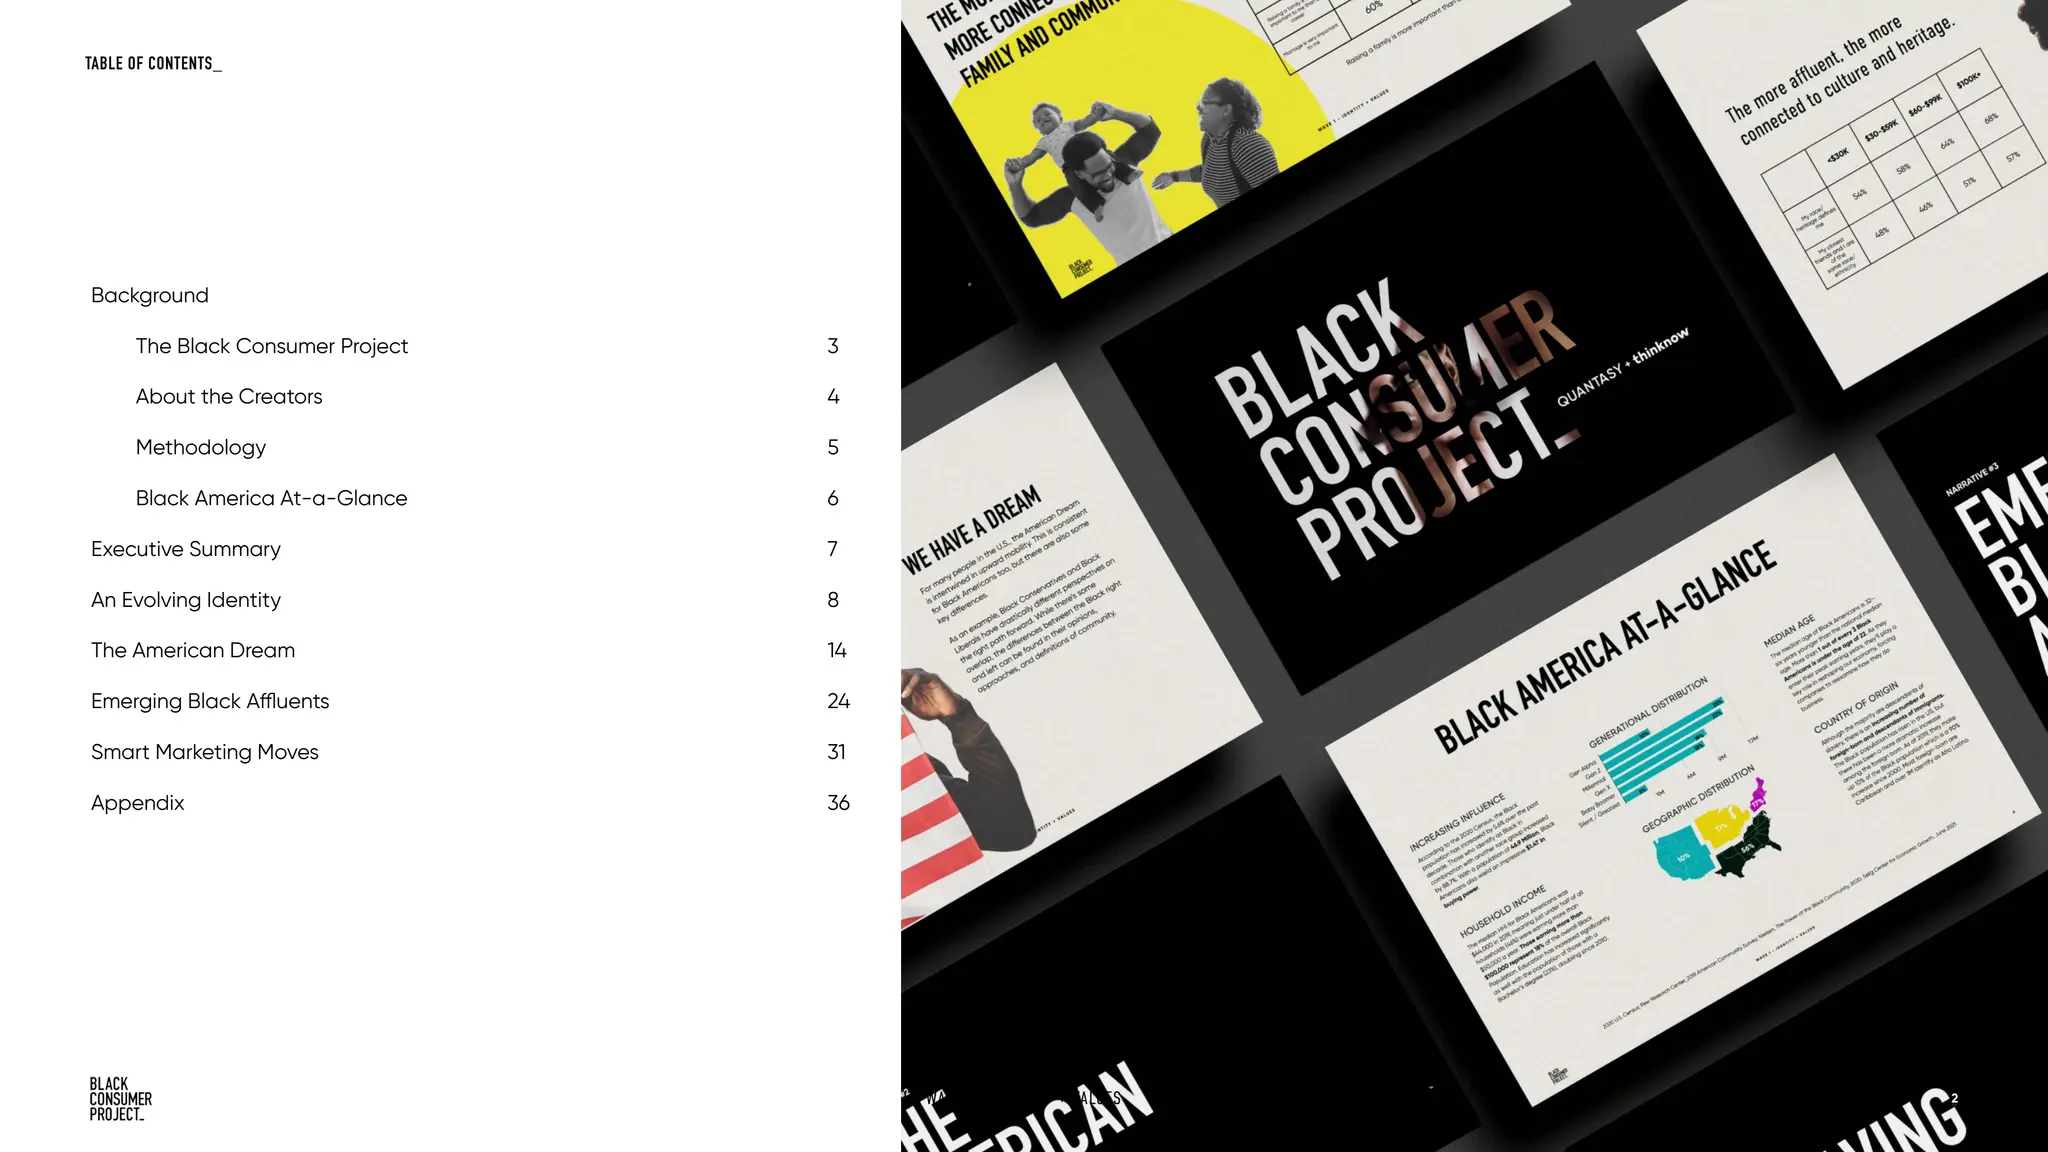
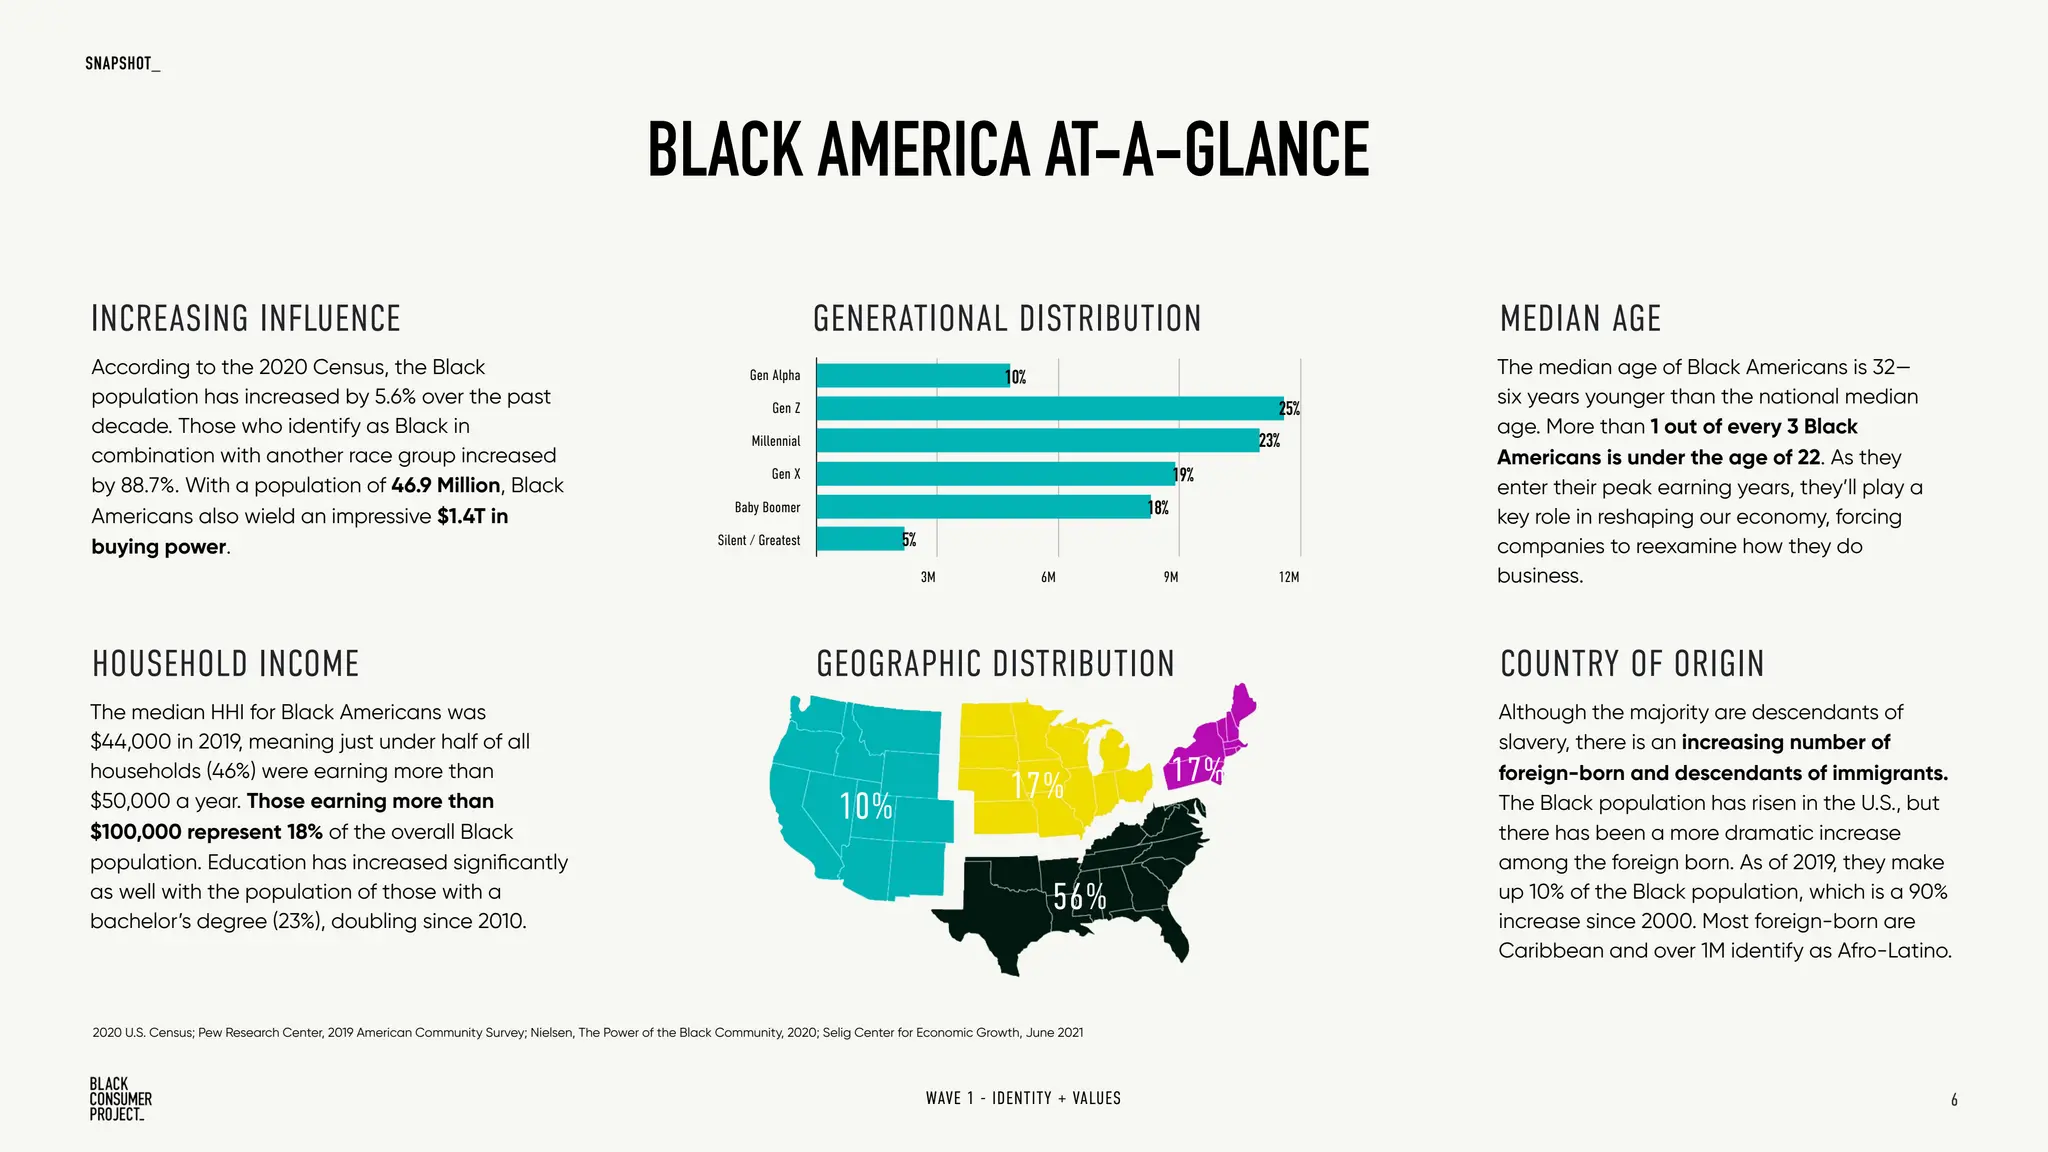
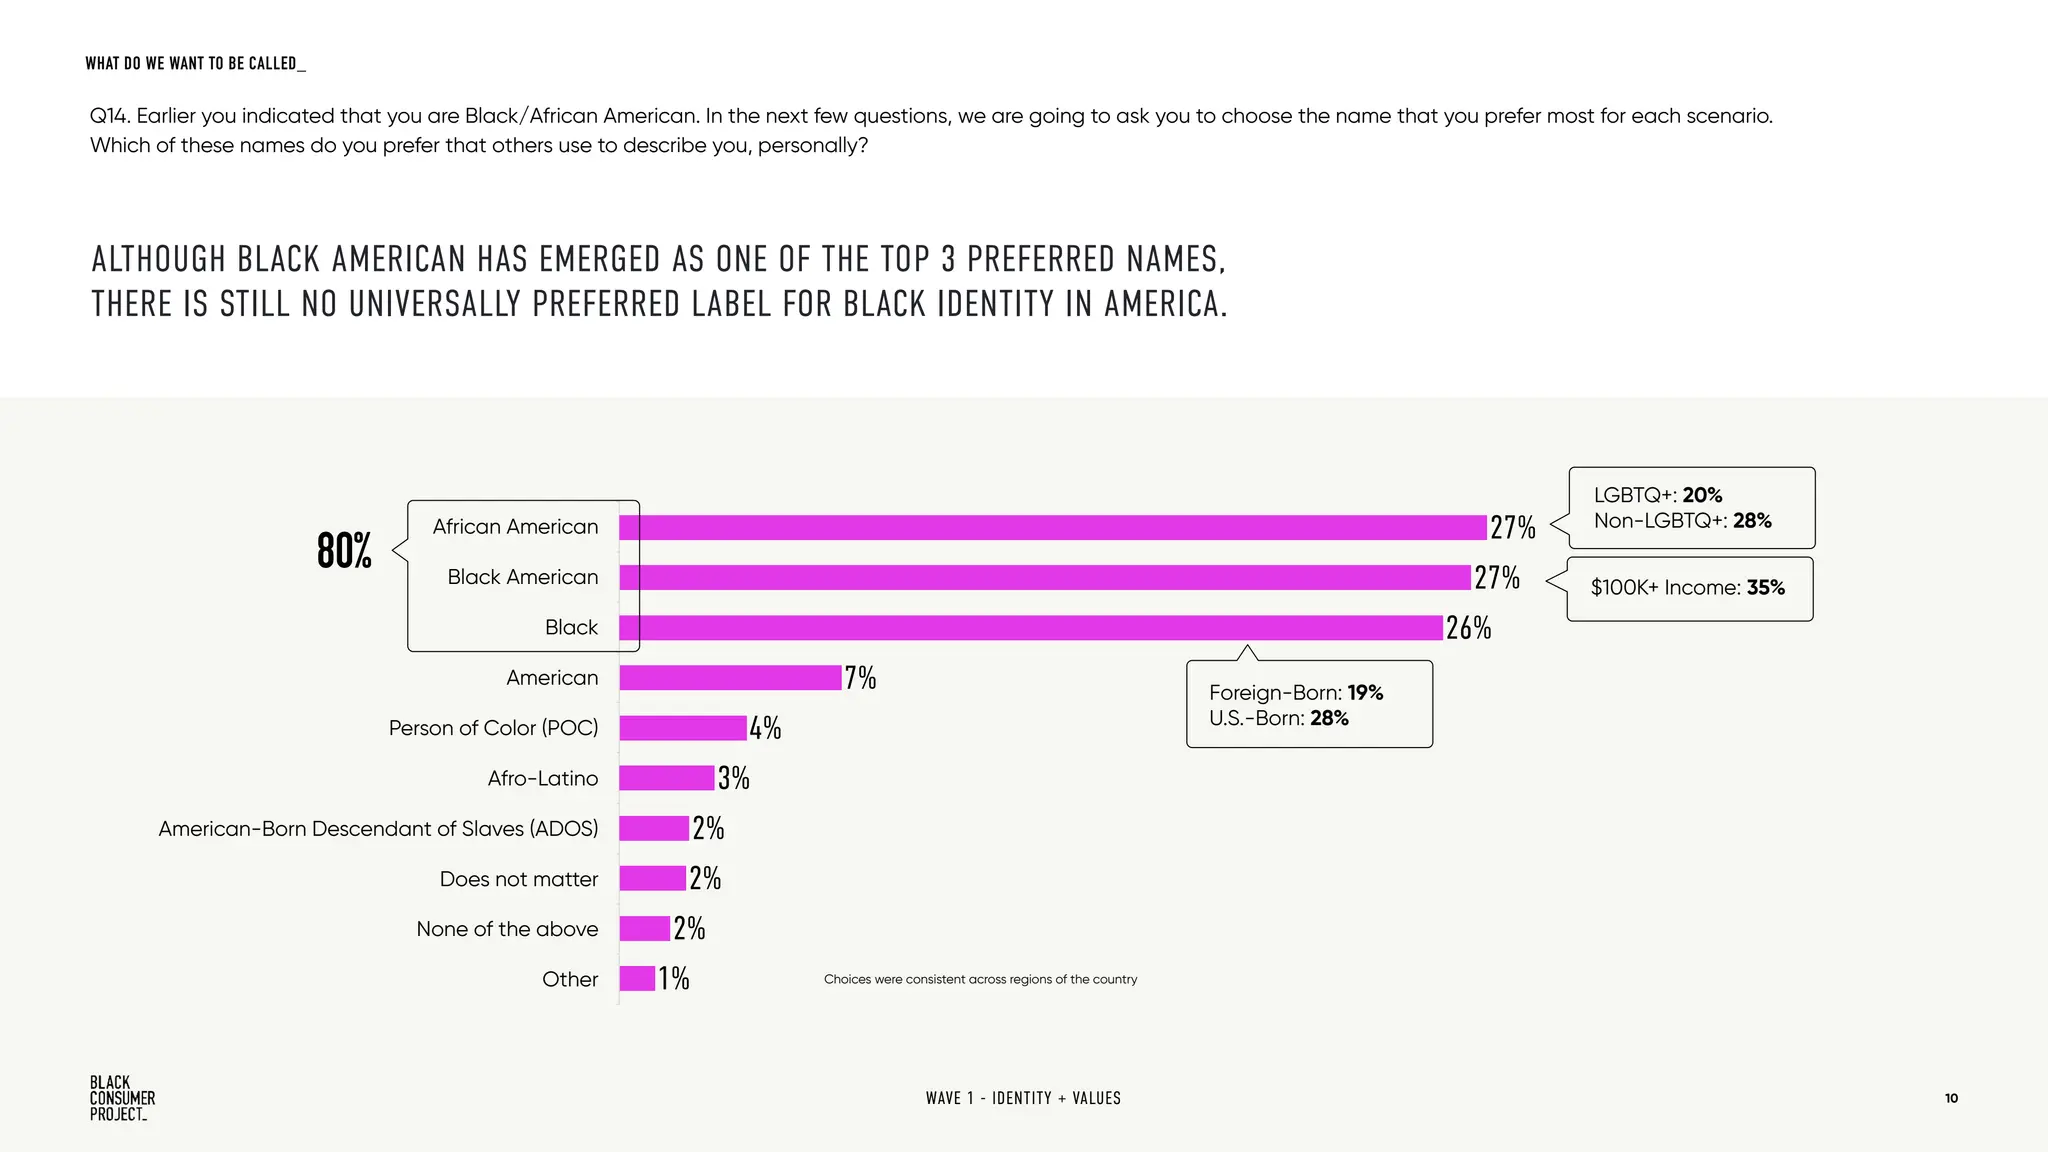
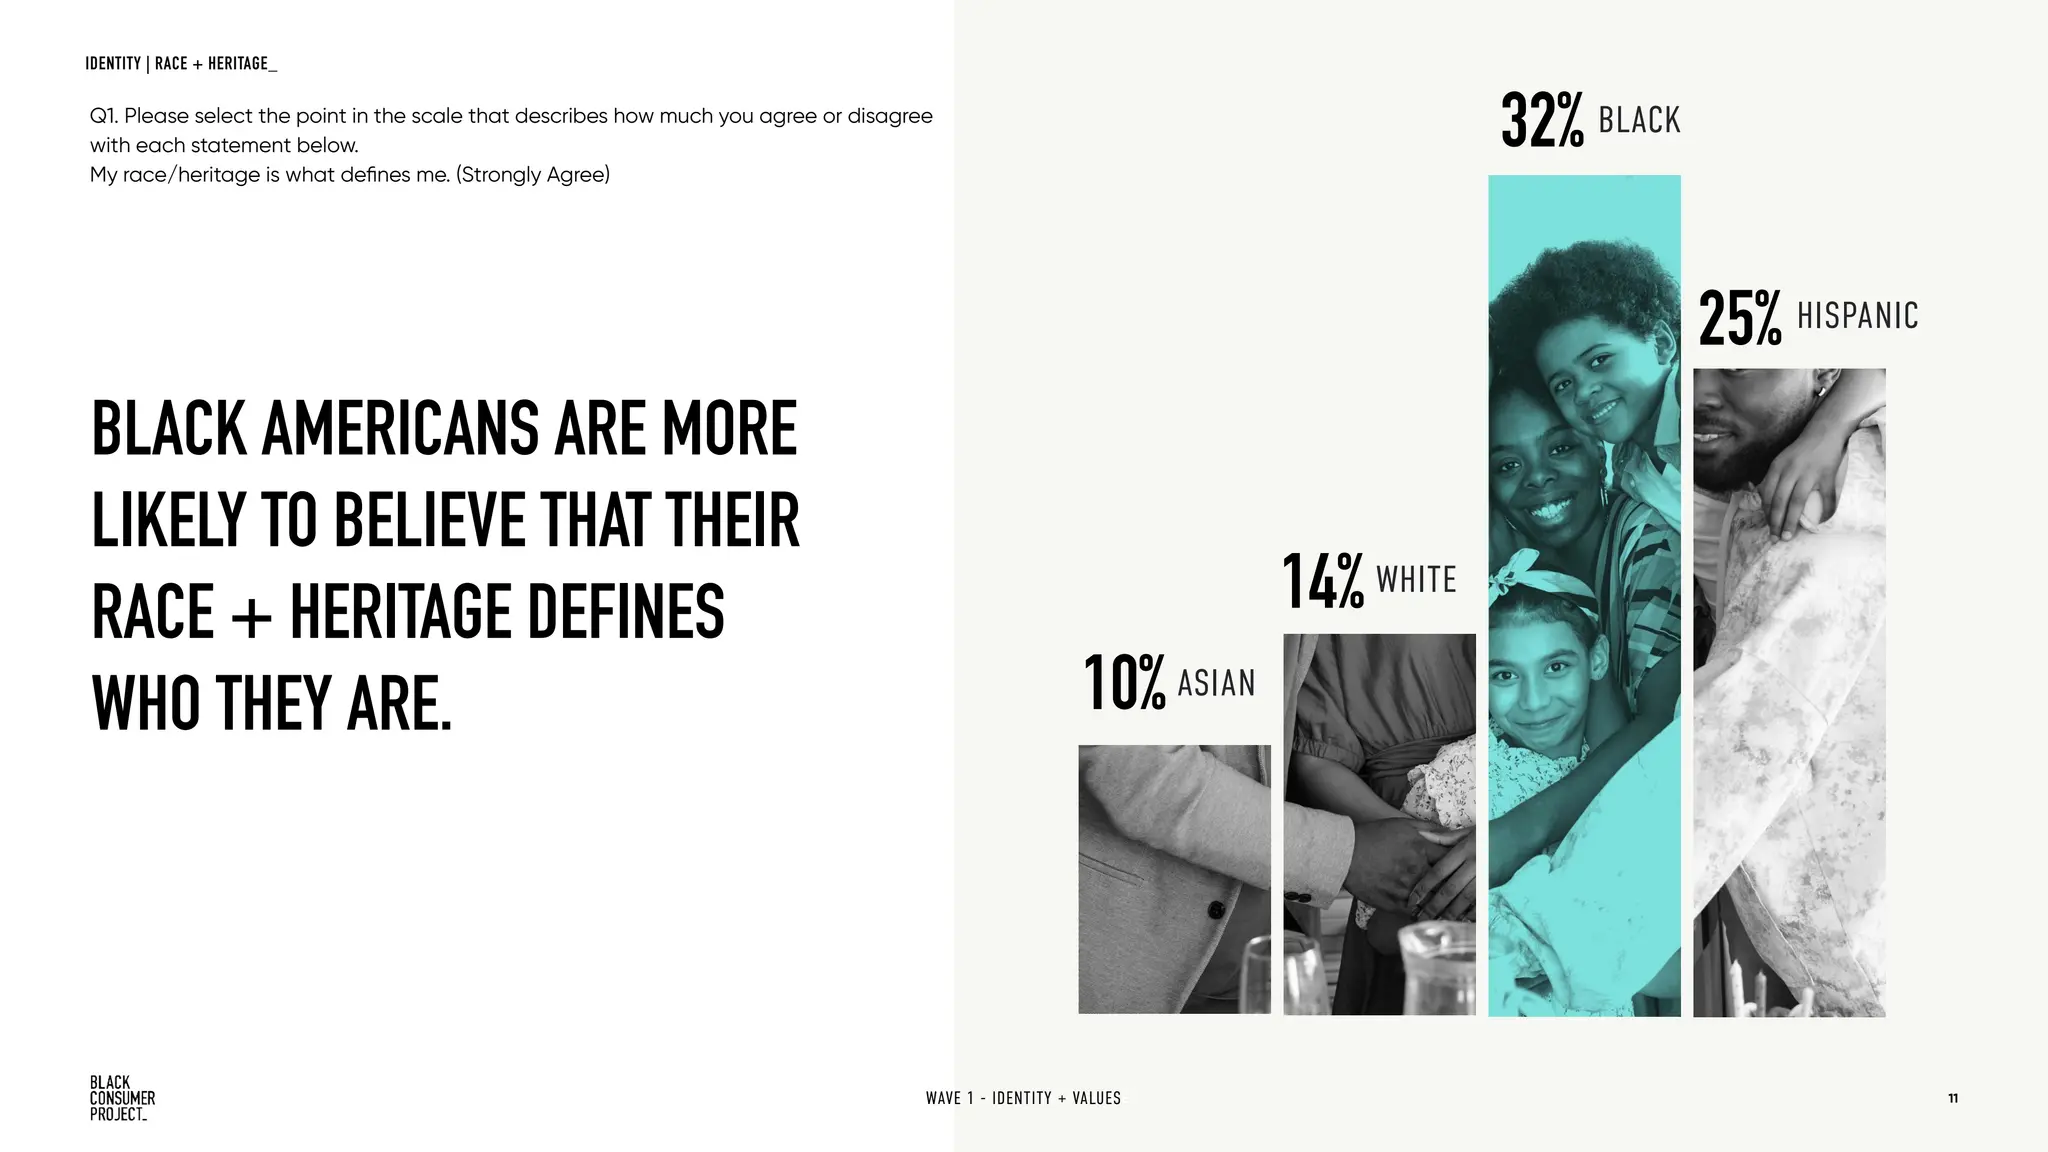
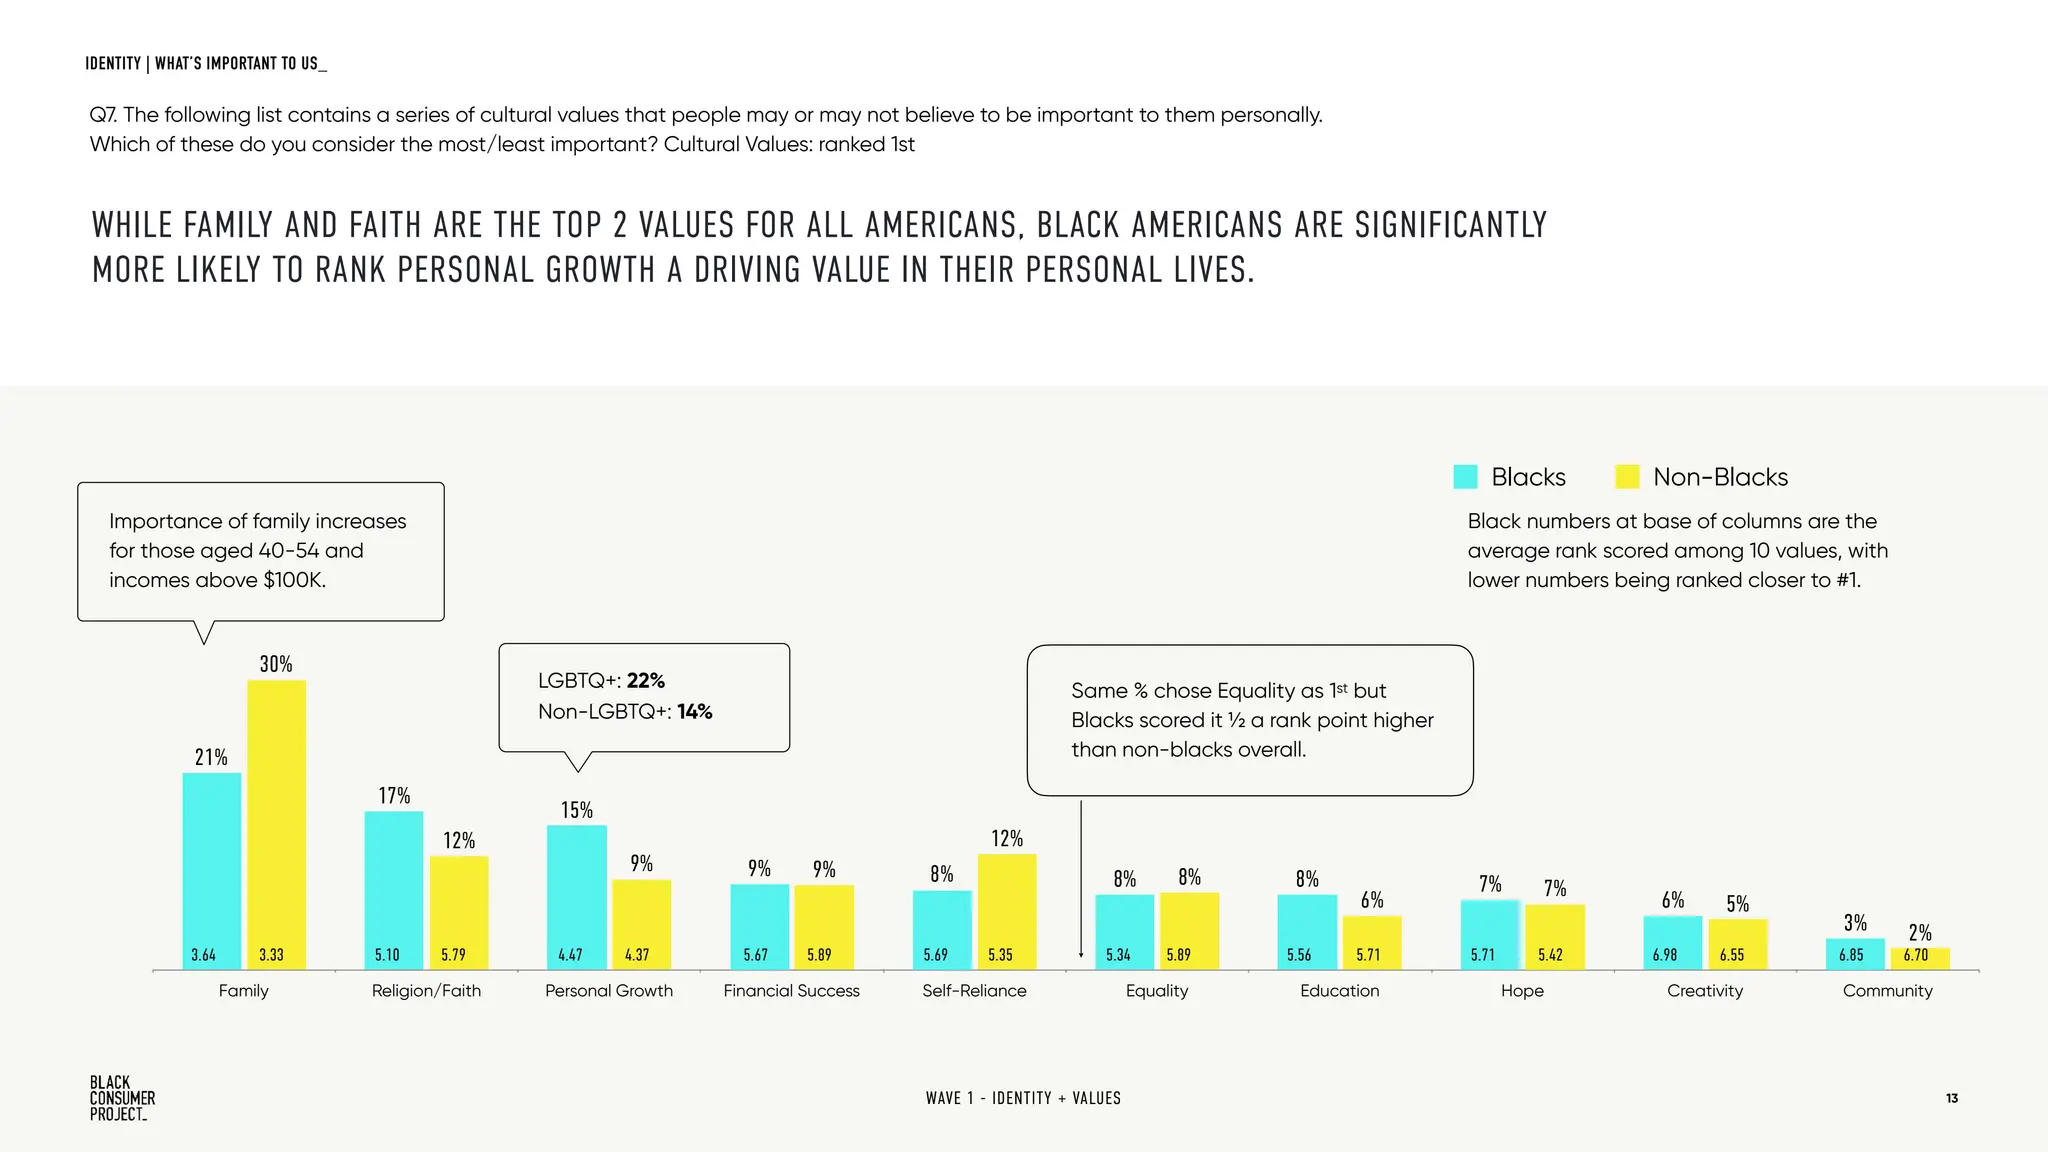
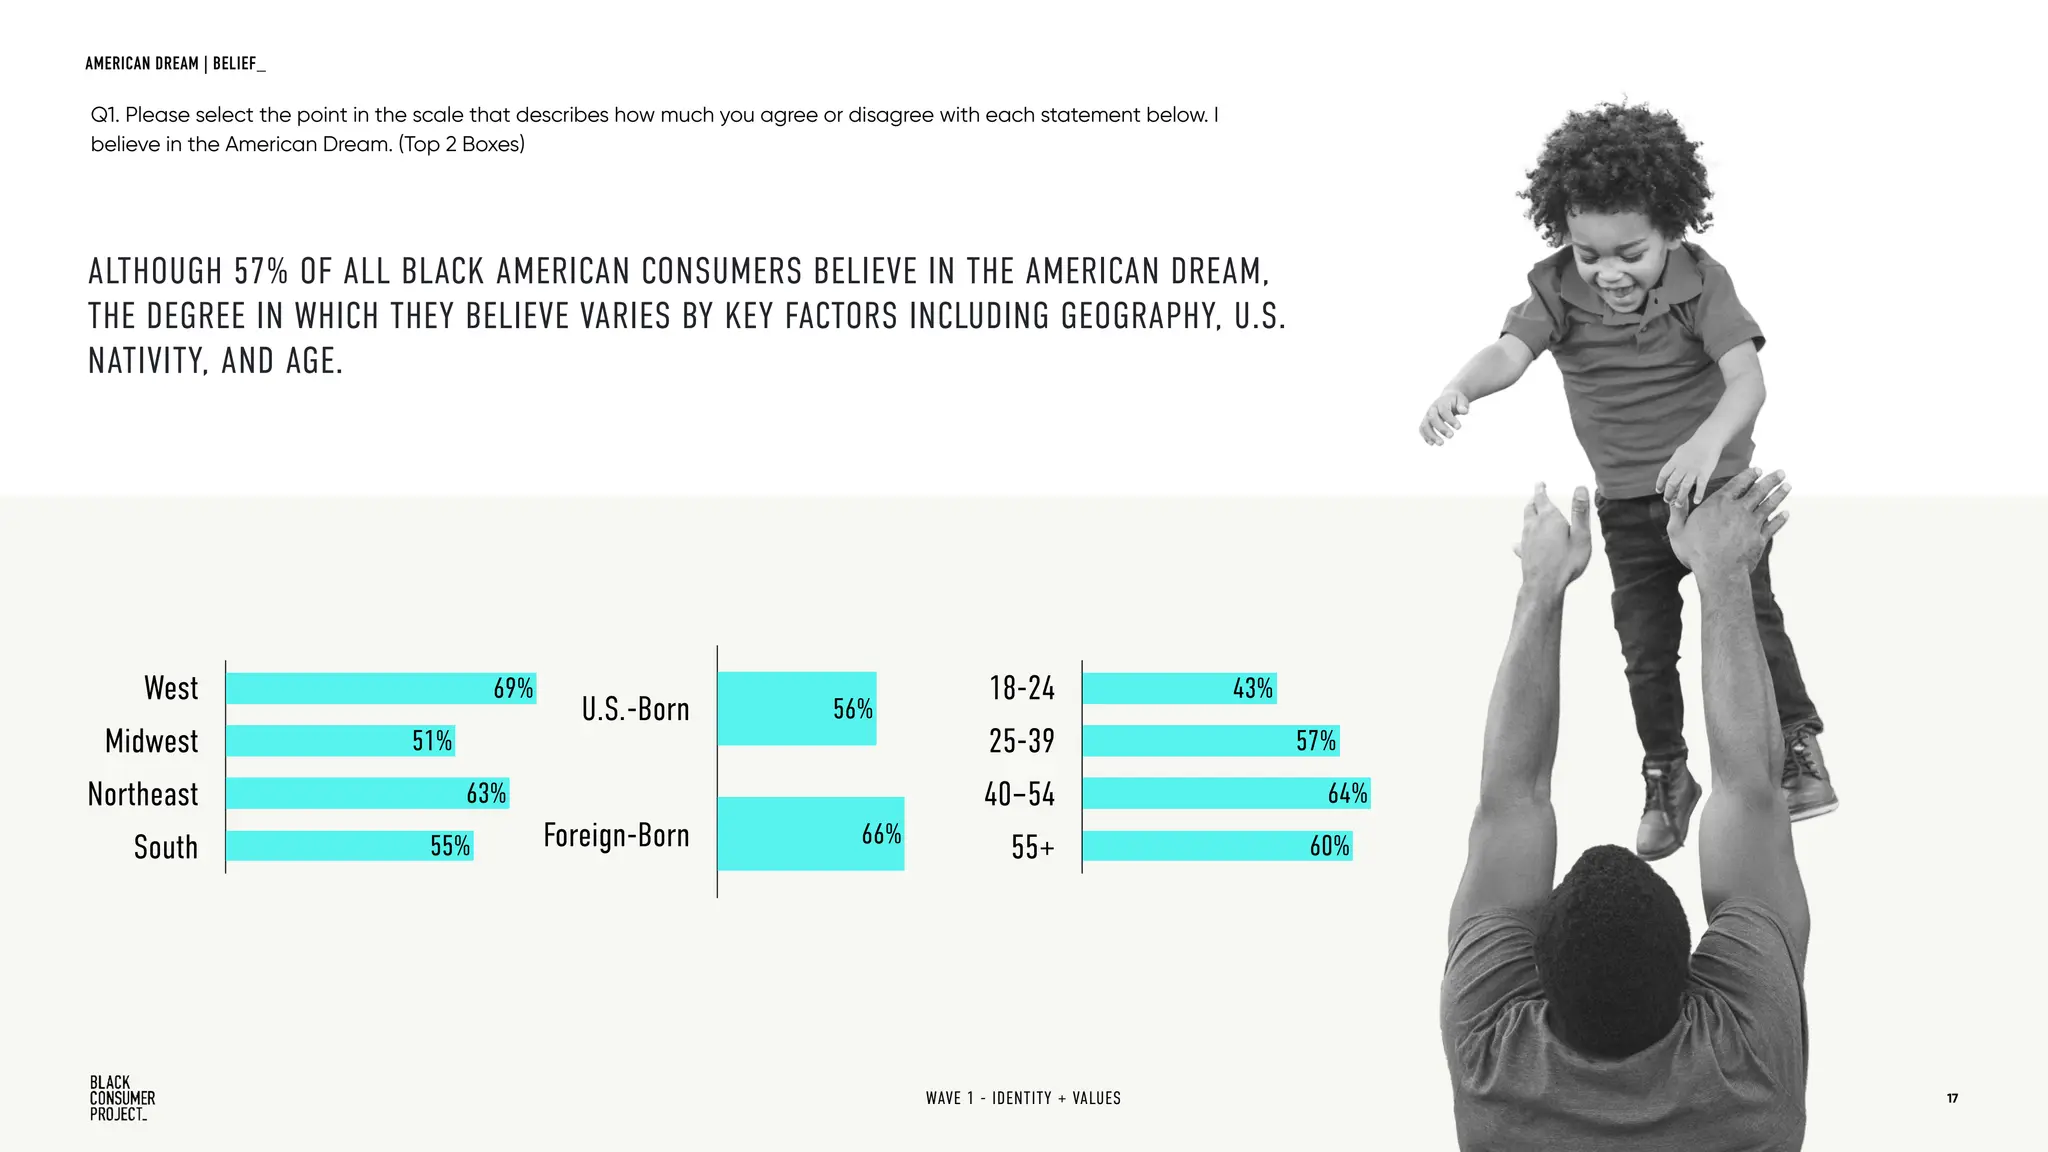
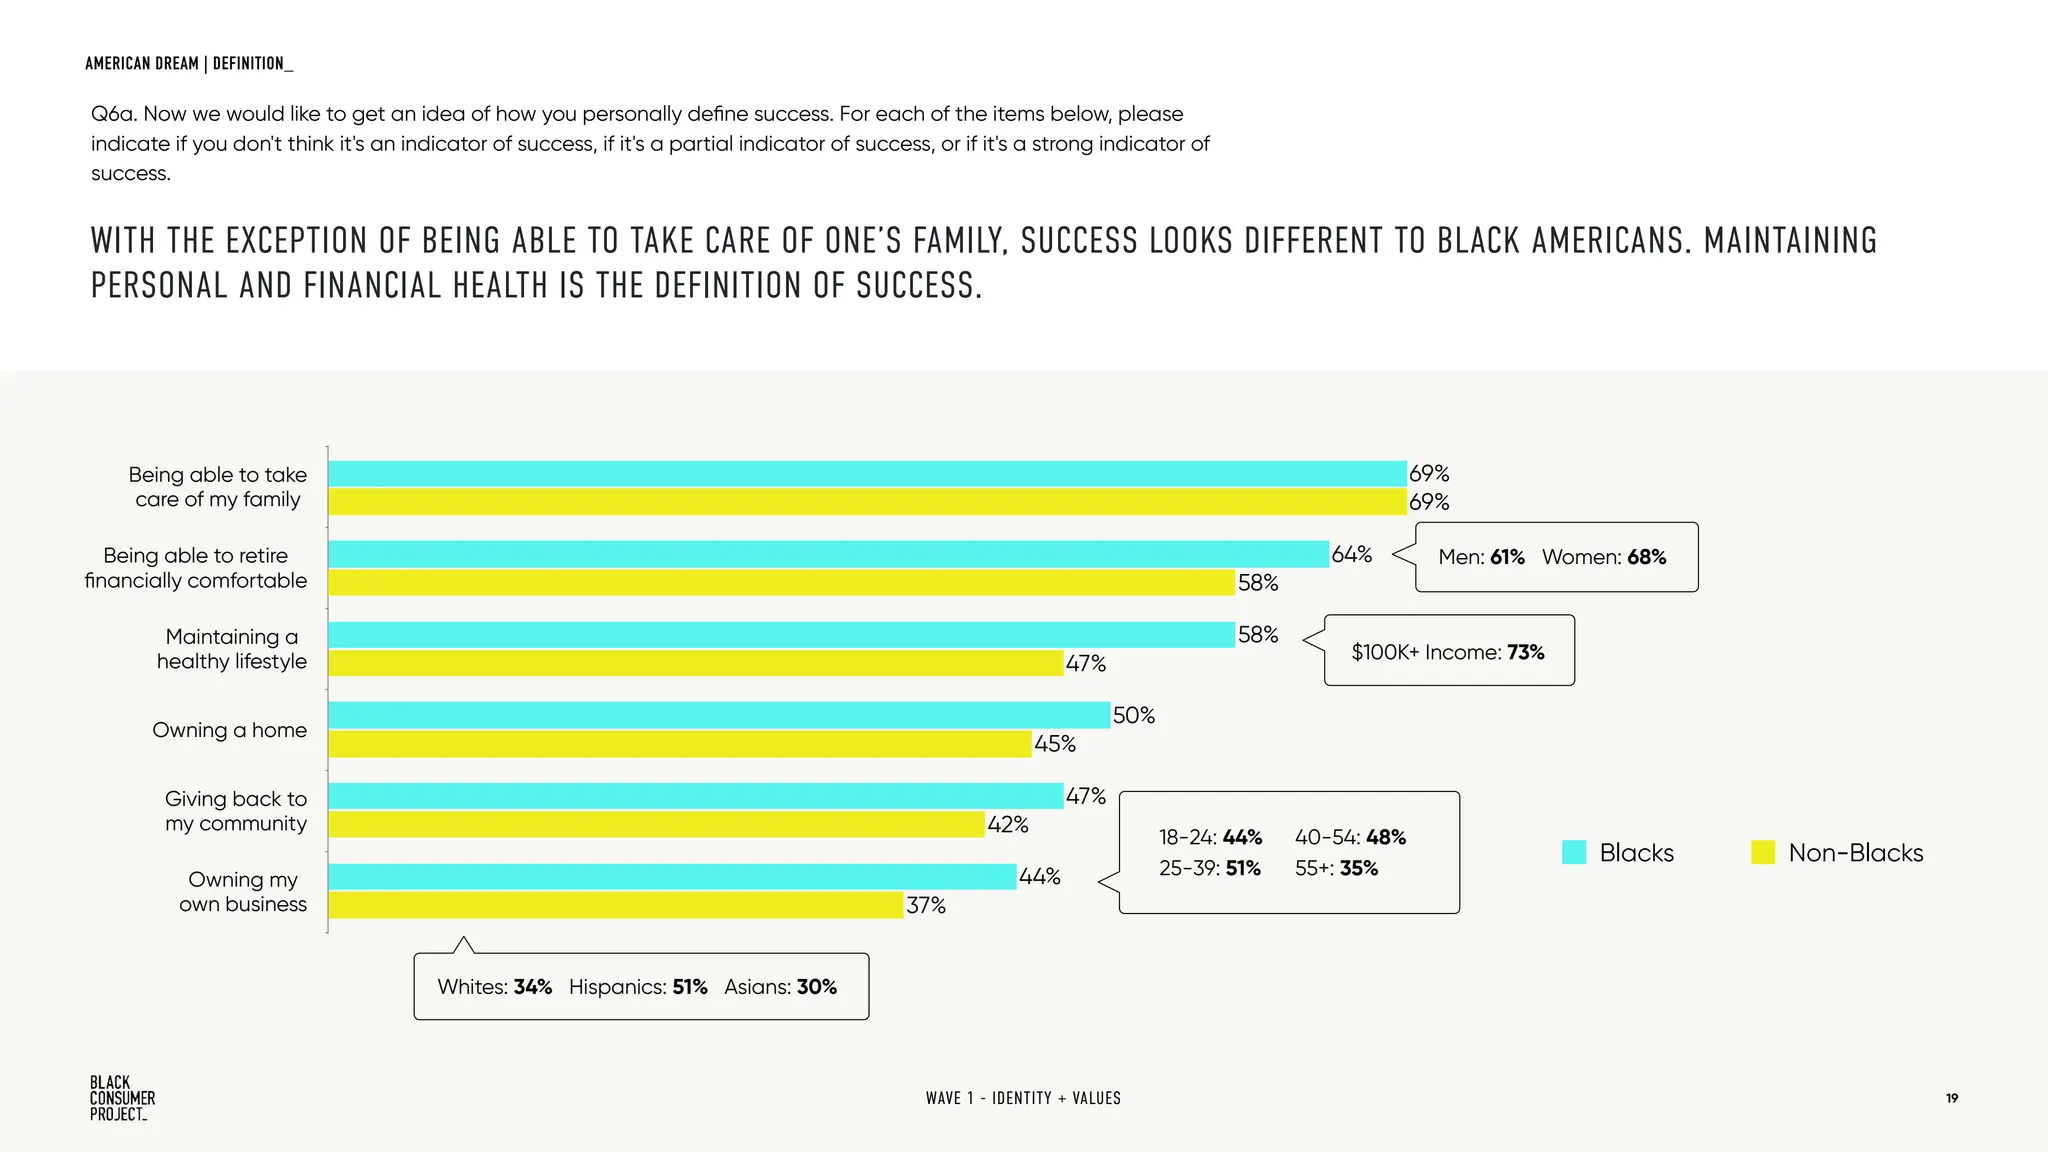
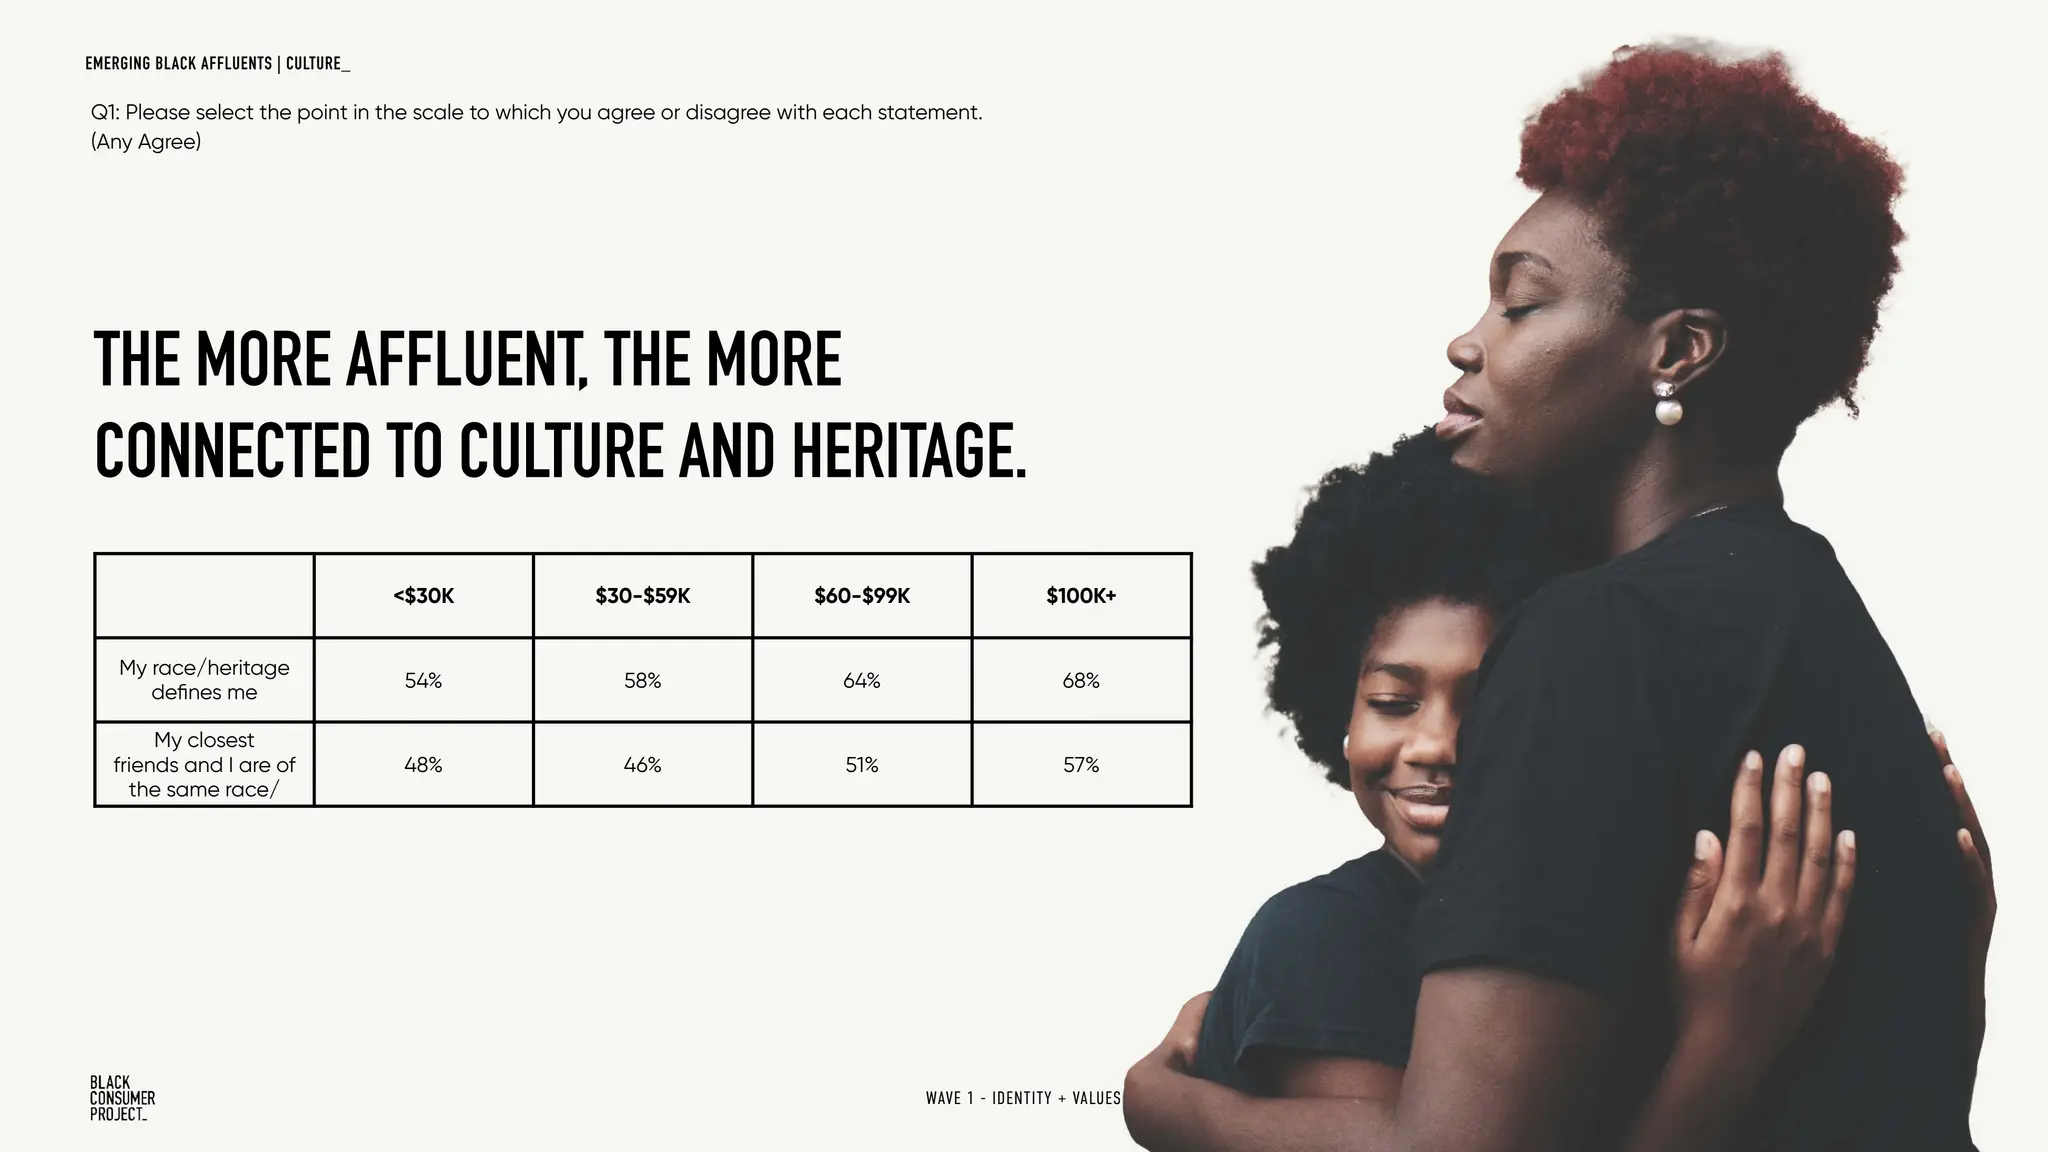
This document provides a summary of key findings from a survey of Black consumers in the United States. Some of the main findings include:
- There is no universally preferred label for Black identity, though "Black American" emerged as one of the top three preferred names.
- Black Americans are more likely than non-Blacks to believe that their race/heritage defines who they are.
- While family and faith are top values for all Americans, Black Americans more highly rank personal growth as a driving value.
- Around 57% of Black Americans believe in the American Dream, though rates vary by age, geography, and nativity.
- Black Americans define success more in terms of maintaining personal and financial health rather
Generative AI Master Class - Generative AI, Unleash Creative Opportunity - Pe...
Black Consumer Project Wave 1 - Identity + Values
1. BLACK CONSUMER SURVEY
B L A C K C O N S U M E R P R OJ E C T 1
WAVE 1 - IDENTITY + VALUES
FALL 2021
2. Background
The Black Consumer Project
About the Creators
Methodology
Black America At-a-Glance
Executive Summary
An Evolving Identity
The American Dream
Emerging Black Affluents
Smart Marketing Moves
Appendix
2
TABLE OF CONTENTS_
WAVE 1 - IDENTITY + VALUES
3
4
5
6
7
8
14
24
31
36
2
3. – is an in-depth multi-wave study of the economic and cultural
contributions of Black Americans. This community has more buying
power than ever, and our goal is to uncover the unique perspectives,
behaviors, and preferences of Black and African American consumers.
PROJECT OVERVIEW_
3
WAVE 1 - IDENTITY + VALUES
Wave 1
The first wave explores core values, personal goals, layers of identity and definitions of success.
4. Quantasy + Associates is a full-service marketing agency that
builds brands by pushing culture in the right direction. We
operate at the intersection of Advertising + Content, Solutions +
Strategies, Platforms + Technology, and Influence + Talent. For
over a decade, our work has driven incremental revenue, equity,
and influence for some of the world’s most iconic brands.
ThinkNow is a technology-driven consumer market research
company that focuses on uncovering Hispanic, Asian, and African
American consumer insights as well as Total Market insights that
require multicultural expertise. We’re focused on culturally diverse
consumers because half the children born in the U.S. each year
are multicultural and this trend will accelerate.
4
ABOUT US_
WAVE 1 - IDENTITY + VALUES 4
5. FIELD DATE
SURVEY METHOD
SCREENING CRITERIA
BASE SIZES
08/02/2021 - 09/10/2021
Online
Blacks n=1,033
Non-Blacks n=500
18+ years of age
Self-identified as Black/
African American
METHODOLOGY_
WAVE 1 - IDENTITY + VALUES 5
6. INCREASING INFLUENCE
GEOGRAPHIC DISTRIBUTION
The median age of Black Americans is 32—
six years younger than the national median
age. More than 1 out of every 3 Black
Americans is under the age of 22. As they
enter their peak earning years, they’ll play a
key role in reshaping our economy, forcing
companies to reexamine how they do
business.
2020 U.S. Census; Pew Research Center, 2019 American Community Survey; Nielsen, The Power of the Black Community, 2020; Selig Center for Economic Growth, June 2021
HOUSEHOLD INCOME
Gen Alpha
Gen Z
Millennial
Gen X
Baby Boomer
Silent / Greatest
6M 9M 12M
3M
10%
25%
23%
19%
18%
5%
10%
56%
17% 17%
GENERATIONAL DISTRIBUTION
Although the majority are descendants of
slavery, there is an increasing number of
foreign-born and descendants of immigrants.
The Black population has risen in the U.S., but
there has been a more dramatic increase
among the foreign born. As of 2019, they make
up 10% of the Black population, which is a 90%
increase since 2000. Most foreign-born are
Caribbean and over 1M identify as Afro-Latino.
MEDIAN AGE
COUNTRY OF ORIGIN
According to the 2020 Census, the Black
population has increased by 5.6% over the past
decade. Those who identify as Black in
combination with another race group increased
by 88.7%. With a population of 46.9 Million, Black
Americans also wield an impressive $1.4T in
buying power.
The median HHI for Black Americans was
$44,000 in 2019, meaning just under half of all
households (46%) were earning more than
$50,000 a year. Those earning more than
$100,000 represent 18% of the overall Black
population. Education has increased significantly
as well with the population of those with a
bachelor’s degree (23%), doubling since 2010.
BLACK AMERICA AT-A-GLANCE
SNAPSHOT_
WAVE 1 - IDENTITY + VALUES 6
7. Still, the story of Black Americans is about more than the long-
lasting impact of inequality on family, financial security and the
future. There’s a more powerful story to be told: a story rooted in a
legacy of Black excellence and fueled by a new generation of
innovators, entrepreneurs and thought-leaders.
Despite centuries of challenges and setbacks, Black Americans
continue to rise, thrive and evolve. From driving culture to blazing
new trails of economic opportunity, their contributions to our
nation continue to be immeasurable.
This report features 4 key chapters:
1. An Evolving Identity
2. The American Dream
3. Emerging Black Affluents
4. Smart Marketing Moves
While most Americans are battling one pandemic, Black Americans
have spent the past year-and-a-half living through three compounding
crises—COVID-19, an economic recession, and the backlash of a
national awakening to systemic inequities and injustices.
EXECUTIVE SUMMARY_
7
WAVE 1 - IDENTITY + VALUES
9. In this section and beyond, we explore the intersections
of race + ethnicity, perceptions and values.
Blackness is not monolithic. The Black experience is
personal and varies by age, income, regionality, and
more. Being Black and African American is as diverse as
the diaspora, but commonalities exist that shape and
connect Black Americans as a community.
THE ME IN WE
W A V E 1 - I D E N T I T Y + V A L U E S 9
EXECUTIVE SUMMARY_
10. African American
Black American
Black
American
Person of Color (POC)
Afro-Latino
American-Born Descendant of Slaves (ADOS)
Does not matter
None of the above
Other 1%
2%
2%
2%
3%
4%
7%
26%
27%
27%
10
80%
Choices were consistent across regions of the country
Foreign-Born: 19%
U.S.-Born: 28%
Q14. Earlier you indicated that you are Black/African American. In the next few questions, we are going to ask you to choose the name that you prefer most for each scenario.
Which of these names do you prefer that others use to describe you, personally?
$100K+ Income: 35%
ALTHOUGH BLACK AMERICAN HAS EMERGED AS ONE OF THE TOP 3 PREFERRED NAMES,
THERE IS STILL NO UNIVERSALLY PREFERRED LABEL FOR BLACK IDENTITY IN AMERICA.
LGBTQ+: 20%
Non-LGBTQ+: 28%
WHAT DO WE WANT TO BE CALLED_
WAVE 1 - IDENTITY + VALUES
11. W A V E 1 - I D E N T I T Y + V A L U E S 11
ASIAN
10%
HISPANIC
25%
WHITE
14%
BLACK
32%
WAVE 1 - IDENTITY + VALUES
IDENTITY | RACE + HERITAGE_
BLACK AMERICANS ARE MORE
LIKELY TO BELIEVE THAT THEIR
RACE + HERITAGE DEFINES
WHO THEY ARE.
Q1. Please select the point in the scale that describes how much you agree or disagree
with each statement below.
My race/heritage is what defines me. (Strongly Agree)
12. 12
Open-minded Risk-taker Successful / High-achieving Assertive Driven / Self-directed Forgiving Confident Ambitious Optimist Anxious Trendsetter
7%
21%
37%
19%
38%
31%
20%
16%
16%
11%
43%
11%
14%
37%
28%
45%
40%
29%
18%
21%
19%
46%
Blacks Non-Blacks
18-24: 33%
25-39: 36%
40-54: 46%
55+: 62%
18-24: 22%
25-39: 32%
40-54: 39%
55+: 48%
LGBTQ+:
23%
$100K+ Income: 20%
Men: 14%
Women: 7%
Whites: 22%
Hispanics: 9%
Asians: 25%
BLACK AMERICANS ARE SIGNIFICANTLY MORE LIKELY TO BELIEVE PEOPLE
SEE THEM AS DRIVEN, CONFIDENT, AND HIGH-ACHIEVING.
Q5. Which of these words do you think other people would use to describe you?
WAVE 1 - IDENTITY + VALUES
IDENTITY | HOW WE BELIEVE WE’RE SEEN_
13. 13
Q7. The following list contains a series of cultural values that people may or may not believe to be important to them personally.
Which of these do you consider the most/least important? Cultural Values: ranked 1st
Family Religion/Faith Personal Growth Financial Success Self-Reliance Equality Education Hope Creativity Community
2%
5%
7%
6%
8%
12%
9%
9%
12%
30%
3%
6%
7%
8%
8%
8%
9%
15%
17%
21%
Blacks Non-Blacks
Importance of family increases
for those aged 40-54 and
incomes above $100K.
5.71
3.64 3.33 5.10 5.79 4.47 4.37 5.67 5.89 5.69 5.35 5.34 5.89 5.56 5.71 5.42 6.98 6.55 6.85 6.70
Same % chose Equality as 1st but
Blacks scored it ½ a rank point higher
than non-blacks overall.
LGBTQ+: 22%
Non-LGBTQ+: 14%
Black numbers at base of columns are the
average rank scored among 10 values, with
lower numbers being ranked closer to #1.
WAVE 1 - IDENTITY + VALUES
IDENTITY | WHAT’S IMPORTANT TO US_
WHILE FAMILY AND FAITH ARE THE TOP 2 VALUES FOR ALL AMERICANS, BLACK AMERICANS ARE SIGNIFICANTLY
MORE LIKELY TO RANK PERSONAL GROWTH A DRIVING VALUE IN THEIR PERSONAL LIVES.
15. 15
For many people in the U.S., the American Dream is intertwined
in upward mobility. This is consistent for Black Americans too,
but there are also some key differences.
As an example, Black conservatives and Black liberals have
drastically different perspectives on the right path forward.
While there’s some overlap, the differences between the Black
right and left can be found in their opinions, approaches, and
definitions of community.
WE HAVE A DREAM
WAVE 1 - IDENTITY + VALUES
THE AMERICAN DREAM | EXECUTIVE SUMMARY_
16. Q1. Please select the point in the scale that describes how much you agree or disagree with
each statement below. I am proud to be an American. (Top 2 Boxes)
AMERICAN PRIDE AND
IDENTITY STRENGTHENS
WITH AGE.
Age 55+
82%
Age 40-54
80%
Age 25-39
59%
Age 18-24
56%
16
WAVE 1 - IDENTITY + VALUES
AMERICAN DREAM | PRIDE_
“I AM PROUD TO BE AN AMERICAN.”
17. 17
U.S.-Born
Foreign-Born 66%
56%
West
Midwest
Northeast
South 55%
63%
51%
69%
Q1. Please select the point in the scale that describes how much you agree or disagree with each statement below. I
believe in the American Dream. (Top 2 Boxes)
ALTHOUGH 57% OF ALL BLACK AMERICAN CONSUMERS BELIEVE IN THE AMERICAN DREAM,
THE DEGREE IN WHICH THEY BELIEVE VARIES BY KEY FACTORS INCLUDING GEOGRAPHY, U.S.
NATIVITY, AND AGE.
WAVE 1 - IDENTITY + VALUES
AMERICAN DREAM | BELIEF_
18-24
25-39
40–54
55+ 60%
64%
57%
43%
18. 18
WITH THE EXCEPTION OF
FREEDOM, BLACK AMERICANS
DEFINE THE AMERICAN DREAM
IN TERMS CONSISTENT WITH
NON-BLACK AMERICANS.
Q1a. For me the American Dream means… (Open-Ended)
Black Americans are significantly
less likely to consider being able
to afford nice things as part
of the American Dream
versus Non-Black.
Black Non-Black
Having goals/achievements 52% 51%
Quality of life 27% 26%
Freedom 18% 27%
Financial stability 17% 20%
Black Americans are
significantly more likely to see
having a fulfilling career that
they enjoy as a marker of the
American Dream vs. Non-Black.
Black Americans making
$100K+ find more importance
in being an American citizen
and living the American way.
Black Americans who identify
as LGBTQ+ are significantly
more likely to believe having
friends and family are a part of
the American Dream.
1. 2. 3. 4.
WAVE 1 - IDENTITY + VALUES
AMERICAN DREAM | DEFINITION_
19. Q6a. Now we would like to get an idea of how you personally define success. For each of the items below, please
indicate if you don't think it's an indicator of success, if it's a partial indicator of success, or if it's a strong indicator of
success.
WITH THE EXCEPTION OF BEING ABLE TO TAKE CARE OF ONE’S FAMILY, SUCCESS LOOKS DIFFERENT TO BLACK AMERICANS. MAINTAINING
PERSONAL AND FINANCIAL HEALTH IS THE DEFINITION OF SUCCESS.
Being able to take
care of my family
Being able to retire
financially comfortable
Maintaining a
healthy lifestyle
Owning a home
Giving back to
my community
Owning my
own business 37%
42%
45%
47%
58%
69%
44%
47%
50%
58%
64%
69%
Blacks Non-Blacks
Men: 61% Women: 68%
$100K+ Income: 73%
18-24: 44%
25-39: 51%
Whites: 34% Hispanics: 51% Asians: 30%
19
WAVE 1 - IDENTITY + VALUES
AMERICAN DREAM | DEFINITION_
40-54: 48%
55+: 35%
20. Q6b. Now we would like to know about your goals. For each item below, please indicate if it is a future goal.
PERSONAL GOALS ARE CLOSELY TIED TO
BOTH VALUES AND MEASURES OF SUCCESS.
20
Owning a Business Maintaining a Healthy Lifestyle Being Passionate About Career Contributing to my community
Black: 39%
Non-Black: 30%
Black: 44%
Non-Black: 35%
Black: 48%
Non-Black: 42%
Black: 39%
Non-Black: 24%
39% 44%
48%
39%
WAVE 1 - IDENTITY + VALUES
AMERICAN DREAM | PERSONAL GOALS_
21. 21
Q8: How satisfied are you with the direction that the U.S. is going?
Black Men Women White
Satisfied 48% 53% 43% 42%
Not Satisfied 28% 28% 28% 41%
IN GENERAL, BLACK AMERICANS ARE MORE SATISFIED WITH
THE DIRECTION THAT THE COUNTRY IS HEADING IN COMPARED
TO THEIR WHITE PEERS. BLACK MEN ARE SIGNIFICANTLY
MORE LIKELY TO BE SATISFIED THAN BLACK WOMEN.
21
WAVE 1 - IDENTITY + VALUES
AMERICAN DREAM | USA SENTIMENT_
22. 22
BLACK CONSERVATIVES ARE MORE LIKELY TO BELIEVE COLLEGE IS OVERRATED OR NOT
CRITICAL TO SUCCESS. CONVERSELY, BLACK LIBERALS ARE MORE LIKELY TO BELIEVE COLLEGE
IS IMPORTANT AND AIDS ACHIEVING SUCCESS.
18-24 25-39 40-54 55+^ Conservative Liberal
Not Critical
A college education is important
but not absolutely necessary to be
successful
50% 43% 39% 31% 43% 37%
Critical
It’s impossible to succeed in life
without a college education
50% 58% 61% 70% 58% 64%
Q13. With which of these statements do you agree with most in regard to having a college education? (Any Agree)
Younger Black people (18-39) are more likely to believe college is not necessary VS. older Black people (40-55+) who think it is.
22
WAVE 1 - IDENTITY + VALUES
AMERICAN DREAM | DEFINITION_
23. D7. Which of the following best describes your political leanings?
BLACK PEOPLE TEND TO LEAN MORE LIBERAL, BUT CONSERVATISM
IS GROWING AMONG YOUNGER GENERATIONS.
Black Non-Black 18-24 25-39 40-54 55+^
Conservative (Net) 45% 54% 46% 50% 48% 36%
Very Conservative 14% 17% 9% 19% 19% 7%
Somewhat Conservative 31% 38% 37% 32% 28% 30%
Somewhat Liberal 35% 28% 32% 29% 33% 44%
Very Liberal 21% 17% 22% 21% 20% 22%
Liberal (Net) 55% 46% 54% 50% 53% 64%
23
WAVE 1 - IDENTITY + VALUES
AMERICAN DREAM | POLITICAL IDENTITY_
It’s important to note that identifying as conservative
does not directly equate to political party affiliation.
25. 25
25
Expensive cars, designer bags, fancy jewelry - it's often assumed
that affluent Black Americans engage in conspicuous consumption.
However, we’re learning quite the opposite: Black affluents make
consumer choices that are more often rooted in family, connected
to culture and focused on long-term financial growth.
Please note that our salary data throughout this presentation
points to household income, but individual income levels of
$100,000 and above represent the top 9% of Black Americans and
18% of Black households.
CONSUMERISM AND CULTURE
WAVE 1 - IDENTITY + VALUES
EMERGING BLACK AFFLUENTS | EXECUTIVE SUMMARY_
26. MOST EMERGING BLACK AFFLUENTS HAVE ALREADY ACCOMPLISHED THE
PERSONAL GOALS THAT ALL BLACK AMERICANS ARE STRIVING TOWARDS.
<$30K $30-59K $60-99K $100K+ <$30K $30-59K $60-99K $100K+
Maintaining a healthy
lifestyle 28% 43% 50% 62% 55% 45% 41% 30%
Making a positive
contribution to my
community
21% 30% 46% 58% 52% 45% 33% 25%
Being passionate about
what you do for a living 32% 44% 60% 60% 47% 36% 22% 25%
Owning a home 22% 45% 58% 75% 56% 38% 25% 17%
Giving back to community 24% 37% 47% 55% 49% 41% 28% 28%
Being happy with oneself
regardless of what you
have or do
45% 54% 64% 72% 42% 32% 24% 20%
Already accomplished Future goal
Q6b. Now we would like to know about your goals. For each item below, please indicate if it is a future goal, not a goal for you, or if you have already accomplished this goal.
26
WAVE 1 - IDENTITY + VALUES
EMERGING BLACK AFFLUENTS | PERSONAL GOALS_
27. Blacks Non-Blacks
53%
43%
Blacks Non-Blacks
54%
61%
Blacks Non-Blacks
39%
41%
Satisfaction with Current Life Quality of Life vs. Community Optimistic About the Future
<30K: 31%
$30-59K: 45%
$60-99K: 60%
$100K+: 72%
<30K: 32%
$30-59K: 41%
$60-99K: 52%
$100K+: 66%
<30K: 51%
$30-59K: 66%
$60-99K: 70%
$100K+: 84%
Q2. How satisfied are you with where you are currently in your life?
Q3b. In terms of "quality of life," how do you see yourself compared to others in your community?
Q4. How optimistic do you feel about your future?
West: 71%
Midwest: 59%
Northeast: 62%
South: 60%
Whites: 51%
Hispanics: 63%
Asians: 43%
Whites: 37%
Hispanics: 51%
Asians: 40%
Whites: 51%
Hispanics: 66%
Asians: 53%
BLACK EMERGING AFFLUENTS ARE SIGNIFICANTLY MORE SATISFIED
WITH THEIR LIVES AND MORE OPTIMISTIC ABOUT THEIR FUTURES.
Top 2 Box: I am much better / Somewhat better off Top 2 Box: Extremely Optimistic / Optimistic
Top 2 Box: Extremely Satisfied / Satisfied
27
WAVE 1 - IDENTITY + VALUES
EMERGING BLACK AFFLUENTS | SATISFACTION + OPTIMISM_
28. This is Q1. Please select the point in the scale that describes how much you agree or disagree with each statement below.
“My parents and siblings play a big role in my important decisions”
28
This is especially true for Black Emerging Affluents.
52%
50%
68%
50%
52%
42%
White Black Americans
WAVE 1 - IDENTITY + VALUES
AMERICAN DREAM | PERSONAL GOALS_
White Black $60-99K+
$30-59K+
<$30K $100K+
BLACK AMERICANS ARE MORE
LIKELY TO CONSULT THEIR FAMILIES
FOR IMPORTANT LIFE DECISIONS
THAN ARE WHITE AMERICANS.
29. 29
THE MORE AFFLUENT, THE MORE CONNECTED TO THE FAMILY AND COMMUNITY.
<$30K $30-$59K $60-$99K $100K +
I go out of my way to pass down family
traditions 56% 62% 62% 68%
Having children is very
important to me 62% 64% 68% 77%
I give back to my community by
volunteering and supporting causes that
benefit the entire community
48% 55% 62% 75%
Raising a family is more important to me than
a career 54% 54% 63% 66%
Marriage is very important to me 60% 62% 70% 79%
Raising a family is more important than a career: this is even more true for foreign-born (66%).*
Q1: Please select the point in the scale to which you agree or disagree with each statement. (Any Agree)
WAVE 1 - IDENTITY + VALUES
EMERGING BLACK AFFLUENTS | FAMILY_
30. <$30K $30-$59K $60-$99K $100K+
My race/heritage
defines me
54% 58% 64% 68%
My closest
friends and I are of
the same race/
ethnicity
48% 46% 51% 57%
THE MORE AFFLUENT, THE MORE
CONNECTED TO CULTURE AND HERITAGE.
30
Q1: Please select the point in the scale to which you agree or disagree with each statement.
(Any Agree)
WAVE 1 - IDENTITY + VALUES
EMERGING BLACK AFFLUENTS | CULTURE_
32. Blacks Non-Blacks 18-24 25-39 40-54 55+ <$30K $30-59K $60-99K $100K+
83%
81%
73%
58%
76%
64%
65%
60%
51%
67%
WITH AGE AND INCREASED INCOME COMES AN EVEN STRONGER
CALL FOR BRANDS TO SUPPORT DIVERSITY AND INCLUSION.
Q15a. How important is it to you that companies/brands you support promote diversity and inclusion?
Whites: 49%
Hispanics: 56%
Asians: 60%
32
WAVE 1 - IDENTITY + VALUES
SMART MARKETING MOVES | DE&I_
33. 33
18-24 25-39 40-54 55+
46%
41%
52%
58%
<$30K $30-$59K $60-$99K $100K+
60%
53%
52%
44%
Q15b. Have you ever boycotted a company or brand because you felt they did something unethically towards people of your race/ethnicity?
Boycotting is even more common among key cohorts including Gen Z, Emerging
Black Affluents, Men, and those identifying as LGBTQ+.
WAVE 1 - IDENTITY + VALUES
SMART MARKETING MOVES | DE&I_
48% OF BLACK AMERICANS HAVE BOYCOTTED A
COMPANY OR BRAND BECAUSE OF UNETHICAL
ACTIONS TOWARDS THE BLACK COMMUNITY.
Men Women LGBTQ+ Non LGBTQ+
Yes 52% 45% 64% 46%
34. HIT THE RIGHT NOTES MOVE BEYOND CSR
Black Americans are optimistic about
personal growth and achievement. Leverage
this passion for progress and position your
brand as a partner on that journey.
ZERO IN
Black Americans are
incredibly diverse in
identity, mindset and
behavior. Understand
which cohort is most
critical for your
business and zero in
on your message.
INFORM
+ INSPIRE
85% of Black
Americans want to
know as much as
possible before
making a decision.
This desire
increases with both
age and income,
making product
marketing critical
for driving sales.
While philanthropic efforts are important, if you’re not also marketing services and
products in relevant ways, you’re leaving money on the table. According to the
August 2021 McKinsey Quarterly, Black consumers are willing to shift $260B to
companies that can better deliver what they need.
34
WAVE 1 - IDENTITY + VALUES
SMART MARKETING MOVES | TOP 4_
35. WILL CAMPBELL MELANIE WILLIAMS ROY EDUARDO KOKOYACHUK
Co-Founder and CEO
Quantasy + Associates
35
CARLOS YANEZ
SVP, Head of Strategy
Quantasy + Associates
Co-Founder and Principal
ThinkNow
CSVP, Custom Research
ThinkNow
WAVE 1 - IDENTITY + VALUES
OUR LEADERS_
37. DEMOGRAPHICS
37
Blacks (A) Non-Blacks (B)
Gender
Male 49% 47%
Female 50% 52%
Transgender 1% 1%
Age
18-24 15%B 11%
25-39 31% 32%
40-54 24% 22%
55+ 30% 35% A
Identify as LGBTQ+ 12% 14%
Born in U.S 90% B 85%
Race/Ethnicity
Black, African American 100% --
Asian/Pacific Islander 0% 8%
American Indian or Alaska
Native
2% 1%
White -- 88%
Hispanic 6% 21%
(n=1033) (n=500)
Blacks (A) Non-Blacks (B)
Region
Northeast 17% 19%
Midwest 17% 21% A
South 57% B 35%
West 10% 24% A
Marital Status
Single 46%B 21%
Married or living with partner 38% 62%A
Separated/divorced/widowed 15% 17%
Annual Household Income
Mean (in thousands) $41.7K $56.3K A
Political Affiliation
Conservative 45% 54%A
Liberal 55%B 46%
(n=1033) (n=500)
WAVE 1 - IDENTITY + VALUES