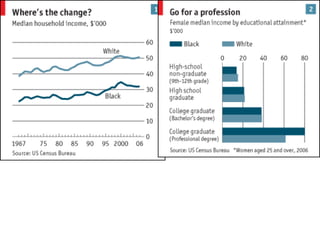
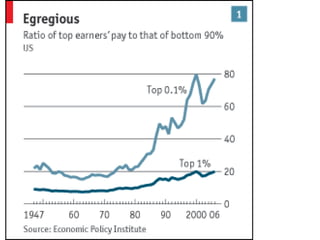
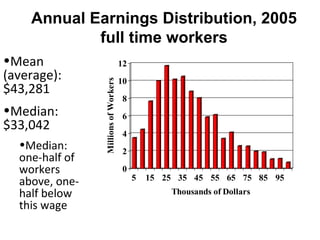
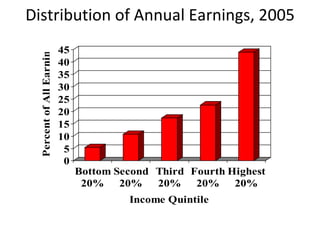
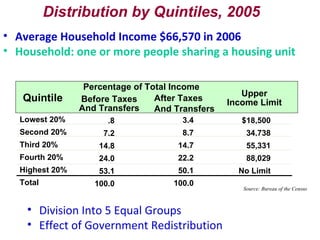
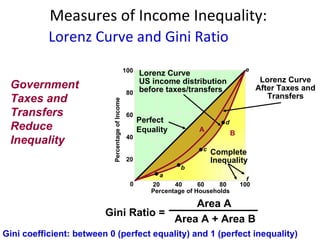
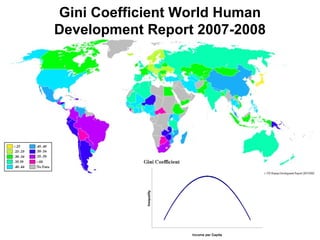
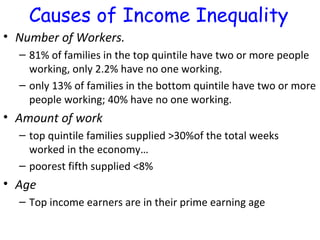
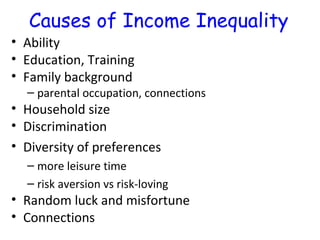
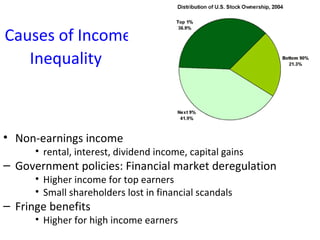
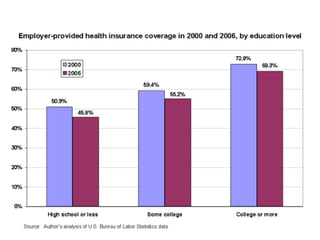
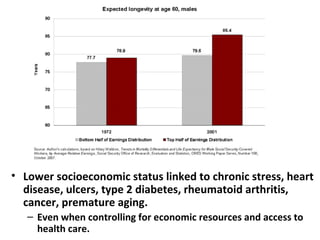
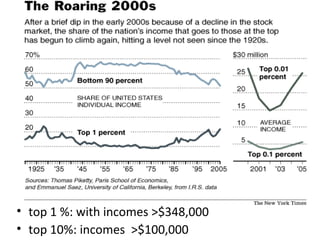
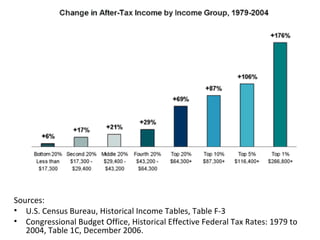
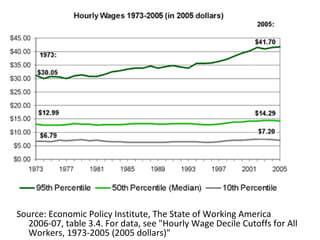
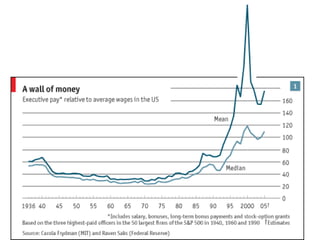
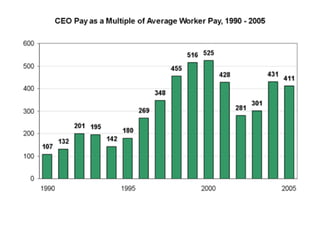
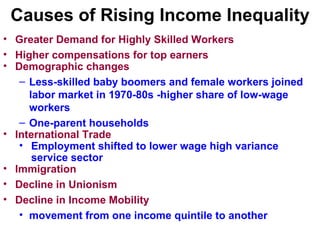
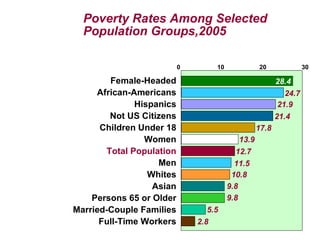
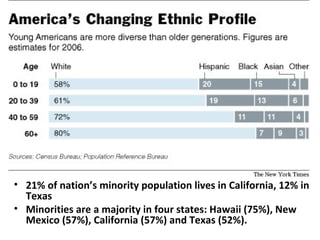
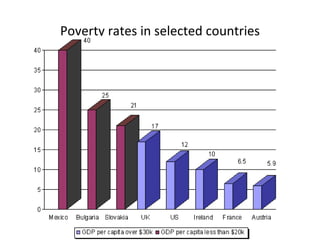
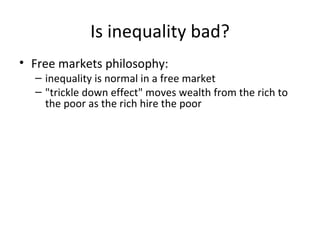
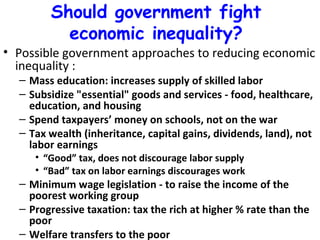
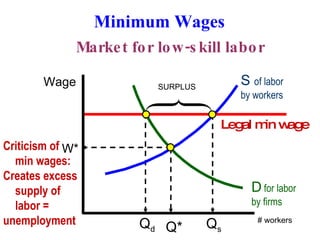
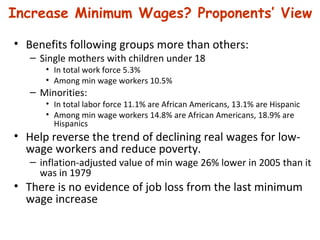
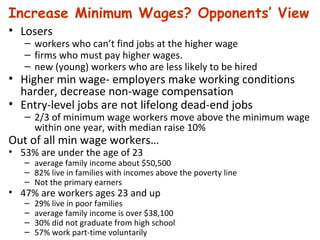
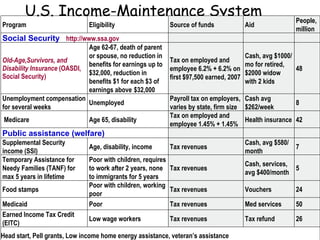
Income Inequality, Poverty,  Government’s Role
 
 
Annual Earnings Distribution, 2005 full time workers Mean (average): $43,281 Median: $33,042  Median: one-half of workers above, one-half below this wage
Distribution of Annual Earnings, 2005
Division Into 5 Equal Groups Effect of Government Redistribution Quintile After Taxes And Transfers   Lowest 20% Second 20% Third 20% Fourth 20% Highest 20% Total Distribution by Quintiles, 2005 3.4 8.7 14.7 22.2 50.1 100.0 Source: Bureau of the Census Upper Income Limit $18,500 34,738 55,331 88,029 No Limit Before Taxes And Transfers .8 7.2 14.8 24.0 53.1 100.0 Percentage of Total Income Average Household Income $66,570 in 2006 Household: one or more people sharing a housing unit
Measures of Income Inequality: Lorenz Curve and Gini Ratio Perfect  Equality Lorenz Curve US income distribution  before taxes/transfers Complete  Inequality A B a b c d e f Lorenz Curve After Taxes and Transfers Government  Taxes and  Transfers Reduce  Inequality Gini coefficient: between 0 (perfect equality) and 1 (perfect inequality) 20 40 60 80 100 20 40 60 80 100 0 Gini Ratio = Area A Area A + Area B Percentage of Households Percentage of Income
Gini Coefficient World Human Development Report 2007-2008
Number of Workers.  81% of families in the top quintile have two or more people working, only 2.2% have no one working.  only 13% of families in the bottom quintile have two or more people working; 40% have no one working.  Amount of work top quintile families supplied >30%of the total weeks worked in the economy… poorest fifth supplied <8% Age Top income earners are in their prime earning age Causes of Income Inequality
Causes of Income Inequality Ability Education, Training Family background parental occupation, connections Household size Discrimination Diversity of preferences more leisure time risk aversion vs risk-loving Random luck and misfortune Connections
Non-earnings income  rental, interest, dividend income, capital gains Government policies: Financial market deregulation Higher income for top earners Small shareholders lost in financial scandals Fringe benefits  Higher for high income earners Causes of Income Inequality
 
Lower socioeconomic status linked to chronic stress, heart disease, ulcers, type 2 diabetes, rheumatoid arthritis, cancer, premature aging. Even when controlling for economic resources and access to health care.
top 1 %: with incomes >$348,000  top 10%: incomes  >$100,000
Sources:  U.S. Census Bureau, Historical Income Tables, Table F-3 Congressional Budget Office, Historical Effective Federal Tax Rates: 1979 to 2004, Table 1C, December 2006.
Source: Economic Policy Institute, The State of Working America 2006-07, table 3.4. For data, see &quot;Hourly Wage Decile Cutoffs for All Workers, 1973-2005 (2005 dollars)&quot;
 
 
Causes of Rising Income Inequality Greater Demand for Highly Skilled Workers Higher compensations for top earners Demographic changes Less-skilled baby boomers and female workers joined labor market in 1970-80s -higher share of low-wage workers One-parent households   International Trade Employment shifted to lower wage high variance service sector Immigration Decline in Unionism Decline in Income Mobility movement from one income quintile to another
Female-Headed African-Americans Hispanics Not US Citizens Children Under 18 Women Total Population Men Whites Asian Persons 65 or Older Married-Couple Families Full-Time Workers 0  10  20  30 24.7 21.9 21.4 17.8 13.9 12.7 11.5 10.8 9.8 9.8 5.5 2.8 28.4 Poverty Rates Among Selected Population Groups,2005
21% of nation’s minority population lives in California, 12% in Texas Minorities are a majority in four states: Hawaii (75%), New Mexico (57%), California (57%) and Texas (52%).
Poverty rates in selected countries
Is inequality bad? Free markets philosophy:  inequality is normal in a free market &quot;trickle down effect&quot; moves wealth from the rich to the poor as the rich hire the poor
Should government fight economic inequality? Possible government approaches to reducing economic inequality : Mass education: increases supply of skilled labor Subsidize &quot;essential&quot; goods and services - food, healthcare, education, and housing Spend taxpayers’ money on schools, not on the war Tax wealth (inheritance, capital gains, dividends, land), not labor earnings  “ Good” tax, does not discourage labor supply “ Bad” tax on labor earnings discourages work  Minimum wage legislation - to raise the income of the poorest working group Progressive taxation: tax the rich at higher % rate than the poor Welfare transfers to the poor
D   for labor  by firms S  of labor  by workers Legal min wage W* SURPLUS Q* Q s Q d # workers Minimum Wages Market for low-skill labor Criticism of min wages: Creates excess supply of labor =  unemployment Wage
Benefits following groups more than others: Single mothers with children under 18 In total work force 5.3% Among min wage workers 10.5%  Minorities:  In total labor force 11.1% are African Americans, 13.1% are Hispanic  Among min wage workers 14.8% are African Americans, 18.9% are Hispanics Help reverse the trend of declining real wages for low-wage workers and reduce poverty. inflation-adjusted value of min wage 26% lower in 2005 than it was in 1979 There is no evidence of job loss from the last minimum wage increase Increase Minimum Wages? Proponents’ View
Losers  workers who can’t find jobs at the higher wage firms who must pay higher wages. new (young) workers who are less likely to be hired  Higher min wage- employers make working conditions harder, decrease non-wage compensation Entry-level jobs are not lifelong dead-end jobs  2/3 of minimum wage workers move above the minimum wage within one year, with median raise 10%  Out of all min wage workers… 53% are under the age of 23  average family income about $50,500  82% live in families with incomes above the poverty line  Not the primary earners  47% are workers ages 23 and up 29% live in poor families  average family income is over $38,100  30% did not graduate from high school 57% work part-time voluntarily  Increase Minimum Wages? Opponents’ View
U.S. Income-Maintenance System Program Eligibility Source of funds Aid People, million  Social Security   http://www.ssa.gov Old-Age,Survivors, and Disability Insurance  (OASDI, Social Security)  Age 62-67, death of parent or spouse, no reduction in benefits for earnings up to $32,000, reduction in benefits $1 for each $3 of earnings above   $32,000 Tax on employed and employee 6.2% + 6.2% on first $97,500 earned, 2007 Cash, avg $1000/mo for retired, $2000 widow with 2 kids 48 Unemployment compensation for several weeks Unemployed Payroll tax on employers, varies by state, firm size Cash avg $262/week 8 Medicare Age 65, disability Tax on employed and employee 1.45% + 1.45% Health insurance  42 Public assistance (welfare) Supplemental Security income (SSI) Age, disability, income  Tax revenues Cash, avg $580/month  7 Temporary Assistance for Needy Families (TANF) for max 5 years in lifetime Poor with children, requires to work after 2 years, none to immigrants for 5 years Tax revenues  Cash, services, avg $400/month 5 Food stamps Poor with children, working poor Tax revenues Vouchers 24 Medicaid Poor Tax revenues  Med services 50 Earned Income Tax Credit (EITC) Low wage workers Tax revenues Tax refund 26 Head start, Pell grants, Low income home energy assistance, veteran’s assistance
Welfare reform of 1996 Personal Responsibility and Work Opportunity Reconciliation Act Replaced Aid to Families with Dependent Children with Temporary Assistance to Needy Families Cut Food Stamps and SSI Est.  lifetime limit 5 years  for TANF assistance States must show that 50% of single mothers on welfare are working  at least 30 hours if youngest child >age 6, 20 hours if < age 6 Pushes women into low wage labor market, away from education Welfare caseload fell 60% since 1996 Employment among single mothers increased Income poverty rate among single mothers declined but well-being did not improve Extra childcare and transportation expenses

Family7 Ineq

  • 1.
    Income Inequality, Poverty, Government’s Role
  • 2.
  • 3.
  • 4.
    Annual Earnings Distribution,2005 full time workers Mean (average): $43,281 Median: $33,042 Median: one-half of workers above, one-half below this wage
  • 5.
    Distribution of AnnualEarnings, 2005
  • 6.
    Division Into 5Equal Groups Effect of Government Redistribution Quintile After Taxes And Transfers Lowest 20% Second 20% Third 20% Fourth 20% Highest 20% Total Distribution by Quintiles, 2005 3.4 8.7 14.7 22.2 50.1 100.0 Source: Bureau of the Census Upper Income Limit $18,500 34,738 55,331 88,029 No Limit Before Taxes And Transfers .8 7.2 14.8 24.0 53.1 100.0 Percentage of Total Income Average Household Income $66,570 in 2006 Household: one or more people sharing a housing unit
  • 7.
    Measures of IncomeInequality: Lorenz Curve and Gini Ratio Perfect Equality Lorenz Curve US income distribution before taxes/transfers Complete Inequality A B a b c d e f Lorenz Curve After Taxes and Transfers Government Taxes and Transfers Reduce Inequality Gini coefficient: between 0 (perfect equality) and 1 (perfect inequality) 20 40 60 80 100 20 40 60 80 100 0 Gini Ratio = Area A Area A + Area B Percentage of Households Percentage of Income
  • 8.
    Gini Coefficient WorldHuman Development Report 2007-2008
  • 9.
    Number of Workers. 81% of families in the top quintile have two or more people working, only 2.2% have no one working. only 13% of families in the bottom quintile have two or more people working; 40% have no one working. Amount of work top quintile families supplied >30%of the total weeks worked in the economy… poorest fifth supplied <8% Age Top income earners are in their prime earning age Causes of Income Inequality
  • 10.
    Causes of IncomeInequality Ability Education, Training Family background parental occupation, connections Household size Discrimination Diversity of preferences more leisure time risk aversion vs risk-loving Random luck and misfortune Connections
  • 11.
    Non-earnings income rental, interest, dividend income, capital gains Government policies: Financial market deregulation Higher income for top earners Small shareholders lost in financial scandals Fringe benefits Higher for high income earners Causes of Income Inequality
  • 12.
  • 13.
    Lower socioeconomic statuslinked to chronic stress, heart disease, ulcers, type 2 diabetes, rheumatoid arthritis, cancer, premature aging. Even when controlling for economic resources and access to health care.
  • 14.
    top 1 %:with incomes >$348,000 top 10%: incomes >$100,000
  • 15.
    Sources: U.S.Census Bureau, Historical Income Tables, Table F-3 Congressional Budget Office, Historical Effective Federal Tax Rates: 1979 to 2004, Table 1C, December 2006.
  • 16.
    Source: Economic PolicyInstitute, The State of Working America 2006-07, table 3.4. For data, see &quot;Hourly Wage Decile Cutoffs for All Workers, 1973-2005 (2005 dollars)&quot;
  • 17.
  • 18.
  • 19.
    Causes of RisingIncome Inequality Greater Demand for Highly Skilled Workers Higher compensations for top earners Demographic changes Less-skilled baby boomers and female workers joined labor market in 1970-80s -higher share of low-wage workers One-parent households International Trade Employment shifted to lower wage high variance service sector Immigration Decline in Unionism Decline in Income Mobility movement from one income quintile to another
  • 20.
    Female-Headed African-Americans HispanicsNot US Citizens Children Under 18 Women Total Population Men Whites Asian Persons 65 or Older Married-Couple Families Full-Time Workers 0 10 20 30 24.7 21.9 21.4 17.8 13.9 12.7 11.5 10.8 9.8 9.8 5.5 2.8 28.4 Poverty Rates Among Selected Population Groups,2005
  • 21.
    21% of nation’sminority population lives in California, 12% in Texas Minorities are a majority in four states: Hawaii (75%), New Mexico (57%), California (57%) and Texas (52%).
  • 22.
    Poverty rates inselected countries
  • 23.
    Is inequality bad?Free markets philosophy: inequality is normal in a free market &quot;trickle down effect&quot; moves wealth from the rich to the poor as the rich hire the poor
  • 24.
    Should government fighteconomic inequality? Possible government approaches to reducing economic inequality : Mass education: increases supply of skilled labor Subsidize &quot;essential&quot; goods and services - food, healthcare, education, and housing Spend taxpayers’ money on schools, not on the war Tax wealth (inheritance, capital gains, dividends, land), not labor earnings “ Good” tax, does not discourage labor supply “ Bad” tax on labor earnings discourages work Minimum wage legislation - to raise the income of the poorest working group Progressive taxation: tax the rich at higher % rate than the poor Welfare transfers to the poor
  • 25.
    D for labor by firms S of labor by workers Legal min wage W* SURPLUS Q* Q s Q d # workers Minimum Wages Market for low-skill labor Criticism of min wages: Creates excess supply of labor = unemployment Wage
  • 26.
    Benefits following groupsmore than others: Single mothers with children under 18 In total work force 5.3% Among min wage workers 10.5% Minorities: In total labor force 11.1% are African Americans, 13.1% are Hispanic Among min wage workers 14.8% are African Americans, 18.9% are Hispanics Help reverse the trend of declining real wages for low-wage workers and reduce poverty. inflation-adjusted value of min wage 26% lower in 2005 than it was in 1979 There is no evidence of job loss from the last minimum wage increase Increase Minimum Wages? Proponents’ View
  • 27.
    Losers workerswho can’t find jobs at the higher wage firms who must pay higher wages. new (young) workers who are less likely to be hired Higher min wage- employers make working conditions harder, decrease non-wage compensation Entry-level jobs are not lifelong dead-end jobs 2/3 of minimum wage workers move above the minimum wage within one year, with median raise 10% Out of all min wage workers… 53% are under the age of 23 average family income about $50,500 82% live in families with incomes above the poverty line Not the primary earners 47% are workers ages 23 and up 29% live in poor families average family income is over $38,100 30% did not graduate from high school 57% work part-time voluntarily Increase Minimum Wages? Opponents’ View
  • 28.
    U.S. Income-Maintenance SystemProgram Eligibility Source of funds Aid People, million Social Security http://www.ssa.gov Old-Age,Survivors, and Disability Insurance (OASDI, Social Security) Age 62-67, death of parent or spouse, no reduction in benefits for earnings up to $32,000, reduction in benefits $1 for each $3 of earnings above $32,000 Tax on employed and employee 6.2% + 6.2% on first $97,500 earned, 2007 Cash, avg $1000/mo for retired, $2000 widow with 2 kids 48 Unemployment compensation for several weeks Unemployed Payroll tax on employers, varies by state, firm size Cash avg $262/week 8 Medicare Age 65, disability Tax on employed and employee 1.45% + 1.45% Health insurance 42 Public assistance (welfare) Supplemental Security income (SSI) Age, disability, income Tax revenues Cash, avg $580/month 7 Temporary Assistance for Needy Families (TANF) for max 5 years in lifetime Poor with children, requires to work after 2 years, none to immigrants for 5 years Tax revenues Cash, services, avg $400/month 5 Food stamps Poor with children, working poor Tax revenues Vouchers 24 Medicaid Poor Tax revenues Med services 50 Earned Income Tax Credit (EITC) Low wage workers Tax revenues Tax refund 26 Head start, Pell grants, Low income home energy assistance, veteran’s assistance
  • 29.
    Welfare reform of1996 Personal Responsibility and Work Opportunity Reconciliation Act Replaced Aid to Families with Dependent Children with Temporary Assistance to Needy Families Cut Food Stamps and SSI Est. lifetime limit 5 years for TANF assistance States must show that 50% of single mothers on welfare are working at least 30 hours if youngest child >age 6, 20 hours if < age 6 Pushes women into low wage labor market, away from education Welfare caseload fell 60% since 1996 Employment among single mothers increased Income poverty rate among single mothers declined but well-being did not improve Extra childcare and transportation expenses

Editor's Notes