SlideShare a Scribd company logo
1 of 50
Income and
Wealth Inequality
in the United
States
David Doney CPA
April 2017
1Source Data: Piketty, Saez, & Zucman: Distributional National Accounts (Nov 2016)
2
Income and Wealth Inequality in the U.S.
1. Introduction
2. Causes of Income Inequality
3. Tax Policies
4. Wealth Inequality
5. Debating Inequality
Summary
1. Income inequality refers to a disproportionate share of the income going to relatively few.
2. Income and wealth inequality have steadily worsened since 1980, after a period of relative equality 1950-1979.
3. The top 1% of income earners had about 20% of the pre-tax income in 2014, versus 10% prior to 1980.
4. At 1979 levels of equality, the bottom 80% would be getting $11,000 more per year in pre-tax income.
5. The U.S. is roughly 30th percentile globally, meaning 70% of countries have a more equal income distribution.
6. Income inequality may slow economic growth, increase political polarization, and produce social unrest.
7. There are many causes of inequality; it is a by-product of our global economic system and policy choices.
8. An important differentiator between the middle-class and lower incomes is a college degree.
9. Tax policy choices since 1980 have reduced effective tax rates on higher income persons and corporations overall,
although tax increases under Presidents Clinton and Obama offset some of the trend.
10. Solutions can be focused on making the distribution of income more equitable before- or after-tax.
11. Examples of pre-tax solutions include raising the minimum wage, stronger unions, protectionism, and reduced low-skill
immigration. These affect market outcomes.
12. After-tax solutions include raising taxes on higher incomes, combined with transfers to lower income persons. For
example, ACA/Obamacare raised taxes on the top 5% to fund subsidies and Medicaid for lower income persons.
13. U.S. household and non-profit wealth reached a record $93 trillion in 2016, yet recent gains go mainly to the wealthy.
14. Wealth is distributed more unequally than income, with the top 1% owning 42% of the wealth vs. 24% in the 1970’s.
15. Higher corporate profits relative to GDP combined with increasing levels of stock buybacks and dividends are major
drivers of wealth inequality, as the top 5% wealthiest own about 70% of the financial assets.
16. Government action to reduce inequality is supported by a majority of Democrats but a minority of Republicans.
3
4CBO: The Distribution of Household Income and Federal Taxes, 2013
+188%
+63%
+18%
Since 1980,
income growth has
primarily gone to
the top 1%
Source: Piketty, Saez, Zucman: Distributional National Accounts (Nov 2016) 5
20%
12%
Share of pre-tax income by income group
 The top 1% now have about
20% of the pre-tax income,
versus 10% in 1980.
 The bottom 50% now have
12% of the pre-tax income,
versus 20% in 1980.
 Income inequality statistics
tend to lag about 2 years, due
to availability of source data.
What does this shift mean for families?
If the United States shifted income away from the top 1% so that we
had the 1979 income distribution:
 The bottom 99% of families would each get $7,000 more in annual
pre-tax income
(or)
 The bottom 80% of families would each get $11,000 more in
annual pre-tax income
Source: Larry Summers “Focus on growth for the middle class” Washington Post. ( January 2015)
NYT: Eduardo Porter-Rethinking the Rise of Inequality (Nov 2013)
6
Economic & Political Impact of Inequality
Slower economic growth
 Higher income households spend lower proportion of income
 Consumption might be 5% higher ($1 trillion/year) with 1979 inequality
Higher household debt & risk of financial crises
 Indebted households spend less and are at greater risk of defaulting on debts
Social Security financing / budget deficit
 More income above taxable threshold ($127,200 in 2017) not taxed
Political Impact
 Polarization: Two electorates / Two economies
 Social unrest
Reduced opportunity
 Higher inequality corresponds with reduced income mobility (“Great-Gatsby Curve”)
Alan Krueger “Chairman Alan Krueger discusses the rise and consequences of inequality…” (January 2012)
https://www.whitehouse.gov/blog/2012/01/12/chairman-alan-krueger-discusses-rise-and-consequences-inequality-center-american-pro
7
Miles Corak
https://milescorak.com/2012/01/12/here-is-the-source-for-the-great-gatsby-curve-in-the-alan-krueger-speech-at-the-center-for-american-progress/
“Great Gatsby” Curve
As income inequality
worsens, so does income
mobility across
generations (e.g., children
tend to remain in same
income group as parents)
8
Less
Income
Mobility
More unequal
How Important is Solving the Problem?
9
“I believe this is the defining challenge of our time: Making
sure our economy works for every working American. ”
“But we know that people’s frustrations run deeper than
these most recent political battles. Their frustration is
rooted in their own daily battles -- to make ends meet, to
pay for college, buy a home, save for retirement. It’s
rooted in the nagging sense that no matter how hard they
work, the deck is stacked against them. And it’s rooted in
the fear that their kids won’t be better off than they
were. They may not follow the constant back-and-forth in
Washington or all the policy details, but they experience in
a very personal way the relentless, decades-long trend
that I want to spend some time talking about today.
And that is a dangerous and growing inequality and
lack of upward mobility that has jeopardized middle-
class America’s basic bargain -- that if you work hard,
you have a chance to get ahead.”
President Barack Obama “Remarks by the President on Economic Mobility” December 4, 2013
Inequality is a Moral, Political and Economic Issue
10
Pope Francis denounces “trickle down” economic theories…” Washington Post. November 2013 / Pope Francis Evangelii Gaudium - November 2013
53. Just as the commandment “Thou shalt not kill” sets a clear limit in order to safeguard the value
of human life, today we also have to say “thou shalt not” to an economy of exclusion and
inequality. Such an economy kills. How can it be that it is not a news item when an elderly
homeless person dies of exposure, but it is news when the stock market loses two points? This is a
case of exclusion. Can we continue to stand by when food is thrown away while people are
starving? This is a case of inequality. Today everything comes under the laws of competition and
the survival of the fittest, where the powerful feed upon the powerless. As a consequence,
masses of people find themselves excluded and marginalized: without work, without
possibilities, without any means of escape. Human beings are themselves considered
consumer goods to be used and then discarded. We have created a “throw away” culture which is
now spreading. It is no longer simply about exploitation and oppression, but something new.
Exclusion ultimately has to do with what it means to be a part of the society in which we live; those
excluded are no longer society’s underside or its fringes or its disenfranchised – they are no longer
even a part of it. The excluded are not the “exploited” but the outcast, the “leftovers”.
54. In this context, some people continue to defend trickle-down theories which assume
that economic growth, encouraged by a free market, will inevitably succeed in bringing
about greater justice and inclusiveness in the world. This opinion, which has never been
confirmed by the facts, expresses a crude and naïve trust in the goodness of those
wielding economic power and in the sacralized workings of the prevailing economic
system. Meanwhile, the excluded are still waiting. To sustain a lifestyle which excludes
others, or to sustain enthusiasm for that selfish ideal, a globalization of indifference has
developed. Almost without being aware of it, we end up being incapable of feeling compassion at
the outcry of the poor, weeping for other people’s pain, and feeling a need to help them, as though
all this were someone else’s responsibility and not our own. The culture of prosperity deadens us;
we are thrilled if the market offers us something new to purchase. In the meantime all those lives
stunted for lack of opportunity seem a mere spectacle; they fail to move us.
11
Income and Wealth Inequality in the U.S.
1. Introduction
2. Causes of Income Inequality
3. Tax Policies
4. Wealth Inequality
5. Debating Inequality
Source: Inequality for All - Graphics Package http://inequalityforall.com/resources/#/
12
Income of Top 1% over Long-Run
“Great Moderation” (1945-1980)
 Stronger unions
 Moderate executive pay norms
 Higher real minimum wage
 Limited immigration
 Less international competition
 Higher income tax rates on rich
“Why is inequality rising?
There is some disagreement about this and also some nuance as to exactly which aspect of inequality we're talking about and what kind.
Some of the most prominent accounts:
Skill-biased technological change. Technological improvements raise incomes, but they do so unevenly. Rewards disproportionately go to
highly educated workers. On this view, rising inequality reflects slowing educational progress and better schooling is the key solution. This
has been the traditionally dominant view in economics, but it doesn't explain the specific rise of the top 1 percent very well.
Immigration. Importing low-skilled workers to do low-paid jobs tends to raise measured income inequality. David Card estimates
immigration to be the cause of about 5 percent of the total rise in inequality.
Decline of labor unions. Labor unions reduce inequality both by raising wages at the low end and constraining them at the high end. Bruce
Western and Jake Rosenfeld estimate that the decline of labor unions as a force in the American economy is responsible for 20 to 33
percent of the overall rise in inequality.
Trade. Growing international trade with lower-wage countries such as China seems to have reduced the wage share of overall national
income, boosting the incomes of people with large stock holdings.
Superstar effects. Because the world is bigger and richer in 2014 than it was in 1964, being a "star" performer — the most popular
athlete, author, or singer — is more lucrative than it used to be.
Executives and Wall Street. Increased incomes for CEOs and financial sector professionals account for 58 percent of the top 1 percent of
the income distribution and 67 percent of the top 0.1 percent. So the specific dynamics of compensation in those areas are wielding a big
influence.
Minimum wage. David Autor, Alan Manning, and Christopher Smith find that about a third (or possibly as much as half) of the growth in
inequality between the median and the bottom ten percent is due to the declining real value of the minimum wage. This is different from
the issues about the top end pulling away that normally dominate political discussions of inequality, but it's a noteworthy finding
nonetheless.
The fundamental nature of capitalism. Thomas Piketty has made waves lately with his new book Capital in the 21st Century, which argues
that very high levels of inequality are the natural state of market economies. In his view, it's the economic equality of the mid-twentieth
century that needs explaining, not today's inequality.” 13
VOX: Why is Inequality Rising?
Source: VOX-Everything You Need to Know About Income Inequality
 Union membership rate fell
from 20.1% in 1983 to 11.% in
2015.
 “Public-sector workers had a
union membership rate (35.2
percent) more than five times
higher than that of private-
sector workers (6.7 percent).”
 “Median weekly earnings of
nonunion workers ($776)
were 79 percent of earnings
for workers who were union
members ($980).”
14
Source: BLS “Union Members Summary” (2015)
Income Inequality and Union Membership (1918-2008)
Economic Policy Institute (EPI) Newsletter: Unions and Shared Prosperity http://www.epi.org/news/union-membership-declines-inequality-rises/
Top 10% income share
Union
participation
“Superstar hypothesis” argues
similar premium for very top
performers in multiple fields.
CEO Pay: http://www.epi.org/publication/ceo-and-worker-pay-in-2015/
The Economist, “Who Exactly are the 1%” (January 2012)
15
16
Source: Wikipedia
The real minimum wage
has fallen relative to its
peak during the Great
Moderation
Source: 1997 Economic Report of the President
17
Labor Substitution: Immigration & Globalization
Types of labor substitution
 Immigration
 Off-shoring / Sourcing overseas
 While immigrants increase the
supply of labor, they also
increase demand, leading to a
variety of debates about impact
 Studies indicate low-skill
immigrants may moderately
reduce the wages of workers
without high school educations,
but do not increase native
worker unemployment
Source: 1997 Economic Report of the President
NYT Eduardo Porter “Rethinking the Rise of Inequality” (Nov 2013)
18
College Premium Through 1995
 “In 1980 the median male college
graduate earned roughly one-third
more than the median male high
school graduate, but this wage
premium grew to over 70 percent
by 1993.”
 “Since then that trend has slowed,
and the ratio even declined slightly
in 1995.”
 Separate study (Lemieux 2010)
estimated that 60% of the change
in wage inequality between 1973
and 2005 due to college premium.
 But does it explain the top 1%?
1.7
1.3
19Source: NYT: Eduardo Porter-Rethinking the Rise of Inequality (Nov 2013)
While the college premium
contributed to worsening
inequality 1970-2000, it
leveled off and was not a
major contributor to further
increases thereafter.
It does not explain why the 1%
are leaving the other college-
educated population behind.
College Premium Through 2011
20
Why is Inequality Rising?
Source: VOX-Everything You Need to Know About Income Inequality
•Lax anti-trust
enforcement
•Anti-union laws
•Income tax cuts
•Real minimum wage
declines
•Exec pay norms
changed
•Superstar effects
•College premium
•Labor force
participation
proportional to
education
•Trade / Offshoring
•Low-skill immigration
•Decline of unions
Global
Competition
Education
Policy /
Deregulation
Compensation
Trends
 There are many theories about why
inequality has worsened
 The reasons behind one income
group separating from another vary
 For example, the college premium
explains much of the difference in
income between the middle and
lower income groups
 Reasons for the 1% leaving others
behind are a composite of nearly
every factor, with executive pay a
key element
21
Income and Wealth Inequality in the U.S.
1. Introduction
2. Causes of Income Inequality
3. Tax Policies
4. Wealth Inequality
5. Debating Inequality
22
23
CBO: Top 1% received 12.4% of after-tax income in 2013,
versus 7.4% in 1979.
Source: CBO “Distribution of Household Income and Federal Taxes 2013”
24
U.S. income inequality is high but
comparable to other developed
nations before taxes and transfers,
but the worst after.
That is, we redistribute less.
We are roughly 30th percentile
globally, meaning 70% of countries
have a more equal income
distribution (Source: CIA World
Factbook)
Gini index ranges from:
0 (equal) to
1 (unequal)
25
Gornick & Milanovic Income Inequality in Cross-National Perspective (May 2015)
Source: NYT Who’s tax rates rose or fell? (April 2012)
http://www.nytimes.com/imagepages/2012/04/13/opinion/sunday/0415web-leonhardt.html?
Average tax rates
for highest
incomes cut
dramatically since
the 1960’s.
26
27CBO: The Distribution of Household Income and Federal Taxes, 2013
2013: Obama allows
Bush tax cuts to expire
for top 1%
28
ACA/Obamacare raised taxes
on the top 5% and used it to
fund transfers (subsidies) to
lower income groups.
Obama also allowed the Bush
tax cuts of 2001 and 2003 to
expire for the top 1%.
These are examples of after-
tax solutions for addressing
income inequality.
Source: CEA Economic Report of the President 2017
29
CBO “The Distribution of Major Tax Expenditures
in the Individual Income Tax System” (May 2013)
Tax Expenditures (Top 10)
 Exclusions from taxable income
 Employer-sponsored health insurance
 Net pension contributions and earnings (401k)
 Capital gains on assets transferred at death
 A portion of Social Security and Retirement benefits
 Itemized deductions
 Certain taxes paid to state and local governments
 Mortgage interest payments
 Charitable contributions
 Preferential tax rates on capital gains and dividends
 Tax credits
 The earned income tax credit, and
 The child tax credit.
Top 10: About $1 trillion
per year impact on
federal budget
30CBO “The Distribution of Major Tax Expenditures in the Individual Income Tax System” (May 2013)
17%
13%
9%
12%
51%
31
CBO “The Distribution of Major Tax Expenditures in the
Individual Income Tax System” (May 2013)
Major Tax Expenditures for the 1% in 2013 ($ Billions)
32
Income and Wealth Inequality in the U.S.
1. Introduction
2. Causes of Income Inequality
3. Tax Policies
4. Wealth Inequality
5. Debating Inequality
Household Net Worth 2000-2016
33
Our economy is a tremendous wealth engine…but the distribution is highly uneven.
 The top 1% had 42% of the wealth in 2015, vs. 36% in 2007 and 24% in 1979
 $93 trillion is about $700,000 / household on average, but bottom 50% average $11,000
34
42%
35
Source: Wikipedia
Janet Yellen speech “Perspectives on Inequality and Opportunity…” (October 17, 2014)
https://www.federalreserve.gov/newsevents/speech/yellen20141017a.htm 36
The Great Recession damaged highly-
leveraged homeowners in particular
Bottom 50% of
households have an
average net worth of
$11,000.
Janet Yellen speech “Perspectives on Inequality and Opportunity…” (October 17, 2014)
https://www.federalreserve.gov/newsevents/speech/yellen20141017a.htm 37
CBO: Family average wealth [2013]
 Top 10% = $4 million
 51st to 90th = $316,000
 26th to 50th = $36,000
 0 to 25th = $13,000 in debt.
CBO Trends in Family Wealth, 1989 to 2013
 76% of income gains 2009-
2013 went to top 1%.
38
Pew Center “The many ways to measure inequality” (September 22, 2015)
http://www.pewresearch.org/fact-tank/2015/09/22/the-many-ways-to-measure-economic-inequality/
39
Top 5% have 72% of
the financial wealth
(stocks & bonds)
So stock market
appreciation,
dividends, and
stock buybacks
disproportionally
benefit them
Source: Who Rules America? G. William Donhoff (UC Santa Cruz)
40
Corporate Profits (% GDP)
Buybacks and dividends are a
major upward redistribution
method for wealth
More companies are doing
stock buybacks, and in greater
amounts
Buybacks & dividends around
$900B annualized rate in 2015
& early 2016
For scale, non-residential
(business) investment was
~$2.2T in 2016
Top 5% own 72% of the
financial assets
Chart: Yardeni Research (January 2017)
http://www.yardeni.com/Pub/buybackdiv.pdf
William Lazonic “Profits without Prosperity” / HBR September 2014.
https://hbr.org/2014/09/profits-without-prosperity 41
Source: Krugman / Wells Microeconomics 3rd edition 42
Is the “Free Market” always right?
Output is higher and prices lower in
perfect competition, which is better for
consumers (labor) but less advantageous
to capital (owners).
As industries concentrate and deregulation
weakens anti-trust enforcement, outcomes
look more like oligopoly and monopoly
than perfect competition, meaning prices
are higher and output lower.
In other words, we have market failure;
regulation is required to get the optimal
market outcome!
This worsens inequality, as corporate
profits are distributed to higher-income
and wealth households.
43
Income and Wealth Inequality in the U.S.
1. Introduction
2. Causes of Income Inequality
3. Tax Policies
4. Wealth Inequality
5. Debating Inequality
Debating Income Inequality
“There’s class warfare, all right, but
it’s my class, the rich class, that’s
making war, and we’re winning.”
-- Warren Buffett (2006)
Ben Stein “In Class Warfare, Guess which class is winning?” NYT, Nov 2006.
http://www.nytimes.com/2006/11/26/business/yourmoney/26every.html 44
Polls
45
Pew Center: “Most Americans say U.S. economic system is unfair…” (Feb 2016)
http://www.pewresearch.org/fact-tank/2016/02/10/most-americans-say-u-s-economic-system-is-unfair-but-high-income-republicans-disagree/
Market Income “Pre-Distribution”
 Education (all ages)
 Retraining / Life-long learning
 Minimum wage
 Unions / labor power
 Limit labor substitution
 Profit sharing / 401k match
 Restrict buybacks and dividends
 Cultural shifts and awareness
Addressing Income & Wealth Inequality
After-Tax Income “Redistribution”
 Raise income tax rates on high incomes
 Minimum effective tax rate / “Buffett Rule”
 Remove cap on payroll tax
 Treat all sources of income similarly
 Reduce “tax expenditures” for wealthy
 Minimum effective tax rates
Transfers
 Increase earned income tax credit
 Expand healthcare subsidies & Medicaid
 Medicare for All
For wealth inequality
 Raise estate taxes
 Sovereign wealth fund 46
Debating Income Inequality
47
Statistical Summary Table
48
Note: CBO income inequality numbers typically show the same trends, but are different than the Piketty, Saez, & Zucman
figures. See example in table for after-tax income share of top 1%.
Source: Piketty, Saez, Zucman: Distributional National Accounts (Nov 2016)
49
Sources
50
CBO: The Distribution of Household Income and Federal Taxes, 2013
https://www.cbo.gov/publication/51361
CBO: Trends in Family Wealth, 1989-2013
https://www.cbo.gov/publication/51846
VOX: Everything you need to know about income inequality
http://www.vox.com/cards/income-inequality

More Related Content

What's hot

Narrated public lecture of growing u.s. income inequality
Narrated public lecture of growing u.s. income inequalityNarrated public lecture of growing u.s. income inequality
Narrated public lecture of growing u.s. income inequalitydenny4573
 
Gini coefficient and gdp
Gini coefficient and gdp  Gini coefficient and gdp
Gini coefficient and gdp Tashi Angmo
 
slide 1: General principles of income distribution
slide 1: General principles of income distributionslide 1: General principles of income distribution
slide 1: General principles of income distributionJeanette Branzuela
 
Economic Inequality in Developing Country
Economic Inequality in Developing CountryEconomic Inequality in Developing Country
Economic Inequality in Developing CountryKhulna University
 
Incomeinequality
IncomeinequalityIncomeinequality
Incomeinequalitydevanelle
 
Economics: Poverty, Inequality & Development
Economics: Poverty, Inequality & Development Economics: Poverty, Inequality & Development
Economics: Poverty, Inequality & Development Lilliene Alleje
 
Income inequality
Income inequalityIncome inequality
Income inequalityalishaaan
 
Inequality, Economic Growth and Development
Inequality, Economic Growth and DevelopmentInequality, Economic Growth and Development
Inequality, Economic Growth and Developmenttutor2u
 
Economic sustainability
Economic sustainabilityEconomic sustainability
Economic sustainabilityRajat Nainwal
 
Income inequality in South Africa report
Income inequality in South Africa reportIncome inequality in South Africa report
Income inequality in South Africa reportJOSEPH TEBOHO MOKOENA
 
劉遵義 Income inequality under economic globalisation(final) 20150414
劉遵義 Income inequality under economic globalisation(final) 20150414劉遵義 Income inequality under economic globalisation(final) 20150414
劉遵義 Income inequality under economic globalisation(final) 20150414Andy Kuo
 
The High Cost of Gender Inequality in Earnings
The High Cost of Gender Inequality in EarningsThe High Cost of Gender Inequality in Earnings
The High Cost of Gender Inequality in EarningsEmisor Digital
 
Case for More Capitalism
Case for More CapitalismCase for More Capitalism
Case for More CapitalismAlan Rudi
 
Does Inequality Matter for Poverty Reduction?
Does Inequality Matter for Poverty Reduction?Does Inequality Matter for Poverty Reduction?
Does Inequality Matter for Poverty Reduction?Tri Widodo W. UTOMO
 

What's hot (20)

Income Distribution
Income DistributionIncome Distribution
Income Distribution
 
Narrated public lecture of growing u.s. income inequality
Narrated public lecture of growing u.s. income inequalityNarrated public lecture of growing u.s. income inequality
Narrated public lecture of growing u.s. income inequality
 
Income inequality
Income inequalityIncome inequality
Income inequality
 
Gini coefficient and gdp
Gini coefficient and gdp  Gini coefficient and gdp
Gini coefficient and gdp
 
slide 1: General principles of income distribution
slide 1: General principles of income distributionslide 1: General principles of income distribution
slide 1: General principles of income distribution
 
Income distribution
Income distributionIncome distribution
Income distribution
 
Economic Inequality in Developing Country
Economic Inequality in Developing CountryEconomic Inequality in Developing Country
Economic Inequality in Developing Country
 
Wealth inequality
Wealth inequalityWealth inequality
Wealth inequality
 
Incomeinequality
IncomeinequalityIncomeinequality
Incomeinequality
 
Economics: Poverty, Inequality & Development
Economics: Poverty, Inequality & Development Economics: Poverty, Inequality & Development
Economics: Poverty, Inequality & Development
 
Income inequality
Income inequalityIncome inequality
Income inequality
 
Inequality, Economic Growth and Development
Inequality, Economic Growth and DevelopmentInequality, Economic Growth and Development
Inequality, Economic Growth and Development
 
Economic sustainability
Economic sustainabilityEconomic sustainability
Economic sustainability
 
Income inequality in South Africa report
Income inequality in South Africa reportIncome inequality in South Africa report
Income inequality in South Africa report
 
劉遵義 Income inequality under economic globalisation(final) 20150414
劉遵義 Income inequality under economic globalisation(final) 20150414劉遵義 Income inequality under economic globalisation(final) 20150414
劉遵義 Income inequality under economic globalisation(final) 20150414
 
The High Cost of Gender Inequality in Earnings
The High Cost of Gender Inequality in EarningsThe High Cost of Gender Inequality in Earnings
The High Cost of Gender Inequality in Earnings
 
Case for More Capitalism
Case for More CapitalismCase for More Capitalism
Case for More Capitalism
 
Does Inequality Matter for Poverty Reduction?
Does Inequality Matter for Poverty Reduction?Does Inequality Matter for Poverty Reduction?
Does Inequality Matter for Poverty Reduction?
 
Income Inequality presentation
Income Inequality presentationIncome Inequality presentation
Income Inequality presentation
 
Case Econ08 Ppt 16
Case Econ08 Ppt 16Case Econ08 Ppt 16
Case Econ08 Ppt 16
 

Similar to Income and Wealth Inequality in the United States

Working For the Few - Political Capture and Economic Inequality
Working For the Few - Political Capture and Economic InequalityWorking For the Few - Political Capture and Economic Inequality
Working For the Few - Political Capture and Economic InequalityMiqui Mel
 
Bp working-for-few-political-capture-economic-inequality
Bp working-for-few-political-capture-economic-inequalityBp working-for-few-political-capture-economic-inequality
Bp working-for-few-political-capture-economic-inequalityanabenedito
 
Bp working-for-few-political-capture-economic-inequality-200114-en
Bp working-for-few-political-capture-economic-inequality-200114-enBp working-for-few-political-capture-economic-inequality-200114-en
Bp working-for-few-political-capture-economic-inequality-200114-enSalisu Borodo
 
Wealth Inequality In U.S.
Wealth Inequality In U.S.Wealth Inequality In U.S.
Wealth Inequality In U.S.Nicole Fields
 
Read Kraft & Furlong Chapters 9Chapter 9 Welfare and Social .docx
Read Kraft & Furlong Chapters 9Chapter 9 Welfare and Social .docxRead Kraft & Furlong Chapters 9Chapter 9 Welfare and Social .docx
Read Kraft & Furlong Chapters 9Chapter 9 Welfare and Social .docxAbhinav816839
 
The Economic Benefits Of Economic Welfare Essay
The Economic Benefits Of Economic Welfare EssayThe Economic Benefits Of Economic Welfare Essay
The Economic Benefits Of Economic Welfare EssayDani Cox
 
Recent trends in Income Inequality
Recent trends in Income InequalityRecent trends in Income Inequality
Recent trends in Income InequalityRick Frank
 

Similar to Income and Wealth Inequality in the United States (12)

Life on the Plantation: Thoughts on Income inequality
Life on the Plantation: Thoughts on Income inequalityLife on the Plantation: Thoughts on Income inequality
Life on the Plantation: Thoughts on Income inequality
 
Working for the Few
Working for the FewWorking for the Few
Working for the Few
 
Working For the Few - Political Capture and Economic Inequality
Working For the Few - Political Capture and Economic InequalityWorking For the Few - Political Capture and Economic Inequality
Working For the Few - Political Capture and Economic Inequality
 
Bp working-for-few-political-capture-economic-inequality
Bp working-for-few-political-capture-economic-inequalityBp working-for-few-political-capture-economic-inequality
Bp working-for-few-political-capture-economic-inequality
 
Bp working-for-few-political-capture-economic-inequality-200114-en
Bp working-for-few-political-capture-economic-inequality-200114-enBp working-for-few-political-capture-economic-inequality-200114-en
Bp working-for-few-political-capture-economic-inequality-200114-en
 
Wealth Inequality In U.S.
Wealth Inequality In U.S.Wealth Inequality In U.S.
Wealth Inequality In U.S.
 
Poverty Around The World
Poverty Around The WorldPoverty Around The World
Poverty Around The World
 
Read Kraft & Furlong Chapters 9Chapter 9 Welfare and Social .docx
Read Kraft & Furlong Chapters 9Chapter 9 Welfare and Social .docxRead Kraft & Furlong Chapters 9Chapter 9 Welfare and Social .docx
Read Kraft & Furlong Chapters 9Chapter 9 Welfare and Social .docx
 
20
2020
20
 
The Economic Benefits Of Economic Welfare Essay
The Economic Benefits Of Economic Welfare EssayThe Economic Benefits Of Economic Welfare Essay
The Economic Benefits Of Economic Welfare Essay
 
Recent trends in Income Inequality
Recent trends in Income InequalityRecent trends in Income Inequality
Recent trends in Income Inequality
 
Defending the One Percent
Defending the One PercentDefending the One Percent
Defending the One Percent
 

More from David Doney

Understanding the Trump Economy
Understanding the Trump EconomyUnderstanding the Trump Economy
Understanding the Trump EconomyDavid Doney
 
Tax Cuts and Jobs Act
Tax Cuts and Jobs ActTax Cuts and Jobs Act
Tax Cuts and Jobs ActDavid Doney
 
Thanksgiving Economics Briefing 2017
Thanksgiving Economics Briefing 2017Thanksgiving Economics Briefing 2017
Thanksgiving Economics Briefing 2017David Doney
 
Conservative economic mythology
Conservative economic mythologyConservative economic mythology
Conservative economic mythologyDavid Doney
 
Presidential Economic Performance: Comparing Obama, Clinton and Reagan
Presidential Economic Performance: Comparing Obama, Clinton and ReaganPresidential Economic Performance: Comparing Obama, Clinton and Reagan
Presidential Economic Performance: Comparing Obama, Clinton and ReaganDavid Doney
 
The Economy under President Obama
The Economy under President ObamaThe Economy under President Obama
The Economy under President ObamaDavid Doney
 

More from David Doney (6)

Understanding the Trump Economy
Understanding the Trump EconomyUnderstanding the Trump Economy
Understanding the Trump Economy
 
Tax Cuts and Jobs Act
Tax Cuts and Jobs ActTax Cuts and Jobs Act
Tax Cuts and Jobs Act
 
Thanksgiving Economics Briefing 2017
Thanksgiving Economics Briefing 2017Thanksgiving Economics Briefing 2017
Thanksgiving Economics Briefing 2017
 
Conservative economic mythology
Conservative economic mythologyConservative economic mythology
Conservative economic mythology
 
Presidential Economic Performance: Comparing Obama, Clinton and Reagan
Presidential Economic Performance: Comparing Obama, Clinton and ReaganPresidential Economic Performance: Comparing Obama, Clinton and Reagan
Presidential Economic Performance: Comparing Obama, Clinton and Reagan
 
The Economy under President Obama
The Economy under President ObamaThe Economy under President Obama
The Economy under President Obama
 

Recently uploaded

Independent Call Girl Number in Kurla Mumbai📲 Pooja Nehwal 9892124323 💞 Full ...
Independent Call Girl Number in Kurla Mumbai📲 Pooja Nehwal 9892124323 💞 Full ...Independent Call Girl Number in Kurla Mumbai📲 Pooja Nehwal 9892124323 💞 Full ...
Independent Call Girl Number in Kurla Mumbai📲 Pooja Nehwal 9892124323 💞 Full ...Pooja Nehwal
 
Dharavi Russian callg Girls, { 09892124323 } || Call Girl In Mumbai ...
Dharavi Russian callg Girls, { 09892124323 } || Call Girl In Mumbai ...Dharavi Russian callg Girls, { 09892124323 } || Call Girl In Mumbai ...
Dharavi Russian callg Girls, { 09892124323 } || Call Girl In Mumbai ...Pooja Nehwal
 
VIP Call Girls LB Nagar ( Hyderabad ) Phone 8250192130 | ₹5k To 25k With Room...
VIP Call Girls LB Nagar ( Hyderabad ) Phone 8250192130 | ₹5k To 25k With Room...VIP Call Girls LB Nagar ( Hyderabad ) Phone 8250192130 | ₹5k To 25k With Room...
VIP Call Girls LB Nagar ( Hyderabad ) Phone 8250192130 | ₹5k To 25k With Room...Suhani Kapoor
 
High Class Call Girls Nagpur Grishma Call 7001035870 Meet With Nagpur Escorts
High Class Call Girls Nagpur Grishma Call 7001035870 Meet With Nagpur EscortsHigh Class Call Girls Nagpur Grishma Call 7001035870 Meet With Nagpur Escorts
High Class Call Girls Nagpur Grishma Call 7001035870 Meet With Nagpur Escortsranjana rawat
 
VIP Call Girls Thane Sia 8617697112 Independent Escort Service Thane
VIP Call Girls Thane Sia 8617697112 Independent Escort Service ThaneVIP Call Girls Thane Sia 8617697112 Independent Escort Service Thane
VIP Call Girls Thane Sia 8617697112 Independent Escort Service ThaneCall girls in Ahmedabad High profile
 
fca-bsps-decision-letter-redacted (1).pdf
fca-bsps-decision-letter-redacted (1).pdffca-bsps-decision-letter-redacted (1).pdf
fca-bsps-decision-letter-redacted (1).pdfHenry Tapper
 
Lundin Gold April 2024 Corporate Presentation v4.pdf
Lundin Gold April 2024 Corporate Presentation v4.pdfLundin Gold April 2024 Corporate Presentation v4.pdf
Lundin Gold April 2024 Corporate Presentation v4.pdfAdnet Communications
 
Instant Issue Debit Cards - School Designs
Instant Issue Debit Cards - School DesignsInstant Issue Debit Cards - School Designs
Instant Issue Debit Cards - School Designsegoetzinger
 
Solution Manual for Financial Accounting, 11th Edition by Robert Libby, Patri...
Solution Manual for Financial Accounting, 11th Edition by Robert Libby, Patri...Solution Manual for Financial Accounting, 11th Edition by Robert Libby, Patri...
Solution Manual for Financial Accounting, 11th Edition by Robert Libby, Patri...ssifa0344
 
(ANIKA) Budhwar Peth Call Girls Just Call 7001035870 [ Cash on Delivery ] Pun...
(ANIKA) Budhwar Peth Call Girls Just Call 7001035870 [ Cash on Delivery ] Pun...(ANIKA) Budhwar Peth Call Girls Just Call 7001035870 [ Cash on Delivery ] Pun...
(ANIKA) Budhwar Peth Call Girls Just Call 7001035870 [ Cash on Delivery ] Pun...ranjana rawat
 
Russian Call Girls In Gtb Nagar (Delhi) 9711199012 💋✔💕😘 Naughty Call Girls Se...
Russian Call Girls In Gtb Nagar (Delhi) 9711199012 💋✔💕😘 Naughty Call Girls Se...Russian Call Girls In Gtb Nagar (Delhi) 9711199012 💋✔💕😘 Naughty Call Girls Se...
Russian Call Girls In Gtb Nagar (Delhi) 9711199012 💋✔💕😘 Naughty Call Girls Se...shivangimorya083
 
Call Girls Service Nagpur Maya Call 7001035870 Meet With Nagpur Escorts
Call Girls Service Nagpur Maya Call 7001035870 Meet With Nagpur EscortsCall Girls Service Nagpur Maya Call 7001035870 Meet With Nagpur Escorts
Call Girls Service Nagpur Maya Call 7001035870 Meet With Nagpur Escortsranjana rawat
 
02_Fabio Colombo_Accenture_MeetupDora&Cybersecurity.pptx
02_Fabio Colombo_Accenture_MeetupDora&Cybersecurity.pptx02_Fabio Colombo_Accenture_MeetupDora&Cybersecurity.pptx
02_Fabio Colombo_Accenture_MeetupDora&Cybersecurity.pptxFinTech Belgium
 
00_Main ppt_MeetupDORA&CyberSecurity.pptx
00_Main ppt_MeetupDORA&CyberSecurity.pptx00_Main ppt_MeetupDORA&CyberSecurity.pptx
00_Main ppt_MeetupDORA&CyberSecurity.pptxFinTech Belgium
 
03_Emmanuel Ndiaye_Degroof Petercam.pptx
03_Emmanuel Ndiaye_Degroof Petercam.pptx03_Emmanuel Ndiaye_Degroof Petercam.pptx
03_Emmanuel Ndiaye_Degroof Petercam.pptxFinTech Belgium
 
Stock Market Brief Deck for 4/24/24 .pdf
Stock Market Brief Deck for 4/24/24 .pdfStock Market Brief Deck for 4/24/24 .pdf
Stock Market Brief Deck for 4/24/24 .pdfMichael Silva
 
Malad Call Girl in Services 9892124323 | ₹,4500 With Room Free Delivery
Malad Call Girl in Services  9892124323 | ₹,4500 With Room Free DeliveryMalad Call Girl in Services  9892124323 | ₹,4500 With Room Free Delivery
Malad Call Girl in Services 9892124323 | ₹,4500 With Room Free DeliveryPooja Nehwal
 
The Economic History of the U.S. Lecture 17.pdf
The Economic History of the U.S. Lecture 17.pdfThe Economic History of the U.S. Lecture 17.pdf
The Economic History of the U.S. Lecture 17.pdfGale Pooley
 
The Economic History of the U.S. Lecture 18.pdf
The Economic History of the U.S. Lecture 18.pdfThe Economic History of the U.S. Lecture 18.pdf
The Economic History of the U.S. Lecture 18.pdfGale Pooley
 
(DIYA) Bhumkar Chowk Call Girls Just Call 7001035870 [ Cash on Delivery ] Pun...
(DIYA) Bhumkar Chowk Call Girls Just Call 7001035870 [ Cash on Delivery ] Pun...(DIYA) Bhumkar Chowk Call Girls Just Call 7001035870 [ Cash on Delivery ] Pun...
(DIYA) Bhumkar Chowk Call Girls Just Call 7001035870 [ Cash on Delivery ] Pun...ranjana rawat
 

Recently uploaded (20)

Independent Call Girl Number in Kurla Mumbai📲 Pooja Nehwal 9892124323 💞 Full ...
Independent Call Girl Number in Kurla Mumbai📲 Pooja Nehwal 9892124323 💞 Full ...Independent Call Girl Number in Kurla Mumbai📲 Pooja Nehwal 9892124323 💞 Full ...
Independent Call Girl Number in Kurla Mumbai📲 Pooja Nehwal 9892124323 💞 Full ...
 
Dharavi Russian callg Girls, { 09892124323 } || Call Girl In Mumbai ...
Dharavi Russian callg Girls, { 09892124323 } || Call Girl In Mumbai ...Dharavi Russian callg Girls, { 09892124323 } || Call Girl In Mumbai ...
Dharavi Russian callg Girls, { 09892124323 } || Call Girl In Mumbai ...
 
VIP Call Girls LB Nagar ( Hyderabad ) Phone 8250192130 | ₹5k To 25k With Room...
VIP Call Girls LB Nagar ( Hyderabad ) Phone 8250192130 | ₹5k To 25k With Room...VIP Call Girls LB Nagar ( Hyderabad ) Phone 8250192130 | ₹5k To 25k With Room...
VIP Call Girls LB Nagar ( Hyderabad ) Phone 8250192130 | ₹5k To 25k With Room...
 
High Class Call Girls Nagpur Grishma Call 7001035870 Meet With Nagpur Escorts
High Class Call Girls Nagpur Grishma Call 7001035870 Meet With Nagpur EscortsHigh Class Call Girls Nagpur Grishma Call 7001035870 Meet With Nagpur Escorts
High Class Call Girls Nagpur Grishma Call 7001035870 Meet With Nagpur Escorts
 
VIP Call Girls Thane Sia 8617697112 Independent Escort Service Thane
VIP Call Girls Thane Sia 8617697112 Independent Escort Service ThaneVIP Call Girls Thane Sia 8617697112 Independent Escort Service Thane
VIP Call Girls Thane Sia 8617697112 Independent Escort Service Thane
 
fca-bsps-decision-letter-redacted (1).pdf
fca-bsps-decision-letter-redacted (1).pdffca-bsps-decision-letter-redacted (1).pdf
fca-bsps-decision-letter-redacted (1).pdf
 
Lundin Gold April 2024 Corporate Presentation v4.pdf
Lundin Gold April 2024 Corporate Presentation v4.pdfLundin Gold April 2024 Corporate Presentation v4.pdf
Lundin Gold April 2024 Corporate Presentation v4.pdf
 
Instant Issue Debit Cards - School Designs
Instant Issue Debit Cards - School DesignsInstant Issue Debit Cards - School Designs
Instant Issue Debit Cards - School Designs
 
Solution Manual for Financial Accounting, 11th Edition by Robert Libby, Patri...
Solution Manual for Financial Accounting, 11th Edition by Robert Libby, Patri...Solution Manual for Financial Accounting, 11th Edition by Robert Libby, Patri...
Solution Manual for Financial Accounting, 11th Edition by Robert Libby, Patri...
 
(ANIKA) Budhwar Peth Call Girls Just Call 7001035870 [ Cash on Delivery ] Pun...
(ANIKA) Budhwar Peth Call Girls Just Call 7001035870 [ Cash on Delivery ] Pun...(ANIKA) Budhwar Peth Call Girls Just Call 7001035870 [ Cash on Delivery ] Pun...
(ANIKA) Budhwar Peth Call Girls Just Call 7001035870 [ Cash on Delivery ] Pun...
 
Russian Call Girls In Gtb Nagar (Delhi) 9711199012 💋✔💕😘 Naughty Call Girls Se...
Russian Call Girls In Gtb Nagar (Delhi) 9711199012 💋✔💕😘 Naughty Call Girls Se...Russian Call Girls In Gtb Nagar (Delhi) 9711199012 💋✔💕😘 Naughty Call Girls Se...
Russian Call Girls In Gtb Nagar (Delhi) 9711199012 💋✔💕😘 Naughty Call Girls Se...
 
Call Girls Service Nagpur Maya Call 7001035870 Meet With Nagpur Escorts
Call Girls Service Nagpur Maya Call 7001035870 Meet With Nagpur EscortsCall Girls Service Nagpur Maya Call 7001035870 Meet With Nagpur Escorts
Call Girls Service Nagpur Maya Call 7001035870 Meet With Nagpur Escorts
 
02_Fabio Colombo_Accenture_MeetupDora&Cybersecurity.pptx
02_Fabio Colombo_Accenture_MeetupDora&Cybersecurity.pptx02_Fabio Colombo_Accenture_MeetupDora&Cybersecurity.pptx
02_Fabio Colombo_Accenture_MeetupDora&Cybersecurity.pptx
 
00_Main ppt_MeetupDORA&CyberSecurity.pptx
00_Main ppt_MeetupDORA&CyberSecurity.pptx00_Main ppt_MeetupDORA&CyberSecurity.pptx
00_Main ppt_MeetupDORA&CyberSecurity.pptx
 
03_Emmanuel Ndiaye_Degroof Petercam.pptx
03_Emmanuel Ndiaye_Degroof Petercam.pptx03_Emmanuel Ndiaye_Degroof Petercam.pptx
03_Emmanuel Ndiaye_Degroof Petercam.pptx
 
Stock Market Brief Deck for 4/24/24 .pdf
Stock Market Brief Deck for 4/24/24 .pdfStock Market Brief Deck for 4/24/24 .pdf
Stock Market Brief Deck for 4/24/24 .pdf
 
Malad Call Girl in Services 9892124323 | ₹,4500 With Room Free Delivery
Malad Call Girl in Services  9892124323 | ₹,4500 With Room Free DeliveryMalad Call Girl in Services  9892124323 | ₹,4500 With Room Free Delivery
Malad Call Girl in Services 9892124323 | ₹,4500 With Room Free Delivery
 
The Economic History of the U.S. Lecture 17.pdf
The Economic History of the U.S. Lecture 17.pdfThe Economic History of the U.S. Lecture 17.pdf
The Economic History of the U.S. Lecture 17.pdf
 
The Economic History of the U.S. Lecture 18.pdf
The Economic History of the U.S. Lecture 18.pdfThe Economic History of the U.S. Lecture 18.pdf
The Economic History of the U.S. Lecture 18.pdf
 
(DIYA) Bhumkar Chowk Call Girls Just Call 7001035870 [ Cash on Delivery ] Pun...
(DIYA) Bhumkar Chowk Call Girls Just Call 7001035870 [ Cash on Delivery ] Pun...(DIYA) Bhumkar Chowk Call Girls Just Call 7001035870 [ Cash on Delivery ] Pun...
(DIYA) Bhumkar Chowk Call Girls Just Call 7001035870 [ Cash on Delivery ] Pun...
 

Income and Wealth Inequality in the United States

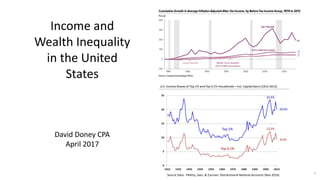
  • 1. Income and Wealth Inequality in the United States David Doney CPA April 2017 1Source Data: Piketty, Saez, & Zucman: Distributional National Accounts (Nov 2016)
  • 2. 2 Income and Wealth Inequality in the U.S. 1. Introduction 2. Causes of Income Inequality 3. Tax Policies 4. Wealth Inequality 5. Debating Inequality
  • 3. Summary 1. Income inequality refers to a disproportionate share of the income going to relatively few. 2. Income and wealth inequality have steadily worsened since 1980, after a period of relative equality 1950-1979. 3. The top 1% of income earners had about 20% of the pre-tax income in 2014, versus 10% prior to 1980. 4. At 1979 levels of equality, the bottom 80% would be getting $11,000 more per year in pre-tax income. 5. The U.S. is roughly 30th percentile globally, meaning 70% of countries have a more equal income distribution. 6. Income inequality may slow economic growth, increase political polarization, and produce social unrest. 7. There are many causes of inequality; it is a by-product of our global economic system and policy choices. 8. An important differentiator between the middle-class and lower incomes is a college degree. 9. Tax policy choices since 1980 have reduced effective tax rates on higher income persons and corporations overall, although tax increases under Presidents Clinton and Obama offset some of the trend. 10. Solutions can be focused on making the distribution of income more equitable before- or after-tax. 11. Examples of pre-tax solutions include raising the minimum wage, stronger unions, protectionism, and reduced low-skill immigration. These affect market outcomes. 12. After-tax solutions include raising taxes on higher incomes, combined with transfers to lower income persons. For example, ACA/Obamacare raised taxes on the top 5% to fund subsidies and Medicaid for lower income persons. 13. U.S. household and non-profit wealth reached a record $93 trillion in 2016, yet recent gains go mainly to the wealthy. 14. Wealth is distributed more unequally than income, with the top 1% owning 42% of the wealth vs. 24% in the 1970’s. 15. Higher corporate profits relative to GDP combined with increasing levels of stock buybacks and dividends are major drivers of wealth inequality, as the top 5% wealthiest own about 70% of the financial assets. 16. Government action to reduce inequality is supported by a majority of Democrats but a minority of Republicans. 3
  • 4. 4CBO: The Distribution of Household Income and Federal Taxes, 2013 +188% +63% +18% Since 1980, income growth has primarily gone to the top 1%
  • 5. Source: Piketty, Saez, Zucman: Distributional National Accounts (Nov 2016) 5 20% 12% Share of pre-tax income by income group  The top 1% now have about 20% of the pre-tax income, versus 10% in 1980.  The bottom 50% now have 12% of the pre-tax income, versus 20% in 1980.  Income inequality statistics tend to lag about 2 years, due to availability of source data.
  • 6. What does this shift mean for families? If the United States shifted income away from the top 1% so that we had the 1979 income distribution:  The bottom 99% of families would each get $7,000 more in annual pre-tax income (or)  The bottom 80% of families would each get $11,000 more in annual pre-tax income Source: Larry Summers “Focus on growth for the middle class” Washington Post. ( January 2015) NYT: Eduardo Porter-Rethinking the Rise of Inequality (Nov 2013) 6
  • 7. Economic & Political Impact of Inequality Slower economic growth  Higher income households spend lower proportion of income  Consumption might be 5% higher ($1 trillion/year) with 1979 inequality Higher household debt & risk of financial crises  Indebted households spend less and are at greater risk of defaulting on debts Social Security financing / budget deficit  More income above taxable threshold ($127,200 in 2017) not taxed Political Impact  Polarization: Two electorates / Two economies  Social unrest Reduced opportunity  Higher inequality corresponds with reduced income mobility (“Great-Gatsby Curve”) Alan Krueger “Chairman Alan Krueger discusses the rise and consequences of inequality…” (January 2012) https://www.whitehouse.gov/blog/2012/01/12/chairman-alan-krueger-discusses-rise-and-consequences-inequality-center-american-pro 7
  • 8. Miles Corak https://milescorak.com/2012/01/12/here-is-the-source-for-the-great-gatsby-curve-in-the-alan-krueger-speech-at-the-center-for-american-progress/ “Great Gatsby” Curve As income inequality worsens, so does income mobility across generations (e.g., children tend to remain in same income group as parents) 8 Less Income Mobility More unequal
  • 9. How Important is Solving the Problem? 9 “I believe this is the defining challenge of our time: Making sure our economy works for every working American. ” “But we know that people’s frustrations run deeper than these most recent political battles. Their frustration is rooted in their own daily battles -- to make ends meet, to pay for college, buy a home, save for retirement. It’s rooted in the nagging sense that no matter how hard they work, the deck is stacked against them. And it’s rooted in the fear that their kids won’t be better off than they were. They may not follow the constant back-and-forth in Washington or all the policy details, but they experience in a very personal way the relentless, decades-long trend that I want to spend some time talking about today. And that is a dangerous and growing inequality and lack of upward mobility that has jeopardized middle- class America’s basic bargain -- that if you work hard, you have a chance to get ahead.” President Barack Obama “Remarks by the President on Economic Mobility” December 4, 2013
  • 10. Inequality is a Moral, Political and Economic Issue 10 Pope Francis denounces “trickle down” economic theories…” Washington Post. November 2013 / Pope Francis Evangelii Gaudium - November 2013 53. Just as the commandment “Thou shalt not kill” sets a clear limit in order to safeguard the value of human life, today we also have to say “thou shalt not” to an economy of exclusion and inequality. Such an economy kills. How can it be that it is not a news item when an elderly homeless person dies of exposure, but it is news when the stock market loses two points? This is a case of exclusion. Can we continue to stand by when food is thrown away while people are starving? This is a case of inequality. Today everything comes under the laws of competition and the survival of the fittest, where the powerful feed upon the powerless. As a consequence, masses of people find themselves excluded and marginalized: without work, without possibilities, without any means of escape. Human beings are themselves considered consumer goods to be used and then discarded. We have created a “throw away” culture which is now spreading. It is no longer simply about exploitation and oppression, but something new. Exclusion ultimately has to do with what it means to be a part of the society in which we live; those excluded are no longer society’s underside or its fringes or its disenfranchised – they are no longer even a part of it. The excluded are not the “exploited” but the outcast, the “leftovers”. 54. In this context, some people continue to defend trickle-down theories which assume that economic growth, encouraged by a free market, will inevitably succeed in bringing about greater justice and inclusiveness in the world. This opinion, which has never been confirmed by the facts, expresses a crude and naïve trust in the goodness of those wielding economic power and in the sacralized workings of the prevailing economic system. Meanwhile, the excluded are still waiting. To sustain a lifestyle which excludes others, or to sustain enthusiasm for that selfish ideal, a globalization of indifference has developed. Almost without being aware of it, we end up being incapable of feeling compassion at the outcry of the poor, weeping for other people’s pain, and feeling a need to help them, as though all this were someone else’s responsibility and not our own. The culture of prosperity deadens us; we are thrilled if the market offers us something new to purchase. In the meantime all those lives stunted for lack of opportunity seem a mere spectacle; they fail to move us.
  • 11. 11 Income and Wealth Inequality in the U.S. 1. Introduction 2. Causes of Income Inequality 3. Tax Policies 4. Wealth Inequality 5. Debating Inequality
  • 12. Source: Inequality for All - Graphics Package http://inequalityforall.com/resources/#/ 12 Income of Top 1% over Long-Run “Great Moderation” (1945-1980)  Stronger unions  Moderate executive pay norms  Higher real minimum wage  Limited immigration  Less international competition  Higher income tax rates on rich
  • 13. “Why is inequality rising? There is some disagreement about this and also some nuance as to exactly which aspect of inequality we're talking about and what kind. Some of the most prominent accounts: Skill-biased technological change. Technological improvements raise incomes, but they do so unevenly. Rewards disproportionately go to highly educated workers. On this view, rising inequality reflects slowing educational progress and better schooling is the key solution. This has been the traditionally dominant view in economics, but it doesn't explain the specific rise of the top 1 percent very well. Immigration. Importing low-skilled workers to do low-paid jobs tends to raise measured income inequality. David Card estimates immigration to be the cause of about 5 percent of the total rise in inequality. Decline of labor unions. Labor unions reduce inequality both by raising wages at the low end and constraining them at the high end. Bruce Western and Jake Rosenfeld estimate that the decline of labor unions as a force in the American economy is responsible for 20 to 33 percent of the overall rise in inequality. Trade. Growing international trade with lower-wage countries such as China seems to have reduced the wage share of overall national income, boosting the incomes of people with large stock holdings. Superstar effects. Because the world is bigger and richer in 2014 than it was in 1964, being a "star" performer — the most popular athlete, author, or singer — is more lucrative than it used to be. Executives and Wall Street. Increased incomes for CEOs and financial sector professionals account for 58 percent of the top 1 percent of the income distribution and 67 percent of the top 0.1 percent. So the specific dynamics of compensation in those areas are wielding a big influence. Minimum wage. David Autor, Alan Manning, and Christopher Smith find that about a third (or possibly as much as half) of the growth in inequality between the median and the bottom ten percent is due to the declining real value of the minimum wage. This is different from the issues about the top end pulling away that normally dominate political discussions of inequality, but it's a noteworthy finding nonetheless. The fundamental nature of capitalism. Thomas Piketty has made waves lately with his new book Capital in the 21st Century, which argues that very high levels of inequality are the natural state of market economies. In his view, it's the economic equality of the mid-twentieth century that needs explaining, not today's inequality.” 13 VOX: Why is Inequality Rising? Source: VOX-Everything You Need to Know About Income Inequality
  • 14.  Union membership rate fell from 20.1% in 1983 to 11.% in 2015.  “Public-sector workers had a union membership rate (35.2 percent) more than five times higher than that of private- sector workers (6.7 percent).”  “Median weekly earnings of nonunion workers ($776) were 79 percent of earnings for workers who were union members ($980).” 14 Source: BLS “Union Members Summary” (2015) Income Inequality and Union Membership (1918-2008) Economic Policy Institute (EPI) Newsletter: Unions and Shared Prosperity http://www.epi.org/news/union-membership-declines-inequality-rises/ Top 10% income share Union participation
  • 15. “Superstar hypothesis” argues similar premium for very top performers in multiple fields. CEO Pay: http://www.epi.org/publication/ceo-and-worker-pay-in-2015/ The Economist, “Who Exactly are the 1%” (January 2012) 15
  • 16. 16 Source: Wikipedia The real minimum wage has fallen relative to its peak during the Great Moderation
  • 17. Source: 1997 Economic Report of the President 17 Labor Substitution: Immigration & Globalization Types of labor substitution  Immigration  Off-shoring / Sourcing overseas  While immigrants increase the supply of labor, they also increase demand, leading to a variety of debates about impact  Studies indicate low-skill immigrants may moderately reduce the wages of workers without high school educations, but do not increase native worker unemployment
  • 18. Source: 1997 Economic Report of the President NYT Eduardo Porter “Rethinking the Rise of Inequality” (Nov 2013) 18 College Premium Through 1995  “In 1980 the median male college graduate earned roughly one-third more than the median male high school graduate, but this wage premium grew to over 70 percent by 1993.”  “Since then that trend has slowed, and the ratio even declined slightly in 1995.”  Separate study (Lemieux 2010) estimated that 60% of the change in wage inequality between 1973 and 2005 due to college premium.  But does it explain the top 1%? 1.7 1.3
  • 19. 19Source: NYT: Eduardo Porter-Rethinking the Rise of Inequality (Nov 2013) While the college premium contributed to worsening inequality 1970-2000, it leveled off and was not a major contributor to further increases thereafter. It does not explain why the 1% are leaving the other college- educated population behind. College Premium Through 2011
  • 20. 20 Why is Inequality Rising? Source: VOX-Everything You Need to Know About Income Inequality •Lax anti-trust enforcement •Anti-union laws •Income tax cuts •Real minimum wage declines •Exec pay norms changed •Superstar effects •College premium •Labor force participation proportional to education •Trade / Offshoring •Low-skill immigration •Decline of unions Global Competition Education Policy / Deregulation Compensation Trends  There are many theories about why inequality has worsened  The reasons behind one income group separating from another vary  For example, the college premium explains much of the difference in income between the middle and lower income groups  Reasons for the 1% leaving others behind are a composite of nearly every factor, with executive pay a key element
  • 21. 21 Income and Wealth Inequality in the U.S. 1. Introduction 2. Causes of Income Inequality 3. Tax Policies 4. Wealth Inequality 5. Debating Inequality
  • 22. 22
  • 23. 23
  • 24. CBO: Top 1% received 12.4% of after-tax income in 2013, versus 7.4% in 1979. Source: CBO “Distribution of Household Income and Federal Taxes 2013” 24
  • 25. U.S. income inequality is high but comparable to other developed nations before taxes and transfers, but the worst after. That is, we redistribute less. We are roughly 30th percentile globally, meaning 70% of countries have a more equal income distribution (Source: CIA World Factbook) Gini index ranges from: 0 (equal) to 1 (unequal) 25 Gornick & Milanovic Income Inequality in Cross-National Perspective (May 2015)
  • 26. Source: NYT Who’s tax rates rose or fell? (April 2012) http://www.nytimes.com/imagepages/2012/04/13/opinion/sunday/0415web-leonhardt.html? Average tax rates for highest incomes cut dramatically since the 1960’s. 26
  • 27. 27CBO: The Distribution of Household Income and Federal Taxes, 2013 2013: Obama allows Bush tax cuts to expire for top 1%
  • 28. 28 ACA/Obamacare raised taxes on the top 5% and used it to fund transfers (subsidies) to lower income groups. Obama also allowed the Bush tax cuts of 2001 and 2003 to expire for the top 1%. These are examples of after- tax solutions for addressing income inequality. Source: CEA Economic Report of the President 2017
  • 29. 29 CBO “The Distribution of Major Tax Expenditures in the Individual Income Tax System” (May 2013) Tax Expenditures (Top 10)  Exclusions from taxable income  Employer-sponsored health insurance  Net pension contributions and earnings (401k)  Capital gains on assets transferred at death  A portion of Social Security and Retirement benefits  Itemized deductions  Certain taxes paid to state and local governments  Mortgage interest payments  Charitable contributions  Preferential tax rates on capital gains and dividends  Tax credits  The earned income tax credit, and  The child tax credit. Top 10: About $1 trillion per year impact on federal budget
  • 30. 30CBO “The Distribution of Major Tax Expenditures in the Individual Income Tax System” (May 2013) 17% 13% 9% 12% 51%
  • 31. 31 CBO “The Distribution of Major Tax Expenditures in the Individual Income Tax System” (May 2013) Major Tax Expenditures for the 1% in 2013 ($ Billions)
  • 32. 32 Income and Wealth Inequality in the U.S. 1. Introduction 2. Causes of Income Inequality 3. Tax Policies 4. Wealth Inequality 5. Debating Inequality
  • 33. Household Net Worth 2000-2016 33 Our economy is a tremendous wealth engine…but the distribution is highly uneven.  The top 1% had 42% of the wealth in 2015, vs. 36% in 2007 and 24% in 1979  $93 trillion is about $700,000 / household on average, but bottom 50% average $11,000
  • 36. Janet Yellen speech “Perspectives on Inequality and Opportunity…” (October 17, 2014) https://www.federalreserve.gov/newsevents/speech/yellen20141017a.htm 36 The Great Recession damaged highly- leveraged homeowners in particular Bottom 50% of households have an average net worth of $11,000.
  • 37. Janet Yellen speech “Perspectives on Inequality and Opportunity…” (October 17, 2014) https://www.federalreserve.gov/newsevents/speech/yellen20141017a.htm 37 CBO: Family average wealth [2013]  Top 10% = $4 million  51st to 90th = $316,000  26th to 50th = $36,000  0 to 25th = $13,000 in debt. CBO Trends in Family Wealth, 1989 to 2013  76% of income gains 2009- 2013 went to top 1%.
  • 38. 38 Pew Center “The many ways to measure inequality” (September 22, 2015) http://www.pewresearch.org/fact-tank/2015/09/22/the-many-ways-to-measure-economic-inequality/
  • 39. 39 Top 5% have 72% of the financial wealth (stocks & bonds) So stock market appreciation, dividends, and stock buybacks disproportionally benefit them Source: Who Rules America? G. William Donhoff (UC Santa Cruz)
  • 41. Buybacks and dividends are a major upward redistribution method for wealth More companies are doing stock buybacks, and in greater amounts Buybacks & dividends around $900B annualized rate in 2015 & early 2016 For scale, non-residential (business) investment was ~$2.2T in 2016 Top 5% own 72% of the financial assets Chart: Yardeni Research (January 2017) http://www.yardeni.com/Pub/buybackdiv.pdf William Lazonic “Profits without Prosperity” / HBR September 2014. https://hbr.org/2014/09/profits-without-prosperity 41
  • 42. Source: Krugman / Wells Microeconomics 3rd edition 42 Is the “Free Market” always right? Output is higher and prices lower in perfect competition, which is better for consumers (labor) but less advantageous to capital (owners). As industries concentrate and deregulation weakens anti-trust enforcement, outcomes look more like oligopoly and monopoly than perfect competition, meaning prices are higher and output lower. In other words, we have market failure; regulation is required to get the optimal market outcome! This worsens inequality, as corporate profits are distributed to higher-income and wealth households.
  • 43. 43 Income and Wealth Inequality in the U.S. 1. Introduction 2. Causes of Income Inequality 3. Tax Policies 4. Wealth Inequality 5. Debating Inequality
  • 44. Debating Income Inequality “There’s class warfare, all right, but it’s my class, the rich class, that’s making war, and we’re winning.” -- Warren Buffett (2006) Ben Stein “In Class Warfare, Guess which class is winning?” NYT, Nov 2006. http://www.nytimes.com/2006/11/26/business/yourmoney/26every.html 44
  • 45. Polls 45 Pew Center: “Most Americans say U.S. economic system is unfair…” (Feb 2016) http://www.pewresearch.org/fact-tank/2016/02/10/most-americans-say-u-s-economic-system-is-unfair-but-high-income-republicans-disagree/
  • 46. Market Income “Pre-Distribution”  Education (all ages)  Retraining / Life-long learning  Minimum wage  Unions / labor power  Limit labor substitution  Profit sharing / 401k match  Restrict buybacks and dividends  Cultural shifts and awareness Addressing Income & Wealth Inequality After-Tax Income “Redistribution”  Raise income tax rates on high incomes  Minimum effective tax rate / “Buffett Rule”  Remove cap on payroll tax  Treat all sources of income similarly  Reduce “tax expenditures” for wealthy  Minimum effective tax rates Transfers  Increase earned income tax credit  Expand healthcare subsidies & Medicaid  Medicare for All For wealth inequality  Raise estate taxes  Sovereign wealth fund 46
  • 48. Statistical Summary Table 48 Note: CBO income inequality numbers typically show the same trends, but are different than the Piketty, Saez, & Zucman figures. See example in table for after-tax income share of top 1%.
  • 49. Source: Piketty, Saez, Zucman: Distributional National Accounts (Nov 2016) 49
  • 50. Sources 50 CBO: The Distribution of Household Income and Federal Taxes, 2013 https://www.cbo.gov/publication/51361 CBO: Trends in Family Wealth, 1989-2013 https://www.cbo.gov/publication/51846 VOX: Everything you need to know about income inequality http://www.vox.com/cards/income-inequality

Editor's Notes

  1. If there are 100 families in the U.S., the richest 1 family has $20. The other 99 families have $80 spread among them.
  2. Note similar graph pattern to union participation and minimum wage relative to inequality.
  3. Media, sports
  4. Globalized supply chains / container management / more routine transaction work overseas
  5. Why those without college degrees left behind
  6. Diagram through 2004, so Bush tax cuts
  7. Clinton tax hikes in the 1990’s reversed by Bush tax cuts; which were allowed to expire.
  8. Counter-arguments: Class warfare, tax flight, dislike of welfare (self-esteem, helping minorities), denial of existence of inequality or denial
  9. Counter-arguments: Class warfare, tax flight, dislike of welfare (self-esteem, helping minorities), denial of existence of inequality or denial