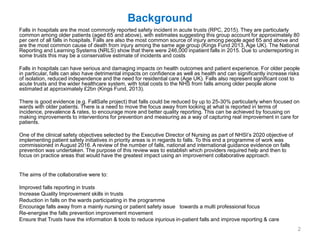
NHS Improvement
Falls Collaborative case studies
#improvefalls
Background
Falls in hospitals are the most commonly reported safety incident in acute trusts (RPC, 2015). They are particularly
common among older patients (aged 65 and above), with estimates suggesting this group account for approximately 80
per cent of all falls in hospitals. Falls are also the most common source of injury among people aged 65 and above and
are the most common cause of death from injury among the same age group (Kings Fund 2013, Age UK). The National
Reporting and Learning Systems (NRLS) show that there were 246,000 inpatient falls in 2015. Due to underreporting in
some trusts this may be a conservative estimate of incidents and costs
Falls in hospitals can have serious and damaging impacts on health outcomes and patient experience. For older people
in particular, falls can also have detrimental impacts on confidence as well as health and can significantly increase risks
of isolation, reduced independence and the need for residential care (Age UK). Falls also represent significant cost to
acute trusts and the wider healthcare system, with total costs to the NHS from falls among older people alone
estimated at approximately £2bn (Kings Fund, 2013).
There is good evidence (e.g. FallSafe project) that falls could be reduced by up to 25-30% particularly when focused on
wards with older patients. There is a need to move the focus away from looking at what is reported in terms of
incidence, prevalence & rates, to encourage more and better quality reporting. This can be achieved by focusing on
making improvements to interventions for prevention and measuring as a way of capturing real improvement in care for
patients.
One of the clinical safety objectives selected by the Executive Director of Nursing as part of NHSI’s 2020 objective of
implementing patient safety initiatives in priority areas is in regards to falls. To this end a programme of work was
commissioned in August 2016. A review of the number of falls, national and international guidance evidence on falls
prevention was undertaken. The purpose of this review was to establish which providers required help and then to
focus on practice areas that would have the greatest impact using an improvement collaborative approach.
The aims of the collaborative were to:
Improved falls reporting in trusts
Increase Quality Improvement skills in trusts
Reduction in falls on the wards participating in the programme
Encourage falls away from a mainly nursing or patient safety issue towards a multi professional focus
Re-energise the falls prevention improvement movement
Ensure that Trusts have the information & tools to reduce injurious in-patient falls and improve reporting & care
2
Introduction
• As part of the collaborative offer at each of the programme days
case studies from exemplar trusts were presented
• This resource has been to support Trusts who did not participate in
the collaborative to have access to the case studies.
3
Contents
4
Focus Slide no.
Royal Free NHS Foundation Trust 5 - 34
Rotherham, Doncaster & South Humber Foundation Trust 35 - 66
Huddle up for Safer Healthcare 66 - 99
Case Study
Royal Free NHS Foundation Trust
Geetika Singh
Patient Safety Programme Manager
The Royal Free NHS Foundation Trust
24/7 Falls Free Care:
Using IHI breakthrough series
collaborative approach to reduce in-
patient harm from falls
Geetika Singh, Patient Safety Programme Manager
Sarah Rigby, Patient Safety Programme Workstream Lead
Basil Francis, Patient Safety Programme Data Analyst
Background
• July 2014, Royal Free London NHS Foundation Trust (RFL) became one
of the largest trusts in the UK by acquiring Barnet and Chase Farm
hospitals (BCF).
• In-patient falls are the second highest reported clinical incident within the
trust.
• All hospital sites implemented a variety of interventions in a variety of
ways to address inpatient falls.
• As RFL, we identified and grouped interventions that led to successful
outcomes.
What was needed?
Unique and Innovative
quality improvement
approach in falls
prevention to bring a
large scale change
Collaborative
approach
Building
improvement
capability for
long term
sustainability
Partnership
Model of
improvement
whereby
patient and
staff
engagement
are the
foundations to
our quality
improvement
programme.
Knowledge of
science of
improvement
Subject matter
knowledge
Quality Improvement Methodology
The Breakthrough Series - IHI’s Collaborative Model for Achieving Breakthrough Improvement, 2013
By 31 March 2018:
• To reduce trust
wide falls rate by
25%.
• To reduce rate of
falls from harm
(moderate,
severe harm or
death) by 20%.
Driver Diagram
Aim Primary Drivers Secondary Drivers Specific ideas to Test
Reliable and
timely
multifactorial
assessment
Reliable and
timely
multifactorial
interventions
Education of
staff, patient
and
family/carers
Understanding
local trends/
themes
Patient specific falls risk
assessment
Staff understand local falls risk to
patients
Falls prevention programme for
staff
Falls care plans developed after
patient risk assessments
Communication of falls risk
status
Falls prevention information for
patient and families
Staff trained and know how to
use assessment tools
Patient specific bedrails risk
assessment
Falls Prevention tool
Staff education on falls tool
Carry out mini RCA for inpatient fall
Create induction leaflet for new staff
and agency staff
Use of visual cues at bedside
Integrate falls risks in ward
handovers and safety briefings
Handover stickers in patients notes
Age UK leaflets
Clear signage
Posters in toilets
Develop training resource
Deliver training programme as per
dosing formula & regular schedule
Develop dosing formula
Monthly analyses of DATIX data
By 31 March 2018:
• To reduce trust
wide falls rate by
25%.
• To reduce rate of
falls from harm
(moderate,
severe harm or
death) by 20%.
Driver Diagram
Aim Primary Drivers Secondary Drivers Specific ideas to Test
Understanding
local trends/
themes
Staff understand local falls risk to
patients
Carry out mini RCA for inpatient fall
Monthly analyses of DATIX data
Understanding trends and themes
• Organisational Level:
• Pareto charts were used to
identify wards we should be
going to  source was DATIX
• Team’s engagement and
readiness to change
• Participating ward level:
• Pareto charts to identify the
most common risk factors of
falls  Source was DATIX
• Case note review to
understand common themes.
Case Note Review
• Derived from:
• FallSafe project
• Transforming Care at
the Bedside:
Reducing Patient
Injuries from Falls,
2012
By 31 March 2018:
• To reduce trust
wide falls rate by
25%.
• To reduce rate of
falls from harm
(moderate,
severe harm or
death) by 20%.
Driver Diagram
Aim Primary Drivers Secondary Drivers Specific ideas to Test
Reliable and
timely
multifactorial
assessment
Reliable and
timely
multifactorial
interventions
Understanding
local trends/
themes
Patient specific falls risk
assessment
Staff understand local falls risk to
patients
Falls care plans developed after
patient risk assessments
Communication of falls risk
status
Staff trained and know how to
use assessment tools
Patient specific bedrails risk
assessment
Falls Prevention tool
Staff education on falls tool
Carry out mini RCA for inpatient fall
Monthly analyses of DATIX data
Page 1 Page 2
Page 3 Page 4
Measures
OutcomeMeasures
1. Number of falls
per 1000 occupied
bed days (OBDs)
2. Number of falls
with outcome of
moderate severe,
harm or death per
1000 OBDs
ProcessMeasures
1.No of hours it took to
complete falls assessment
after the patient admission to
the ward.
2. No of hours it took to
review falls assessment from
the previous assessment.
3. No of hours it took to
complete or review falls
prevention plan.
4. No of hours it took to
complete or review bedrail
assessment .
5. % of pts, who fell during
their stay in a ward, received
after falls care as per post
falls protocol within 24hrs
BalancingMeasures
1. % of eligible falls risk pts
receiving specialing services.
2. Patient feedback
3. Staff feedback (patient
safety culture survey).
Quality of care provided:
Post in patient falls case note review and sharing the finding with ward staff.
Designing and testing of
measurement tool
Designing and testing of
measurement tool
• FallSafe
• National Inpt
falls audit
Falls shared
drive
Measurement Tool –version 1
Version 14
Version 14
Version 14
Version 14
Leaving
patients alone
in the toilet/on a
commode is
extremely high
risk; balance
the risk of injury
from a fall, with
the patient's
need for dignity’
Version 14
Version 14
Version 14
Sharing Data
Sharing data
Quality of care provided:
Post in patient falls case note review
and sharing the finding with ward staff.
Celebrating Success
Celebrating 730 days without a
fall with harm
10 wards 10 story boards
On-going temperature check of
safety survey
‘All Learn All teach’
Patient Safety Culture Survey
0 0.5 1 1.5 2 2.5 3 3.5 4 4.5 5
10. I have made mistake that had the potential to harm patients
7. I always receive a detailed handover of falls r isk for patients in my care
5. The culture in my area makes it easy to learn from the mistakes of others.
16. Disagreements in this clinical area are resolved appropriately (i.e., not…
13. There is a widespread adherence to clinical guidelines and evidence…
3. I am involved in regular safety briefings where falls are discussed
17. There is a comprehensive investigation of influencing/other/ human…
4. As a team, we discuss learning from falls incidents
11. All staff in the organisation take responsibility for patient safety
2. Falls are handled appropriately in my area
6. In my area, it is easy to speak up if I perceive a problem with patient care
12. Patient safety is constantly reinforced as a priority in my area
15. I feel confident in explaining what has happened to a patient or family…
1. I would feel safe being treated here as a patient
9. When I am involved in a patient fall I always complete an incident…
8. I would want a comprehensive checklist completed for my procedure.
14. I report incidents to improve patient safety and practice
Average Score
Average Score for Responses to Patient Safety Culture Survey
Falls Learning Session 1, 2 & 3
Learning Session 1 Learning Session 2 Learning Session 3
Lessons learned
• Establishing and supporting champion role is crucial for any
improvement work. One champion is never enough.
• Celebrate success no matter how small.
• Integrating the falls measurement tool into ward routine and
sustaining on-going data collection.
• Timely and regular feedback of ward data. Understanding what
matters to the ward in terms of feeding back data.
Journey so far
We are here
THANK YOU
FOR FURTHER INFORMATION CONTACT:
GEETIKA.SINGH@NHS.NET
RDaSH & FallSafe…
Our story
Sharon Greensill
Trust Physiotherapy Professional Lead
Liz Copley Consultant Occupational Therapist
Older People Mental Health
Today’s Presentation
• FallSafe in RDaSH …. where and why did it begin
• How was it rolled out and what we learned –
• How wards organised themselves around picking which
bundle component to focus on
• Implementation and and how progress was
supported/measured
• MDT quality improvement work..
• Dementia friendly environmental adjustments
FallSafe: What inspired the RDaSH project?
• In line with the national picture, RDaSH in-patient falls rates varied ward and area to the next
(some of this explainable some not)
• Built naturally on from previous work and RCPhys; NF& BH Audits
• Ongoing checking/updating of work at NPSA, ‘How to prevent..’ guides.
• Wanted to better understand our data and also contribute
• to national benchmarking for mental health
… but mainly….
• In 2014 Commissioners set us a CQUIN for a 25% reduction in
inpatient falls rates!
It tends to focus the mind !!!!!
WHY?
RDaSH FallSafe
Launched in 2014
STEP 1- The start
• Launch event
• Representatives from each area- key
focus to get people on board
• Selling the concept
• Discussing the anxieties and fears
• Discussing the positives
• Next steps
STEP 2- ownership
• Identifying leads and champions – for
each area-
RDaSH ownership –
Brand RDaSH
Designed our own logo
Bags, badges, stickers
Internal drivers
• CQUIN payment/ targets set against baseline
• Challenge- not at start of falls prevention work
Previous work had significantly reduced falls
rates
already.
SO WHAT WAS BASELINE
• Spent a lot of time on cleaning up data with data
analyst – this was key
• Data analysis ****
STEP 3 – local ownership
• Leads formed ward based teams – skills
mix, ‘who’ was key
• Held their own launch events
• Local ownership
• What worked well … AHP’s , support
workers
STEP 4
• Team tasks and approaches
– Planned for each stage – selecting bundles,
looking at how they could be rolled out, identifying
training and other needs related to this
– Feedback/ learning from areas as part of PDSA
approach – monthly audits
– Ward ‘fallsafe’ walk rounds
– mapping patient journeys,
– ‘splat’ diagrams’..
pretty much followed the Fallsafe
book!
Implementation: a staged approach
What we learned
• FallSafe Leads in place – their individual level
of engagement and interest was key
• Ward based FallSafe teams, leads had
different ways engaging whole staff group and
building up the approach
• Choosing the components of care bundles –
picked most ‘do-able’ first. Differed by areas
• Added care bundles every few weeks/ months
rates led by leads and team
• monthly audits involved audit facilitator
• Sustaining momentum
• Had second event follow up event after 6
months- teams presented their progress and
shared ideas .. Should have done more of
this, but logistics difficult
Falls Prevention what else
have we done
FALLSAFE IN PRACTICE
Walkabout findings as drivers
• Difficulties with bed sensors – what did we
find
• Handrails on wards- which guide to
destinations
• Chair heights
• Space between tables in dining areas
• Gardens slopes and access
• Environmental layout
What did we do
Night time bedroom falls
• Night lights/ bed sensors
• Low Beds / Mats
• Lighting
• Observations
• Sleep hygiene/person centred care
re sleep
• Sleep charts before sedation
General falls
• Individual plans re mobility status
• Physio assessment within 48 hours for all
patients admitted OPMHS
• Mobility status logged on ward boards for
whole team awareness
• Falls risk assessment by nursing staff
completed in 12 hours but usually in
admission-simplified assessment
Patients
• Footwear
• Walking Aids – roll out of training to issue
walking aids by ward staff. Checking of
walking aids – ferrules, where from,
wheels
• Clothing – belts, braces
• Hydration – ice pops, ice lollies
Patients
• History – side of bed, night time toileting, falls
• Toileting plans
• Medication – culprit MDT
• Lying or sitting standing BP for every pt on
admission
• Urinalysis for every pt on admission
• Physio/OT – spatial awareness, strength and
balance exs, engagement , activity
occupation
Environment
Principles of Supportive Design
• The environment supports meaningful interaction
between staff
• Supports eating and drinking
• Supports mobility
• Supports continence and independence
• Supports orientation
• Kitwood’s needs- ask are these supported by the
environment?
Comfort , Identity, Occupation, Inclusion, Attachment
Dementia Friendly Environments and principles of
supportive design: King’s Fund EHE
Environment
• Colour – use of colour in our environments
• Flooring – to reduce risk of harm from falls
• Lighting – linked to managing BPSD
• Layout – Breaking up spaces
• Signage – pictures and names at correct
height – eye level
• Signage – pictures and names at correct
height – eye level
• Interactive artworks and memorabilia –
conversation points. Pictures on corridor
walls
• Places to walk - resting points – chairs on
corridors.
• Orientation
Calendars, large face clocks in
every bedroom
Photographs of local scenes
Signs denoting location / ward and
name
LEGIBILITY - aided by
• Clear sight lines
• Even lighting, avoid shadows
• Matt, even coloured flooring
• Noise reduction, Uncluttered spaces
• COLOUR CONTRAST very important
WAYFINDING - helped by
• Accent colours
• Identification of spaces using appropriate reference
objects
Dementia Friendly Environments and principles of
supportive design: King’s Fund EHE
Pictures on
corridors
Pictures of local
interest
Up to present day and
onwards…
• Vision
• Postive risk taking ? Reducing 1:1’s
• Falls in dementia patients remain key focus
Dementia and Vision/ Perception
Damage to occipital and parietal lobe
• Illusions – distortion of reality
• Misperceptions – ‘best guess’ distorted information
• Misidentifications –problems identifying objects, places
or people
• Problems in processing visual information e.g.
recognising contrast, depth, distance, colour, spatial
awareness difficulties, way-finding problems
exacerbated if lighting is poor or contributing to the
person’s confusion
Context: supportive environments matter
Challenges going forward
• Positive risk taking versus managing risks
• Environments themselves
• Maintaining momentum
• Teaching the new…. Almost circle of
starting
again
Key Factors
Organisational ownership - bottom to
top
Resources and skill mix
Making it the norm
MDT *******
Training
• Every new doctor has training
• 3 year module based training using e
learning RCP
• Learning from Incident
• Learning from Serious Incidents
HUSH: a systematic approach to
reducing harm and addressing Safety
Culture at the frontline
Alison Lovatt - Clinical Network Director
April 2017
‘A team of improvement
scientists, patient safety
experts and clinicians who
are committed to working
with frontline services,
patients and the public to
deliver real and lasting
change for the region.’
Yorkshire and Humber AHSN Improvement
Academy
Bring about lasting change
Improvement
Science
Ensure evidence
based solutions
become routine
practice
Co-create
improvement with
frontline clinicians,
patients and public
Address
professional and
geographical
isolation through
network learning
Established May 2013
• Increase improvement capability for Y&H
• Complement what organizations already
do
• Exchange ideas in local, national and
international networks
• Clinically led - not telling people what to
do!
• Mobilize our applied research
Why an Improvement Academy?
Yorkshire and Humber
“In the end, culture will trump
rules, standards and control
strategies every single time, and
achieving a vastly safer NHS will
depend far more on major
cultural change than on a new
regulatory regime”.
Don Berwick 2013
A culture of safety
An environment, where everyone regardless of
their title or grade, feels safe to speak up. No
one is hesitant to voice a concern about a
patient or the plan.
When staff do speak up, they are treated with
respect and have confidence that leadership
will act upon their concerns; a cycle of trust.
Psychological Safety
Our theory…..
is that if you equip teams with
insight into how they perceive they
work as a team and how safe they
feel their care is then they will take
action to improve things.
By highlighting any dysfunction and
emphasising its link to safety,
teams may “sort themselves out”
Sometimes the results indicate a
team needs “therapy” before they
can improve.
In addition……..
• Our observation is that this is an improvement
intervention in itself and helps teams realise
their potential.
• It’s not a tool for Management.
• There is always some cause for celebration and
sometimes the results dispel myths about teams.
• The majority of the elements are within the gift of
the team to address themselves
• The before and after measurement is helpful but
need not be the focus.
• Culture should be measured at clinical unit level
“Teams with positive concordant perceptions on their unit provide
safer and better care
Disparate scoring in teams is a strong indicator of dysfunctional
culture”
• An effective team is far more able to recognise when things are
going wrong than any one individual.
• A team that works together well is a safe team
• Clinicians’ perception is often that it’s a great team………..
• How positively nursing input is received particularly by Doctors
correlates with patient outcomes.
And the Evidence………
Reducing central line infections in Michigan
Teams with higher culture scores on
teamwork were more likely to reach
goal of no central line infections
44% reached goal in upper third of culture
scores
21% reached goal in lower third of culture
scores
Assessment of Safety
Culture
• 28 questions in total
• Background information
• Confidential (includes personal
identifiers) data collection and
anonymised reporting
• Additional Q:
“28. Please give your unit an
overall grade on patient safety”
Principles
• Data belongs to teams not management. Free to
use the analysis as they wish.
• Teams must have feedback and a “conversation”
• Point in time. Take at face value don’t need to
over analyse, interpret, justify or defend.
• Team decides what to do. Have further support if
they want and Management listen.
Safety Huddles:
bringing fun to the frontline
Improvement and continual
learning led by frontline teams
in Yorkshire
Patient Safety Huddles
Key Characteristics: marginal gains
• Informed by QI tools and visual feedback
– Review of days since last harm
• Focused meeting about one or more agreed patient harm/s
– Who are the patients most likely at risk of harm?
• Agreed actions
– set of team/individual actions (aimed at reducing risk of patient harm)
• Multidisciplinary frontline team invited to attend
– including non-clinical
• Senior clinical leadership
– Non-judgemental environment and All team staff empowered to speak up
• Daily (Monday - Friday as minimum).
– Predictable time and venue (appropriate to team and context)
– Brief (5-15 minutes)
• Celebration and recognition of milestones
Barriers
• “We haven’t got time”
• “We already do this” Board Round/MDT
• “We can’t reduce falls, it’s what are
patients do”
• “All our patients are at risk”
• “We’ll never get the Consultants on board”
• There’s not a time when we can all gather”
What's the difference between
a huddle & a handover?
Safety Huddle Handover
Brief 5-10 minutes Can take up to 1 hour
MDT – all included, all levels Often just professionals
Anticipatory Often reactive
Focussed on specific harm/s – safety
focussed
Covers everything!
Patient focused/ Action focused Team management tool
Patients of concern All patients
Enablers: what do teams need from
a coach
• A coach
• Encouragement to have a go
• Trust and patience
• Left alone to learn; teams self correct
• Don’t performance manage; it’s not
necessary Not everyone has to be on board
from day one
• Flexibility to adapt the principles to their
environment and patients.
The Safety Huddle …
ignites a spirit of learning
Making measurement visible
“We are achieving results now, that none of us thought were possible 12
months ago”
Consultant Medicine for Older People, LTHT
The Safety Huddle …
ignites a spirit of learning
Brings the team together to act:
Own the data, own the actions and
anticipate
The Safety Huddle …
ignites a spirit of learning
Addressing Teamwork
& Safety Culture
Evidence of Impact
Culture
Wards where Teamwork and Safety Climate
surveys have been repeated after reaching
embedded huddles have shown overall
patient safety ratings of ‘good/excellent’
progressed from 77% and 43.5% in the first
survey to 95% and 79% at second survey,
with an overall trend to more positive
answers across the survey.
The Safety Huddle …
ignites a spirit of learning
*** Celebrating Success ***
Evidence of Impact:
Ward level
Moved from LTHT
to Leeds
Community Care
Evidence of Impact At Scale:
Leeds Teaching hospitals
Safety Culture
Wards where Teamwork and
Safety Climate surveys have been
repeated after reaching embedded
huddles have shown overall
patient safety ratings of
‘good/excellent’ progressed from
77% and 43.5% in the first survey
to 95% and 79% at second
survey, with an overall trend to
more positive answers across the
survey.
Return on
Investment of 388%
Contact Details
www.improvementacademy.org
y@yhahsn.nhs.uk
@Improve_Academy
@HUSH_Safe
# < >

Falls collaborative case studies

  • 1.
    NHS Improvement Falls Collaborativecase studies #improvefalls
  • 2.
    Background Falls in hospitalsare the most commonly reported safety incident in acute trusts (RPC, 2015). They are particularly common among older patients (aged 65 and above), with estimates suggesting this group account for approximately 80 per cent of all falls in hospitals. Falls are also the most common source of injury among people aged 65 and above and are the most common cause of death from injury among the same age group (Kings Fund 2013, Age UK). The National Reporting and Learning Systems (NRLS) show that there were 246,000 inpatient falls in 2015. Due to underreporting in some trusts this may be a conservative estimate of incidents and costs Falls in hospitals can have serious and damaging impacts on health outcomes and patient experience. For older people in particular, falls can also have detrimental impacts on confidence as well as health and can significantly increase risks of isolation, reduced independence and the need for residential care (Age UK). Falls also represent significant cost to acute trusts and the wider healthcare system, with total costs to the NHS from falls among older people alone estimated at approximately £2bn (Kings Fund, 2013). There is good evidence (e.g. FallSafe project) that falls could be reduced by up to 25-30% particularly when focused on wards with older patients. There is a need to move the focus away from looking at what is reported in terms of incidence, prevalence & rates, to encourage more and better quality reporting. This can be achieved by focusing on making improvements to interventions for prevention and measuring as a way of capturing real improvement in care for patients. One of the clinical safety objectives selected by the Executive Director of Nursing as part of NHSI’s 2020 objective of implementing patient safety initiatives in priority areas is in regards to falls. To this end a programme of work was commissioned in August 2016. A review of the number of falls, national and international guidance evidence on falls prevention was undertaken. The purpose of this review was to establish which providers required help and then to focus on practice areas that would have the greatest impact using an improvement collaborative approach. The aims of the collaborative were to: Improved falls reporting in trusts Increase Quality Improvement skills in trusts Reduction in falls on the wards participating in the programme Encourage falls away from a mainly nursing or patient safety issue towards a multi professional focus Re-energise the falls prevention improvement movement Ensure that Trusts have the information & tools to reduce injurious in-patient falls and improve reporting & care 2
  • 3.
    Introduction • As partof the collaborative offer at each of the programme days case studies from exemplar trusts were presented • This resource has been to support Trusts who did not participate in the collaborative to have access to the case studies. 3
  • 4.
    Contents 4 Focus Slide no. RoyalFree NHS Foundation Trust 5 - 34 Rotherham, Doncaster & South Humber Foundation Trust 35 - 66 Huddle up for Safer Healthcare 66 - 99
  • 5.
    Case Study Royal FreeNHS Foundation Trust Geetika Singh Patient Safety Programme Manager The Royal Free NHS Foundation Trust
  • 6.
    24/7 Falls FreeCare: Using IHI breakthrough series collaborative approach to reduce in- patient harm from falls Geetika Singh, Patient Safety Programme Manager Sarah Rigby, Patient Safety Programme Workstream Lead Basil Francis, Patient Safety Programme Data Analyst
  • 7.
    Background • July 2014,Royal Free London NHS Foundation Trust (RFL) became one of the largest trusts in the UK by acquiring Barnet and Chase Farm hospitals (BCF). • In-patient falls are the second highest reported clinical incident within the trust. • All hospital sites implemented a variety of interventions in a variety of ways to address inpatient falls. • As RFL, we identified and grouped interventions that led to successful outcomes.
  • 8.
    What was needed? Uniqueand Innovative quality improvement approach in falls prevention to bring a large scale change Collaborative approach Building improvement capability for long term sustainability Partnership Model of improvement whereby patient and staff engagement are the foundations to our quality improvement programme. Knowledge of science of improvement Subject matter knowledge
  • 9.
    Quality Improvement Methodology TheBreakthrough Series - IHI’s Collaborative Model for Achieving Breakthrough Improvement, 2013
  • 10.
    By 31 March2018: • To reduce trust wide falls rate by 25%. • To reduce rate of falls from harm (moderate, severe harm or death) by 20%. Driver Diagram Aim Primary Drivers Secondary Drivers Specific ideas to Test Reliable and timely multifactorial assessment Reliable and timely multifactorial interventions Education of staff, patient and family/carers Understanding local trends/ themes Patient specific falls risk assessment Staff understand local falls risk to patients Falls prevention programme for staff Falls care plans developed after patient risk assessments Communication of falls risk status Falls prevention information for patient and families Staff trained and know how to use assessment tools Patient specific bedrails risk assessment Falls Prevention tool Staff education on falls tool Carry out mini RCA for inpatient fall Create induction leaflet for new staff and agency staff Use of visual cues at bedside Integrate falls risks in ward handovers and safety briefings Handover stickers in patients notes Age UK leaflets Clear signage Posters in toilets Develop training resource Deliver training programme as per dosing formula & regular schedule Develop dosing formula Monthly analyses of DATIX data
  • 11.
    By 31 March2018: • To reduce trust wide falls rate by 25%. • To reduce rate of falls from harm (moderate, severe harm or death) by 20%. Driver Diagram Aim Primary Drivers Secondary Drivers Specific ideas to Test Understanding local trends/ themes Staff understand local falls risk to patients Carry out mini RCA for inpatient fall Monthly analyses of DATIX data
  • 12.
    Understanding trends andthemes • Organisational Level: • Pareto charts were used to identify wards we should be going to  source was DATIX • Team’s engagement and readiness to change • Participating ward level: • Pareto charts to identify the most common risk factors of falls  Source was DATIX • Case note review to understand common themes.
  • 13.
    Case Note Review •Derived from: • FallSafe project • Transforming Care at the Bedside: Reducing Patient Injuries from Falls, 2012
  • 14.
    By 31 March2018: • To reduce trust wide falls rate by 25%. • To reduce rate of falls from harm (moderate, severe harm or death) by 20%. Driver Diagram Aim Primary Drivers Secondary Drivers Specific ideas to Test Reliable and timely multifactorial assessment Reliable and timely multifactorial interventions Understanding local trends/ themes Patient specific falls risk assessment Staff understand local falls risk to patients Falls care plans developed after patient risk assessments Communication of falls risk status Staff trained and know how to use assessment tools Patient specific bedrails risk assessment Falls Prevention tool Staff education on falls tool Carry out mini RCA for inpatient fall Monthly analyses of DATIX data
  • 15.
  • 16.
  • 17.
    Measures OutcomeMeasures 1. Number offalls per 1000 occupied bed days (OBDs) 2. Number of falls with outcome of moderate severe, harm or death per 1000 OBDs ProcessMeasures 1.No of hours it took to complete falls assessment after the patient admission to the ward. 2. No of hours it took to review falls assessment from the previous assessment. 3. No of hours it took to complete or review falls prevention plan. 4. No of hours it took to complete or review bedrail assessment . 5. % of pts, who fell during their stay in a ward, received after falls care as per post falls protocol within 24hrs BalancingMeasures 1. % of eligible falls risk pts receiving specialing services. 2. Patient feedback 3. Staff feedback (patient safety culture survey). Quality of care provided: Post in patient falls case note review and sharing the finding with ward staff.
  • 18.
    Designing and testingof measurement tool
  • 19.
    Designing and testingof measurement tool • FallSafe • National Inpt falls audit Falls shared drive
  • 20.
  • 21.
  • 22.
  • 23.
  • 24.
    Version 14 Leaving patients alone inthe toilet/on a commode is extremely high risk; balance the risk of injury from a fall, with the patient's need for dignity’
  • 25.
  • 26.
  • 27.
  • 28.
  • 29.
    Sharing data Quality ofcare provided: Post in patient falls case note review and sharing the finding with ward staff.
  • 30.
    Celebrating Success Celebrating 730days without a fall with harm 10 wards 10 story boards On-going temperature check of safety survey ‘All Learn All teach’
  • 31.
    Patient Safety CultureSurvey 0 0.5 1 1.5 2 2.5 3 3.5 4 4.5 5 10. I have made mistake that had the potential to harm patients 7. I always receive a detailed handover of falls r isk for patients in my care 5. The culture in my area makes it easy to learn from the mistakes of others. 16. Disagreements in this clinical area are resolved appropriately (i.e., not… 13. There is a widespread adherence to clinical guidelines and evidence… 3. I am involved in regular safety briefings where falls are discussed 17. There is a comprehensive investigation of influencing/other/ human… 4. As a team, we discuss learning from falls incidents 11. All staff in the organisation take responsibility for patient safety 2. Falls are handled appropriately in my area 6. In my area, it is easy to speak up if I perceive a problem with patient care 12. Patient safety is constantly reinforced as a priority in my area 15. I feel confident in explaining what has happened to a patient or family… 1. I would feel safe being treated here as a patient 9. When I am involved in a patient fall I always complete an incident… 8. I would want a comprehensive checklist completed for my procedure. 14. I report incidents to improve patient safety and practice Average Score Average Score for Responses to Patient Safety Culture Survey Falls Learning Session 1, 2 & 3 Learning Session 1 Learning Session 2 Learning Session 3
  • 32.
    Lessons learned • Establishingand supporting champion role is crucial for any improvement work. One champion is never enough. • Celebrate success no matter how small. • Integrating the falls measurement tool into ward routine and sustaining on-going data collection. • Timely and regular feedback of ward data. Understanding what matters to the ward in terms of feeding back data.
  • 33.
  • 34.
    THANK YOU FOR FURTHERINFORMATION CONTACT: GEETIKA.SINGH@NHS.NET
  • 35.
    RDaSH & FallSafe… Ourstory Sharon Greensill Trust Physiotherapy Professional Lead Liz Copley Consultant Occupational Therapist Older People Mental Health
  • 36.
    Today’s Presentation • FallSafein RDaSH …. where and why did it begin • How was it rolled out and what we learned – • How wards organised themselves around picking which bundle component to focus on • Implementation and and how progress was supported/measured • MDT quality improvement work.. • Dementia friendly environmental adjustments
  • 37.
    FallSafe: What inspiredthe RDaSH project? • In line with the national picture, RDaSH in-patient falls rates varied ward and area to the next (some of this explainable some not) • Built naturally on from previous work and RCPhys; NF& BH Audits • Ongoing checking/updating of work at NPSA, ‘How to prevent..’ guides. • Wanted to better understand our data and also contribute • to national benchmarking for mental health … but mainly…. • In 2014 Commissioners set us a CQUIN for a 25% reduction in inpatient falls rates! It tends to focus the mind !!!!! WHY?
  • 38.
  • 39.
    STEP 1- Thestart • Launch event • Representatives from each area- key focus to get people on board • Selling the concept • Discussing the anxieties and fears • Discussing the positives • Next steps
  • 40.
    STEP 2- ownership •Identifying leads and champions – for each area- RDaSH ownership – Brand RDaSH Designed our own logo Bags, badges, stickers
  • 41.
    Internal drivers • CQUINpayment/ targets set against baseline • Challenge- not at start of falls prevention work Previous work had significantly reduced falls rates already. SO WHAT WAS BASELINE • Spent a lot of time on cleaning up data with data analyst – this was key • Data analysis ****
  • 42.
    STEP 3 –local ownership • Leads formed ward based teams – skills mix, ‘who’ was key • Held their own launch events • Local ownership • What worked well … AHP’s , support workers
  • 43.
    STEP 4 • Teamtasks and approaches – Planned for each stage – selecting bundles, looking at how they could be rolled out, identifying training and other needs related to this – Feedback/ learning from areas as part of PDSA approach – monthly audits – Ward ‘fallsafe’ walk rounds – mapping patient journeys, – ‘splat’ diagrams’.. pretty much followed the Fallsafe book!
  • 44.
    Implementation: a stagedapproach What we learned • FallSafe Leads in place – their individual level of engagement and interest was key • Ward based FallSafe teams, leads had different ways engaging whole staff group and building up the approach • Choosing the components of care bundles – picked most ‘do-able’ first. Differed by areas
  • 45.
    • Added carebundles every few weeks/ months rates led by leads and team • monthly audits involved audit facilitator • Sustaining momentum • Had second event follow up event after 6 months- teams presented their progress and shared ideas .. Should have done more of this, but logistics difficult
  • 46.
    Falls Prevention whatelse have we done FALLSAFE IN PRACTICE
  • 47.
    Walkabout findings asdrivers • Difficulties with bed sensors – what did we find • Handrails on wards- which guide to destinations • Chair heights • Space between tables in dining areas • Gardens slopes and access • Environmental layout
  • 48.
    What did wedo Night time bedroom falls • Night lights/ bed sensors • Low Beds / Mats • Lighting • Observations • Sleep hygiene/person centred care re sleep • Sleep charts before sedation
  • 49.
    General falls • Individualplans re mobility status • Physio assessment within 48 hours for all patients admitted OPMHS • Mobility status logged on ward boards for whole team awareness • Falls risk assessment by nursing staff completed in 12 hours but usually in admission-simplified assessment
  • 50.
    Patients • Footwear • WalkingAids – roll out of training to issue walking aids by ward staff. Checking of walking aids – ferrules, where from, wheels • Clothing – belts, braces • Hydration – ice pops, ice lollies
  • 51.
    Patients • History –side of bed, night time toileting, falls • Toileting plans • Medication – culprit MDT • Lying or sitting standing BP for every pt on admission • Urinalysis for every pt on admission • Physio/OT – spatial awareness, strength and balance exs, engagement , activity occupation
  • 52.
    Environment Principles of SupportiveDesign • The environment supports meaningful interaction between staff • Supports eating and drinking • Supports mobility • Supports continence and independence • Supports orientation • Kitwood’s needs- ask are these supported by the environment? Comfort , Identity, Occupation, Inclusion, Attachment Dementia Friendly Environments and principles of supportive design: King’s Fund EHE
  • 53.
    Environment • Colour –use of colour in our environments • Flooring – to reduce risk of harm from falls • Lighting – linked to managing BPSD • Layout – Breaking up spaces • Signage – pictures and names at correct height – eye level
  • 54.
    • Signage –pictures and names at correct height – eye level • Interactive artworks and memorabilia – conversation points. Pictures on corridor walls • Places to walk - resting points – chairs on corridors.
  • 55.
    • Orientation Calendars, largeface clocks in every bedroom Photographs of local scenes Signs denoting location / ward and name
  • 56.
    LEGIBILITY - aidedby • Clear sight lines • Even lighting, avoid shadows • Matt, even coloured flooring • Noise reduction, Uncluttered spaces • COLOUR CONTRAST very important WAYFINDING - helped by • Accent colours • Identification of spaces using appropriate reference objects Dementia Friendly Environments and principles of supportive design: King’s Fund EHE
  • 57.
  • 58.
  • 61.
    Up to presentday and onwards… • Vision • Postive risk taking ? Reducing 1:1’s • Falls in dementia patients remain key focus
  • 62.
    Dementia and Vision/Perception Damage to occipital and parietal lobe • Illusions – distortion of reality • Misperceptions – ‘best guess’ distorted information • Misidentifications –problems identifying objects, places or people • Problems in processing visual information e.g. recognising contrast, depth, distance, colour, spatial awareness difficulties, way-finding problems exacerbated if lighting is poor or contributing to the person’s confusion Context: supportive environments matter
  • 63.
    Challenges going forward •Positive risk taking versus managing risks • Environments themselves • Maintaining momentum • Teaching the new…. Almost circle of starting again
  • 64.
    Key Factors Organisational ownership- bottom to top Resources and skill mix Making it the norm MDT *******
  • 65.
    Training • Every newdoctor has training • 3 year module based training using e learning RCP • Learning from Incident • Learning from Serious Incidents
  • 66.
    HUSH: a systematicapproach to reducing harm and addressing Safety Culture at the frontline Alison Lovatt - Clinical Network Director April 2017
  • 67.
    ‘A team ofimprovement scientists, patient safety experts and clinicians who are committed to working with frontline services, patients and the public to deliver real and lasting change for the region.’ Yorkshire and Humber AHSN Improvement Academy Bring about lasting change Improvement Science Ensure evidence based solutions become routine practice Co-create improvement with frontline clinicians, patients and public Address professional and geographical isolation through network learning Established May 2013
  • 68.
    • Increase improvementcapability for Y&H • Complement what organizations already do • Exchange ideas in local, national and international networks • Clinically led - not telling people what to do! • Mobilize our applied research Why an Improvement Academy?
  • 69.
  • 70.
    “In the end,culture will trump rules, standards and control strategies every single time, and achieving a vastly safer NHS will depend far more on major cultural change than on a new regulatory regime”. Don Berwick 2013
  • 71.
    A culture ofsafety An environment, where everyone regardless of their title or grade, feels safe to speak up. No one is hesitant to voice a concern about a patient or the plan. When staff do speak up, they are treated with respect and have confidence that leadership will act upon their concerns; a cycle of trust. Psychological Safety
  • 73.
    Our theory….. is thatif you equip teams with insight into how they perceive they work as a team and how safe they feel their care is then they will take action to improve things. By highlighting any dysfunction and emphasising its link to safety, teams may “sort themselves out” Sometimes the results indicate a team needs “therapy” before they can improve.
  • 74.
    In addition…….. • Ourobservation is that this is an improvement intervention in itself and helps teams realise their potential. • It’s not a tool for Management. • There is always some cause for celebration and sometimes the results dispel myths about teams. • The majority of the elements are within the gift of the team to address themselves • The before and after measurement is helpful but need not be the focus.
  • 75.
    • Culture shouldbe measured at clinical unit level “Teams with positive concordant perceptions on their unit provide safer and better care Disparate scoring in teams is a strong indicator of dysfunctional culture” • An effective team is far more able to recognise when things are going wrong than any one individual. • A team that works together well is a safe team • Clinicians’ perception is often that it’s a great team……….. • How positively nursing input is received particularly by Doctors correlates with patient outcomes. And the Evidence………
  • 76.
    Reducing central lineinfections in Michigan Teams with higher culture scores on teamwork were more likely to reach goal of no central line infections 44% reached goal in upper third of culture scores 21% reached goal in lower third of culture scores
  • 78.
    Assessment of Safety Culture •28 questions in total • Background information • Confidential (includes personal identifiers) data collection and anonymised reporting • Additional Q: “28. Please give your unit an overall grade on patient safety”
  • 79.
    Principles • Data belongsto teams not management. Free to use the analysis as they wish. • Teams must have feedback and a “conversation” • Point in time. Take at face value don’t need to over analyse, interpret, justify or defend. • Team decides what to do. Have further support if they want and Management listen.
  • 83.
  • 84.
    Improvement and continual learningled by frontline teams in Yorkshire
  • 85.
    Patient Safety Huddles KeyCharacteristics: marginal gains • Informed by QI tools and visual feedback – Review of days since last harm • Focused meeting about one or more agreed patient harm/s – Who are the patients most likely at risk of harm? • Agreed actions – set of team/individual actions (aimed at reducing risk of patient harm) • Multidisciplinary frontline team invited to attend – including non-clinical • Senior clinical leadership – Non-judgemental environment and All team staff empowered to speak up • Daily (Monday - Friday as minimum). – Predictable time and venue (appropriate to team and context) – Brief (5-15 minutes) • Celebration and recognition of milestones
  • 86.
    Barriers • “We haven’tgot time” • “We already do this” Board Round/MDT • “We can’t reduce falls, it’s what are patients do” • “All our patients are at risk” • “We’ll never get the Consultants on board” • There’s not a time when we can all gather”
  • 87.
    What's the differencebetween a huddle & a handover? Safety Huddle Handover Brief 5-10 minutes Can take up to 1 hour MDT – all included, all levels Often just professionals Anticipatory Often reactive Focussed on specific harm/s – safety focussed Covers everything! Patient focused/ Action focused Team management tool Patients of concern All patients
  • 88.
    Enablers: what doteams need from a coach • A coach • Encouragement to have a go • Trust and patience • Left alone to learn; teams self correct • Don’t performance manage; it’s not necessary Not everyone has to be on board from day one • Flexibility to adapt the principles to their environment and patients.
  • 89.
    The Safety Huddle… ignites a spirit of learning Making measurement visible “We are achieving results now, that none of us thought were possible 12 months ago” Consultant Medicine for Older People, LTHT
  • 90.
    The Safety Huddle… ignites a spirit of learning Brings the team together to act: Own the data, own the actions and anticipate
  • 91.
    The Safety Huddle… ignites a spirit of learning Addressing Teamwork & Safety Culture
  • 94.
    Evidence of Impact Culture Wardswhere Teamwork and Safety Climate surveys have been repeated after reaching embedded huddles have shown overall patient safety ratings of ‘good/excellent’ progressed from 77% and 43.5% in the first survey to 95% and 79% at second survey, with an overall trend to more positive answers across the survey.
  • 95.
    The Safety Huddle… ignites a spirit of learning *** Celebrating Success ***
  • 96.
  • 97.
    Moved from LTHT toLeeds Community Care
  • 98.
    Evidence of ImpactAt Scale: Leeds Teaching hospitals Safety Culture Wards where Teamwork and Safety Climate surveys have been repeated after reaching embedded huddles have shown overall patient safety ratings of ‘good/excellent’ progressed from 77% and 43.5% in the first survey to 95% and 79% at second survey, with an overall trend to more positive answers across the survey. Return on Investment of 388%
  • 99.

Editor's Notes

  • #2 Title slide with embedded images
  • #6 Title slide with embedded images
  • #36 i.e. don’t waste time and resources on things that do not work!
  • #53  ‘Multi-modal approaches’ are supported by evidence The environment supports meaningful interaction between staff   Does the approach to the ward/unit/ department look and feel welcoming? Is there an obvious reception desk? Does the ward/department give a good first impression ie, does it look clean, tidy and cared for? Are there obvious social areas, such as day rooms? Are the chairs in these social areas arranged in small clusters that encourage conversation? Are other activities encouraged in social areas rather than just passively watching TV? Can staff observe unobtrusively, while being seen themselves, in all areas of the ward/ department/unit? The environment supports wellbeing Is the level of light comfortable and appropriate for what patients want to do in the space? Is it possible to adjust the light levels according to the time of day and care needs? Is the lighting even eg without pools of light and/or dark areas, stripes or shadows? Is the lighting designed to support normal sleep and wake patterns? Is there good natural light in bed areas and social spaces? Are personal objects, including self-care items, situated where the patient can find them? Are views of nature maximised? Are links to nature maximised, eg, by the use of natural materials, colours, artefacts and artworks? Do patients have independent access to outside space eg garden, courtyard, terrace, that it is safe for them to use? The environment supports eating and drinking Do patients and/or their relatives have constant independent access to hot and cold drinks? Do patients have independent access to snacks and finger food? Is the crockery and glassware of familiar design and in a distinctive colour that contrasts with tables and trays? Is there a space where patients can eat together away from the bedside? The environments supports mobility   Is the flooring matt rather than shiny? Could the lighting or natural light from windows make the floor appear to be wet or slippery? Is the flooring in a colour that contrasts with the walls and furniture? Is the flooring a consistent colour, ie does not have speckles or pebble effects? Are there handrails in the corridors? Are the handrails in a colour that contrasts with the walls? Is it possible to grasp the handrails properly? Is there space for patients to walk around independently? Are there small seating areas for people to rest along corridors and/or by the reception desk? Are there points of interest eg photographs or tactile artworks, along the corridors? The environment supports continence and independence Can the signs to the toilets be seen from all patient areas? Do all toilets and bathrooms have the same clear signage? Are all toilet doors painted in a single distinctive colour? Are the toilet seats, flush handles and rails in a colour that contrasts with the toilet/bathroom walls and floor? Are the flushes and taps of a traditional design? Are basins and baths of familiar design? The environment supports orientation Do doors have a panel you can see through or do they open against the wall to show where they lead to? Do signs on doors, eg, for toilets or day rooms, use both pictures and words? Are signs hung at a height (approximately 4 foot/1.21m) that makes viewing them easy? Are pictures/objects and/or colours used to help patients find their way around? Are bedrooms/bed spaces personalised, eg, through the use of numbers, accent colours, memory boxes, or personal photographs? Is there a large-face clock easily visible from the bedside? Are patients able to see a calendar in the ward?   The environment supports calm and security   Are notices kept to a minimum to avoid distraction and confusion? Are spaces clutter free? Have noise absorbent surfaces been used eg on floors to aid noise reduction? Is noise kept at a level that will enable patients to relax and concentrate? Do patients have any control over the sounds they hear, eg can they listen to their own choice of music? Are doors to exits, ‘staff only’ areas, etc, disguised, eg by painting the doors and door handles in the same colours as the walls? Are patients cared for in the least restrictive environment possible while maintaining the appropriate level of security, eg, bed rails only used following a comprehensive individual assessment ? Are safety and security measures, eg, baffle locks, window restrictors and alarms, as discreet as possible? Are all hazardous liquids and solids, eg, cleaning materials, locked away? Is there clear signage in the ward showing the name of the hospital and the ward?
  • #54 Low levels of lighting commonplace, particular problems with shadows and inadequate ‘task lighting’ Lack of natural light Glare from light fittings, direct view above bed/ sitting area Significantly different light levels from area to area – so adaptation problems moving from room to room Poor control – switching / dimming/ personal control Lack of suitable lighting in bedrooms and bathrooms Lack of awareness of staff – setting levels for their own ‘eyes’ unaware of affect of light on mood, activity levels, sleep Lack of lighting expertise into planning stage of buildings
  • #57 OUTCOMES Easing decision-making Reducing agitation and distress Encouraging independence and social interaction Promoting safety Enabling activities of daily living
  • #63 Our eyes work less well as we get older At age 60 need 3x more light than at age 20 On average a person with sight loss compared with a person with ‘normal’ vision needs 4-5 times more Lux Level Blurring commonplace, some medication affects vision Loss of peripheral vision Problems caused by specific eye diseases, including glaucoma, macular degeneration and diseases which affect visual cortex in brain, damage to occipital lobe and parietal lobe
  • #69 Acknowledging that research on its own (even applied research) doesn’t change anything
  • #85 Huddles used in safety critical industries for many years. More recently being applied in a range of other contexts including healthcare (espec in US – picture is Veterans Association Healthcare), Very recently being picked up in policy circles (cf Scottish Health Secretary statement) Have received research attention and increasing evidence Situation Awareness for Everyone (S.A.F.E) is a two year programme led by the RCPCH which, in partnership with 12 hospitals, is developing and trialling a suite of quality improvement techniques. Over the course of the two years, it aims to reduce preventable deaths and error occurring in the UK’s paediatric departments – currently there are an estimated 2,000 preventable deaths each year compared to the best performing countries in Western Europe. The programme will trial models of care including the ‘huddle’ technique - a ten minute free, frank exchange of information between clinical and non-clinical professionals involved in a patient’s care – in a bid to encourage information sharing and to equip professionals with the skills to spot when a child’s condition is deteriorating as well as prevent missed diagnosis. The huddle technique is one of a number of techniques aimed at improving patient safety, as described by Dr Peter Lachman, S.A.F.E National Clinical Lead, and others involved in the programme in the video below: