Download as PDF, PPTX


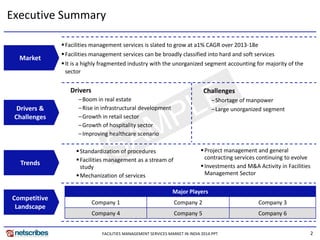
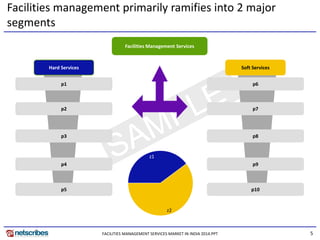
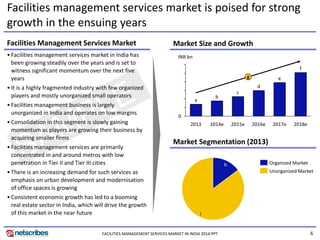
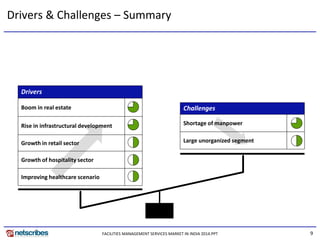
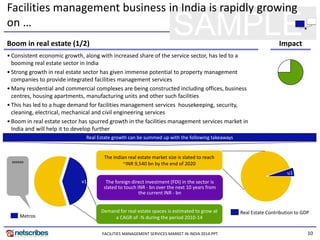
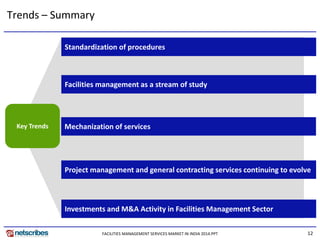
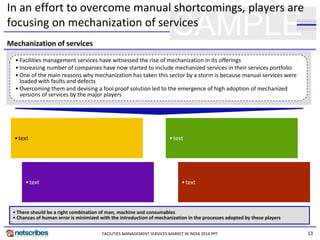

The document provides an overview of the facilities management services market in India. It finds that the market is slated to grow at a 1% CAGR from 2013 to 2018. Facilities management services can be categorized as hard services like mechanical and electrical maintenance or soft services like cleaning and security. The market is highly fragmented with many small, unorganized players. Key drivers of growth include the booming real estate sector, rising infrastructure development, and growth in retail and hospitality. Shortage of manpower and the large unorganized segment pose challenges to the industry. Trends include standardization, facilities management becoming a field of study, mechanization of services, and investments and M&A activity. The document outlines some of the major players


