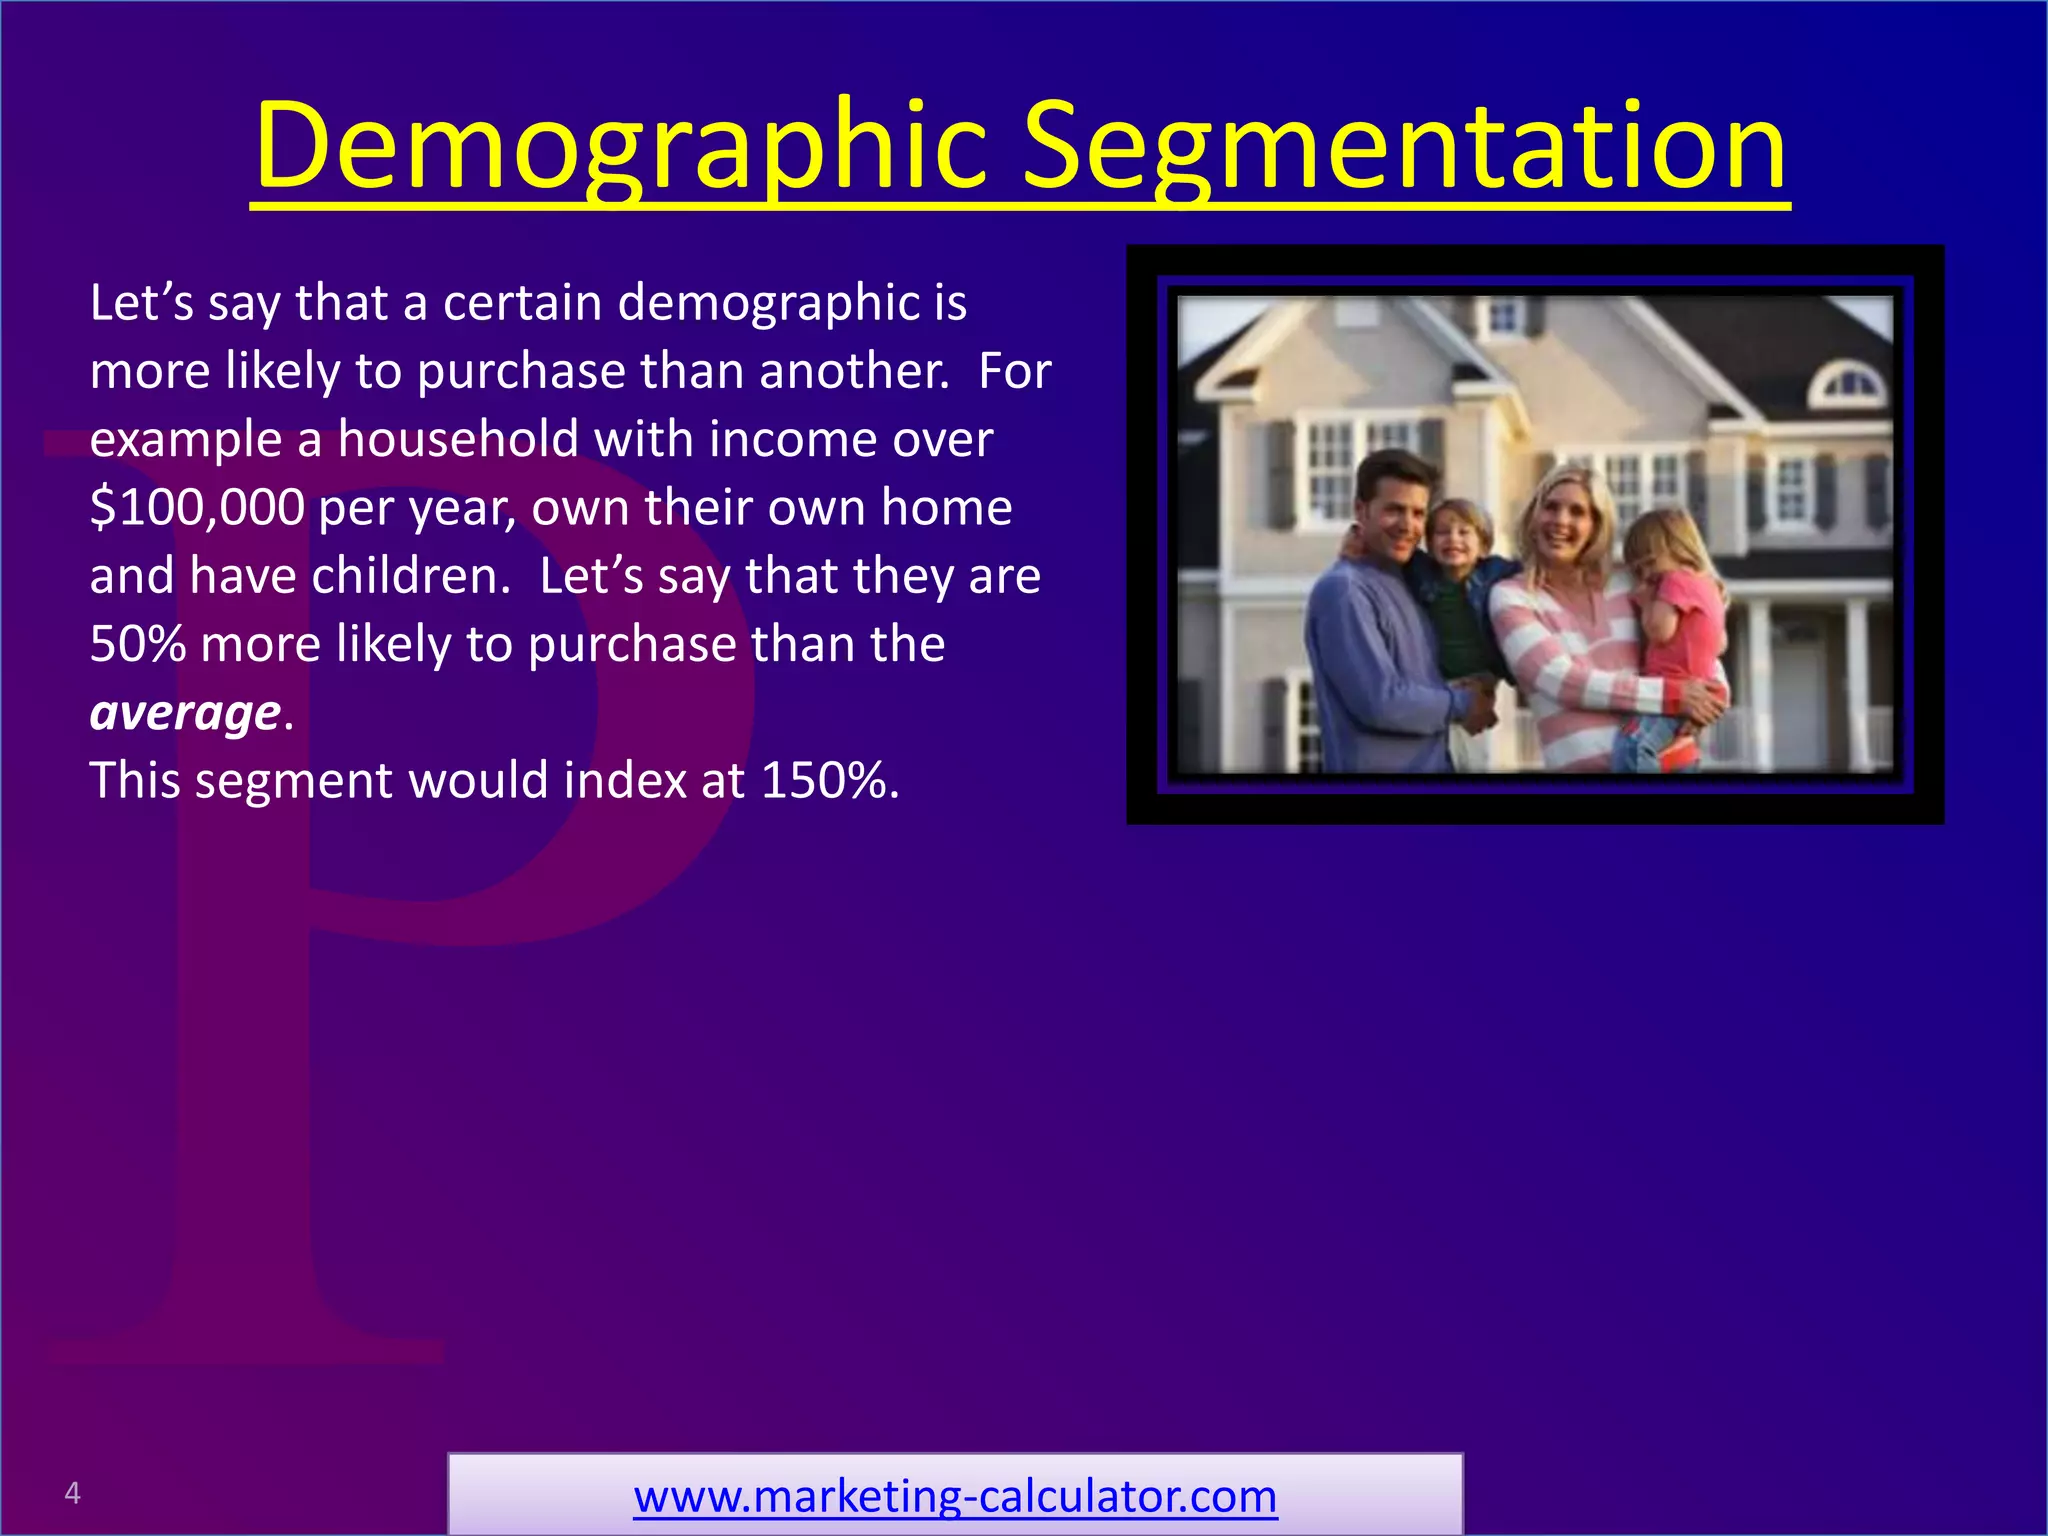
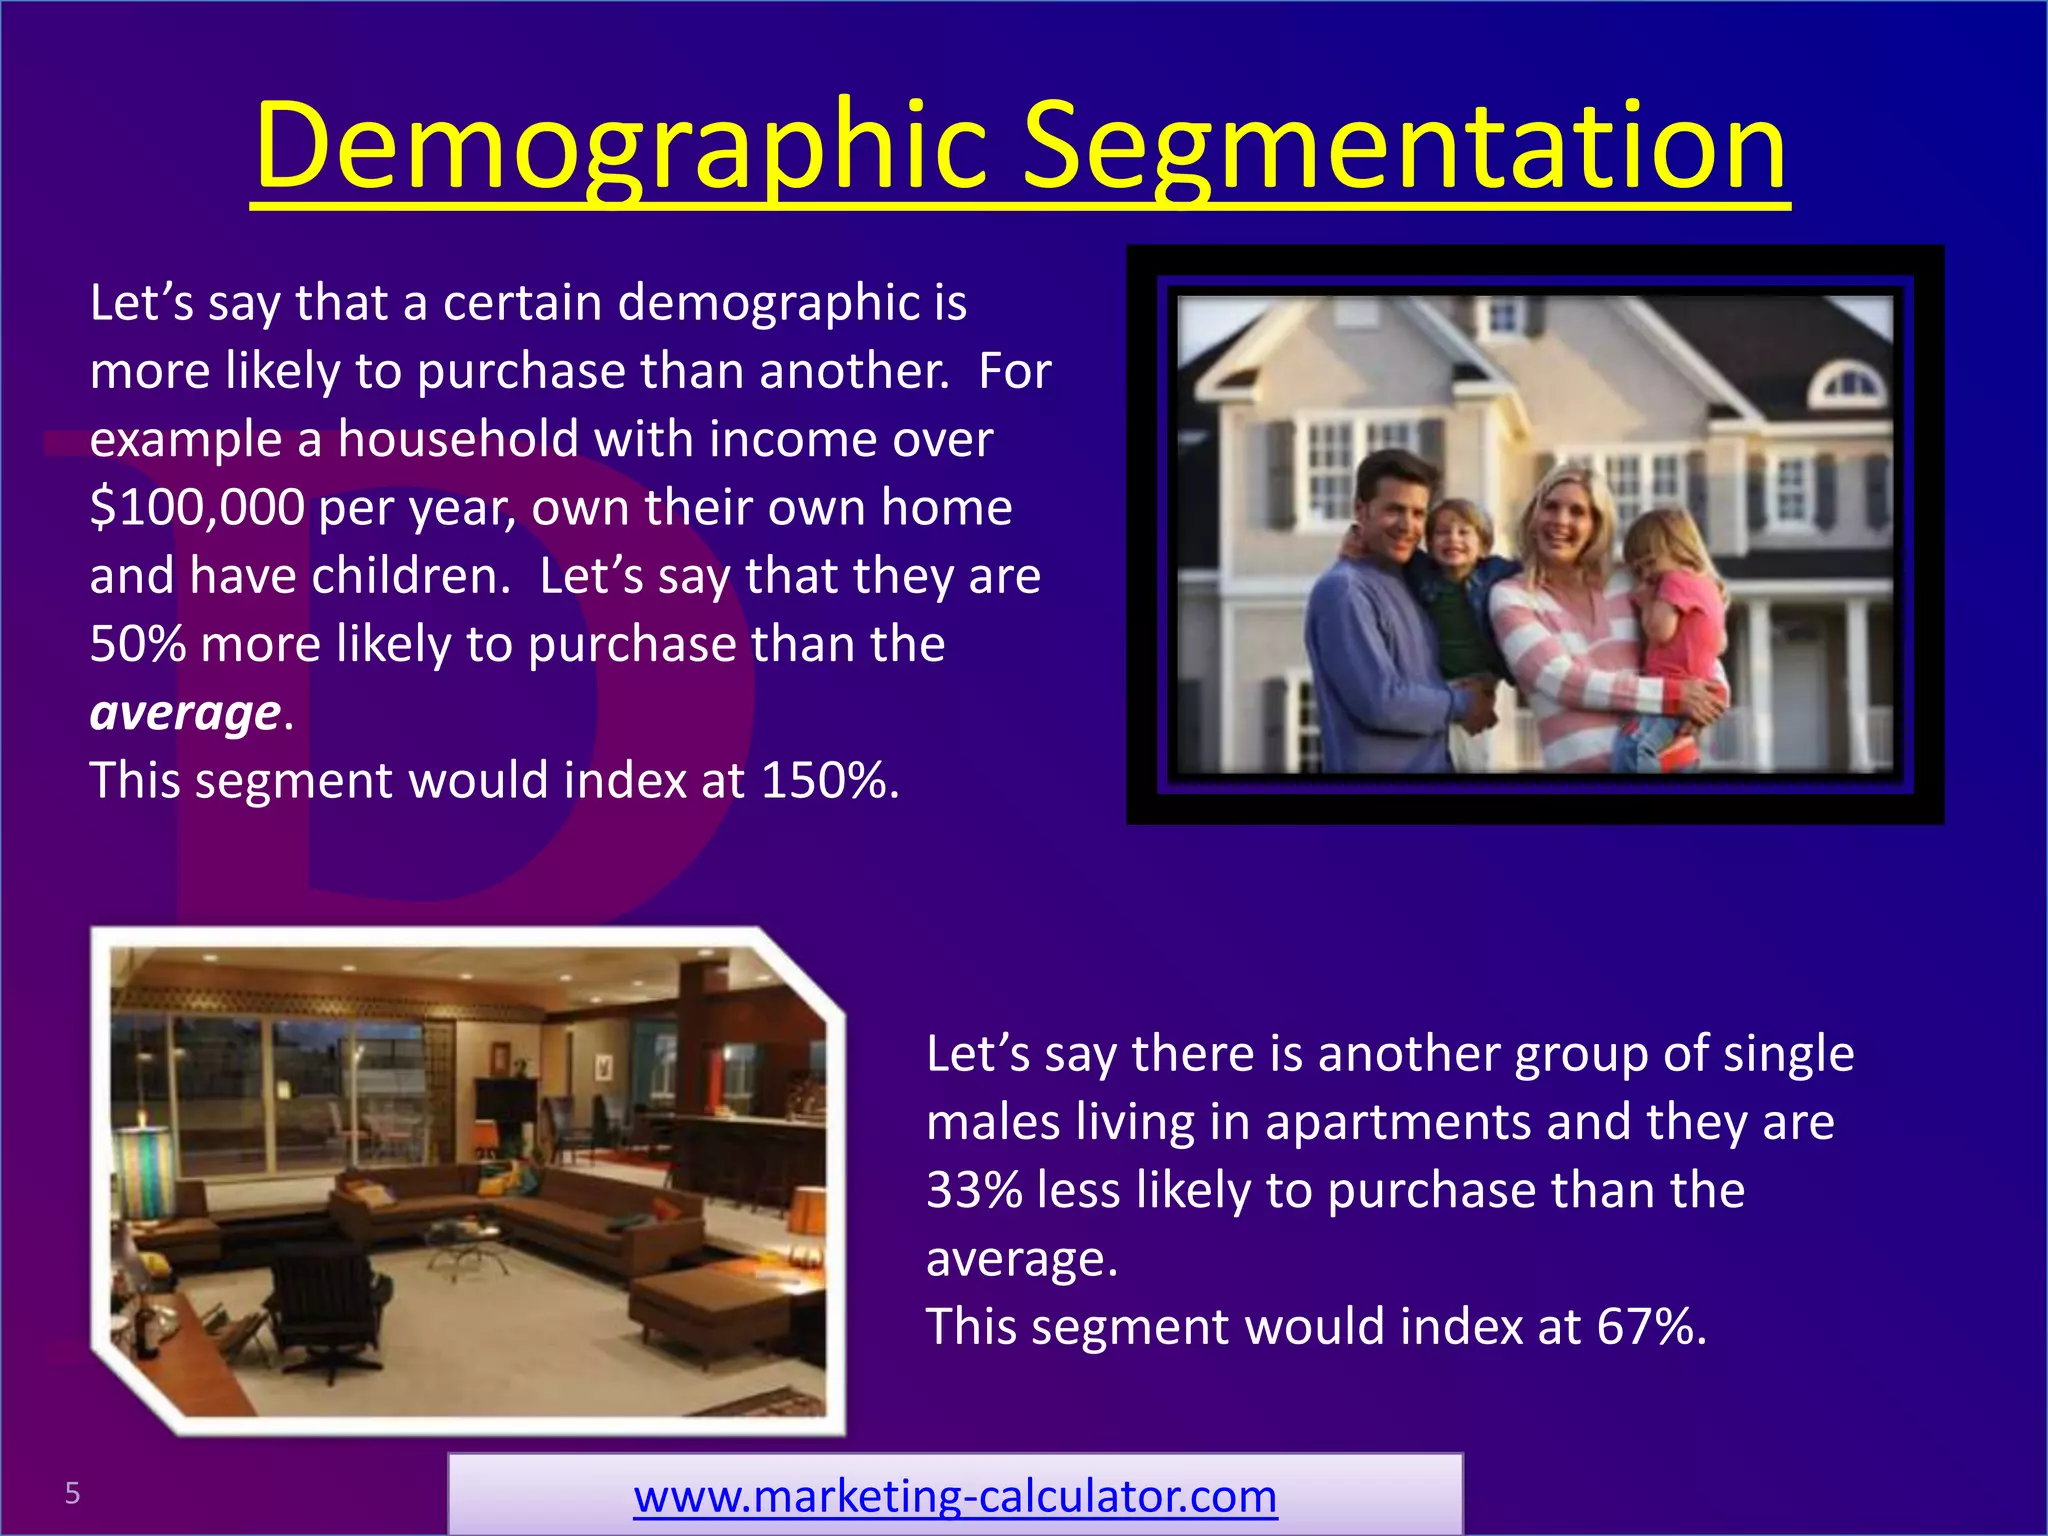
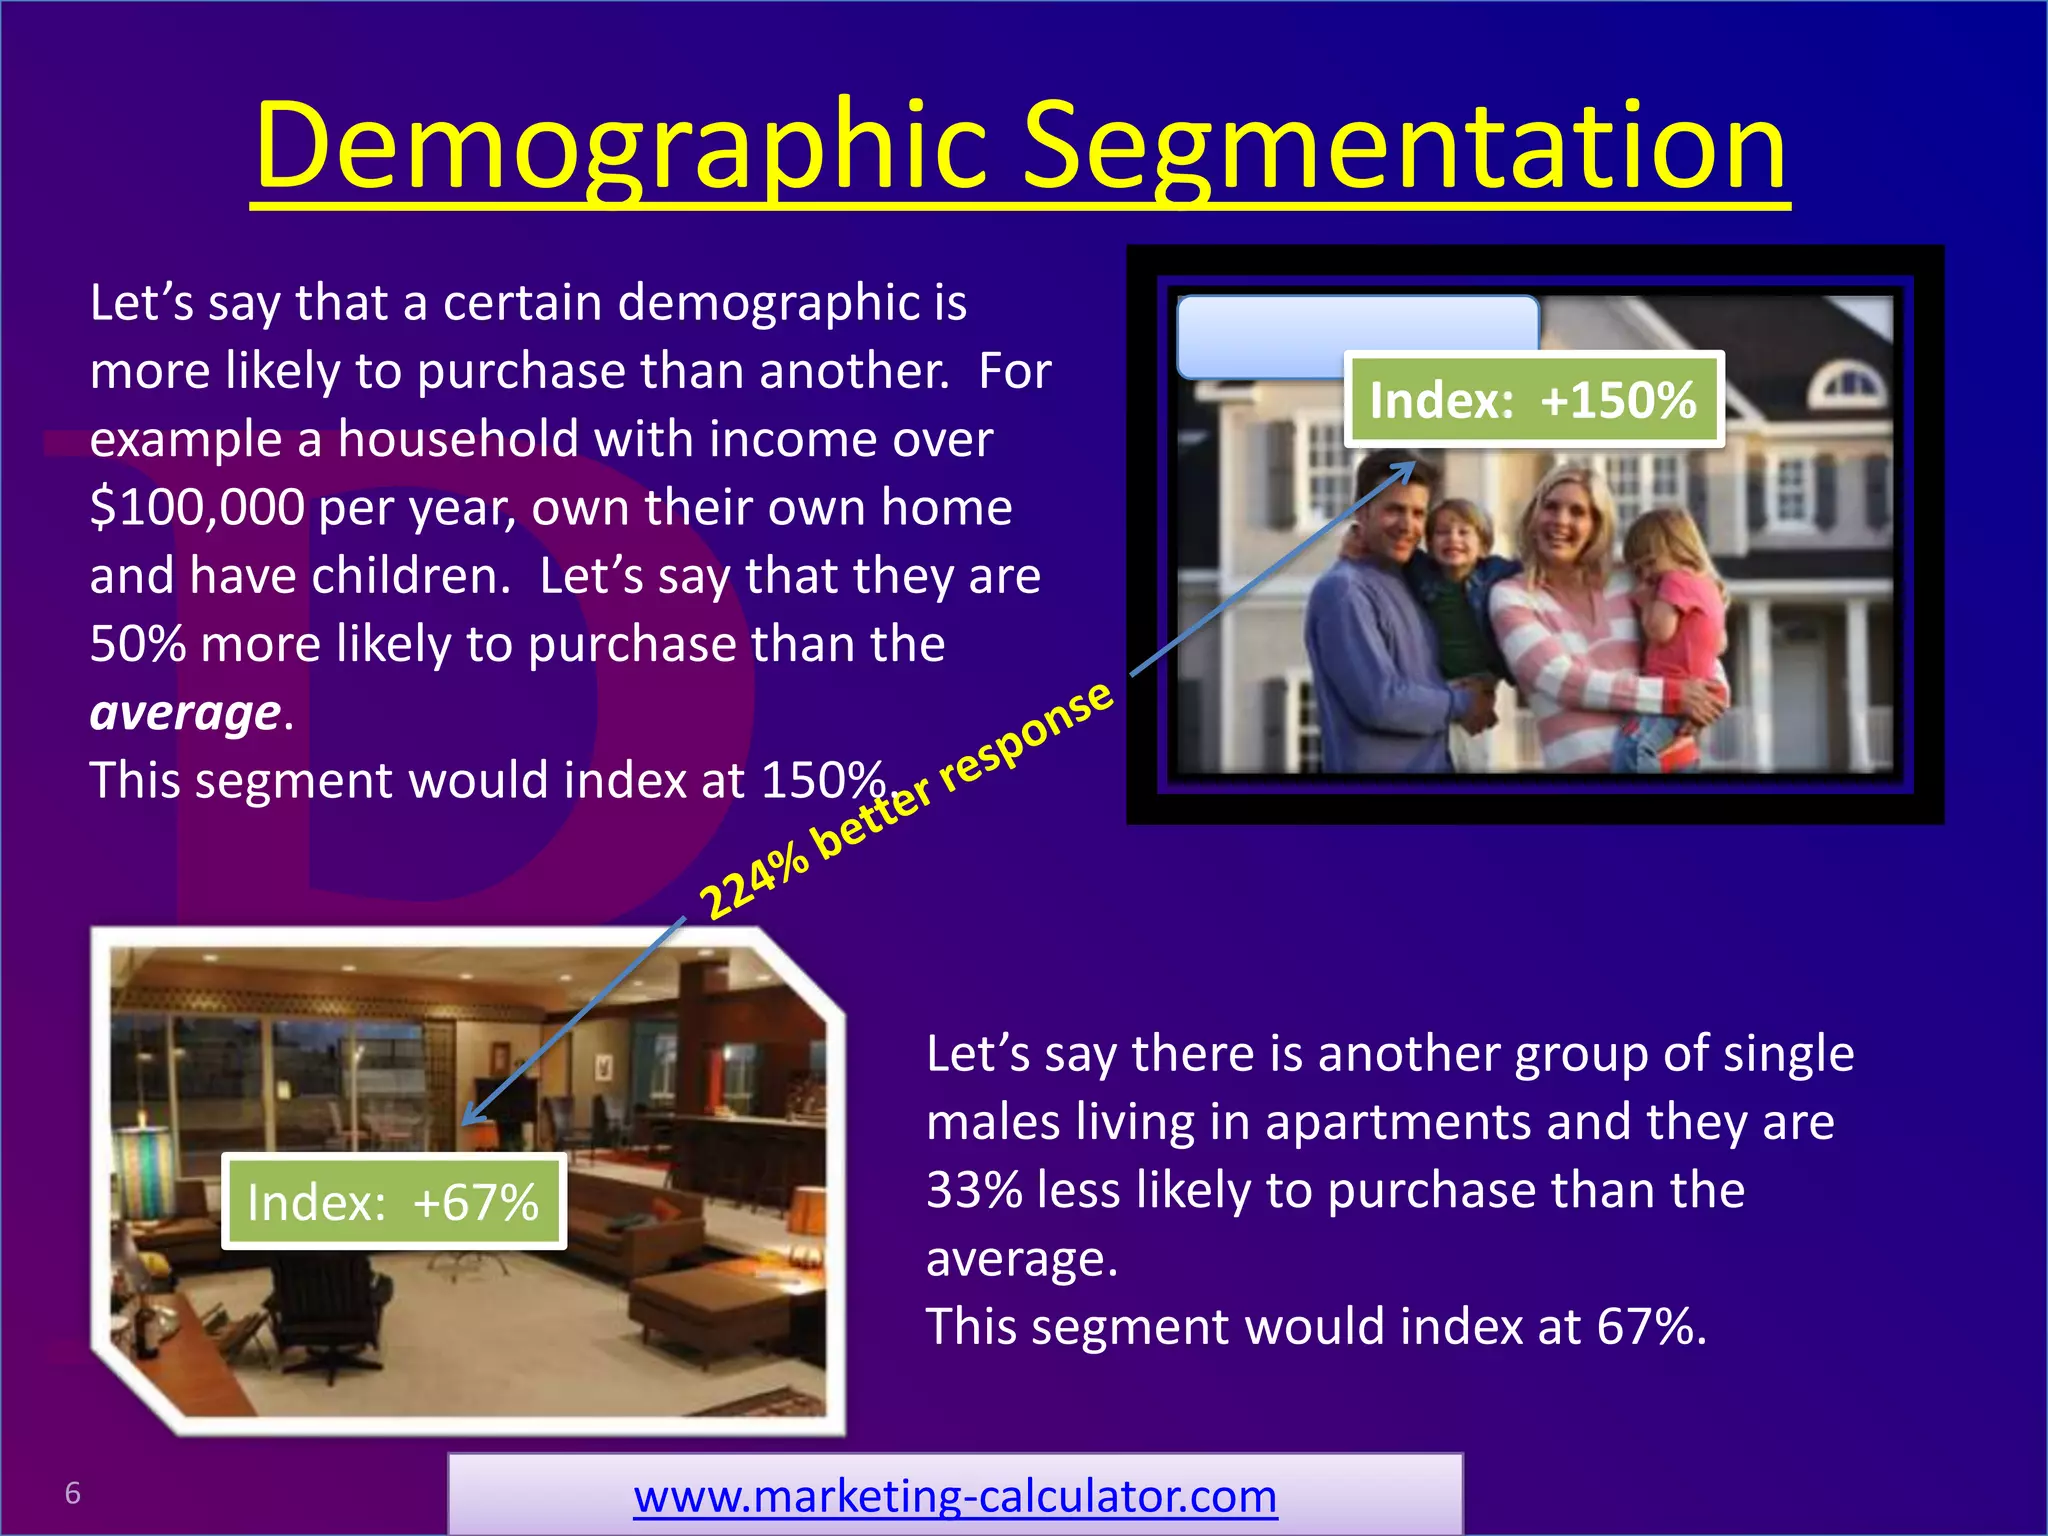
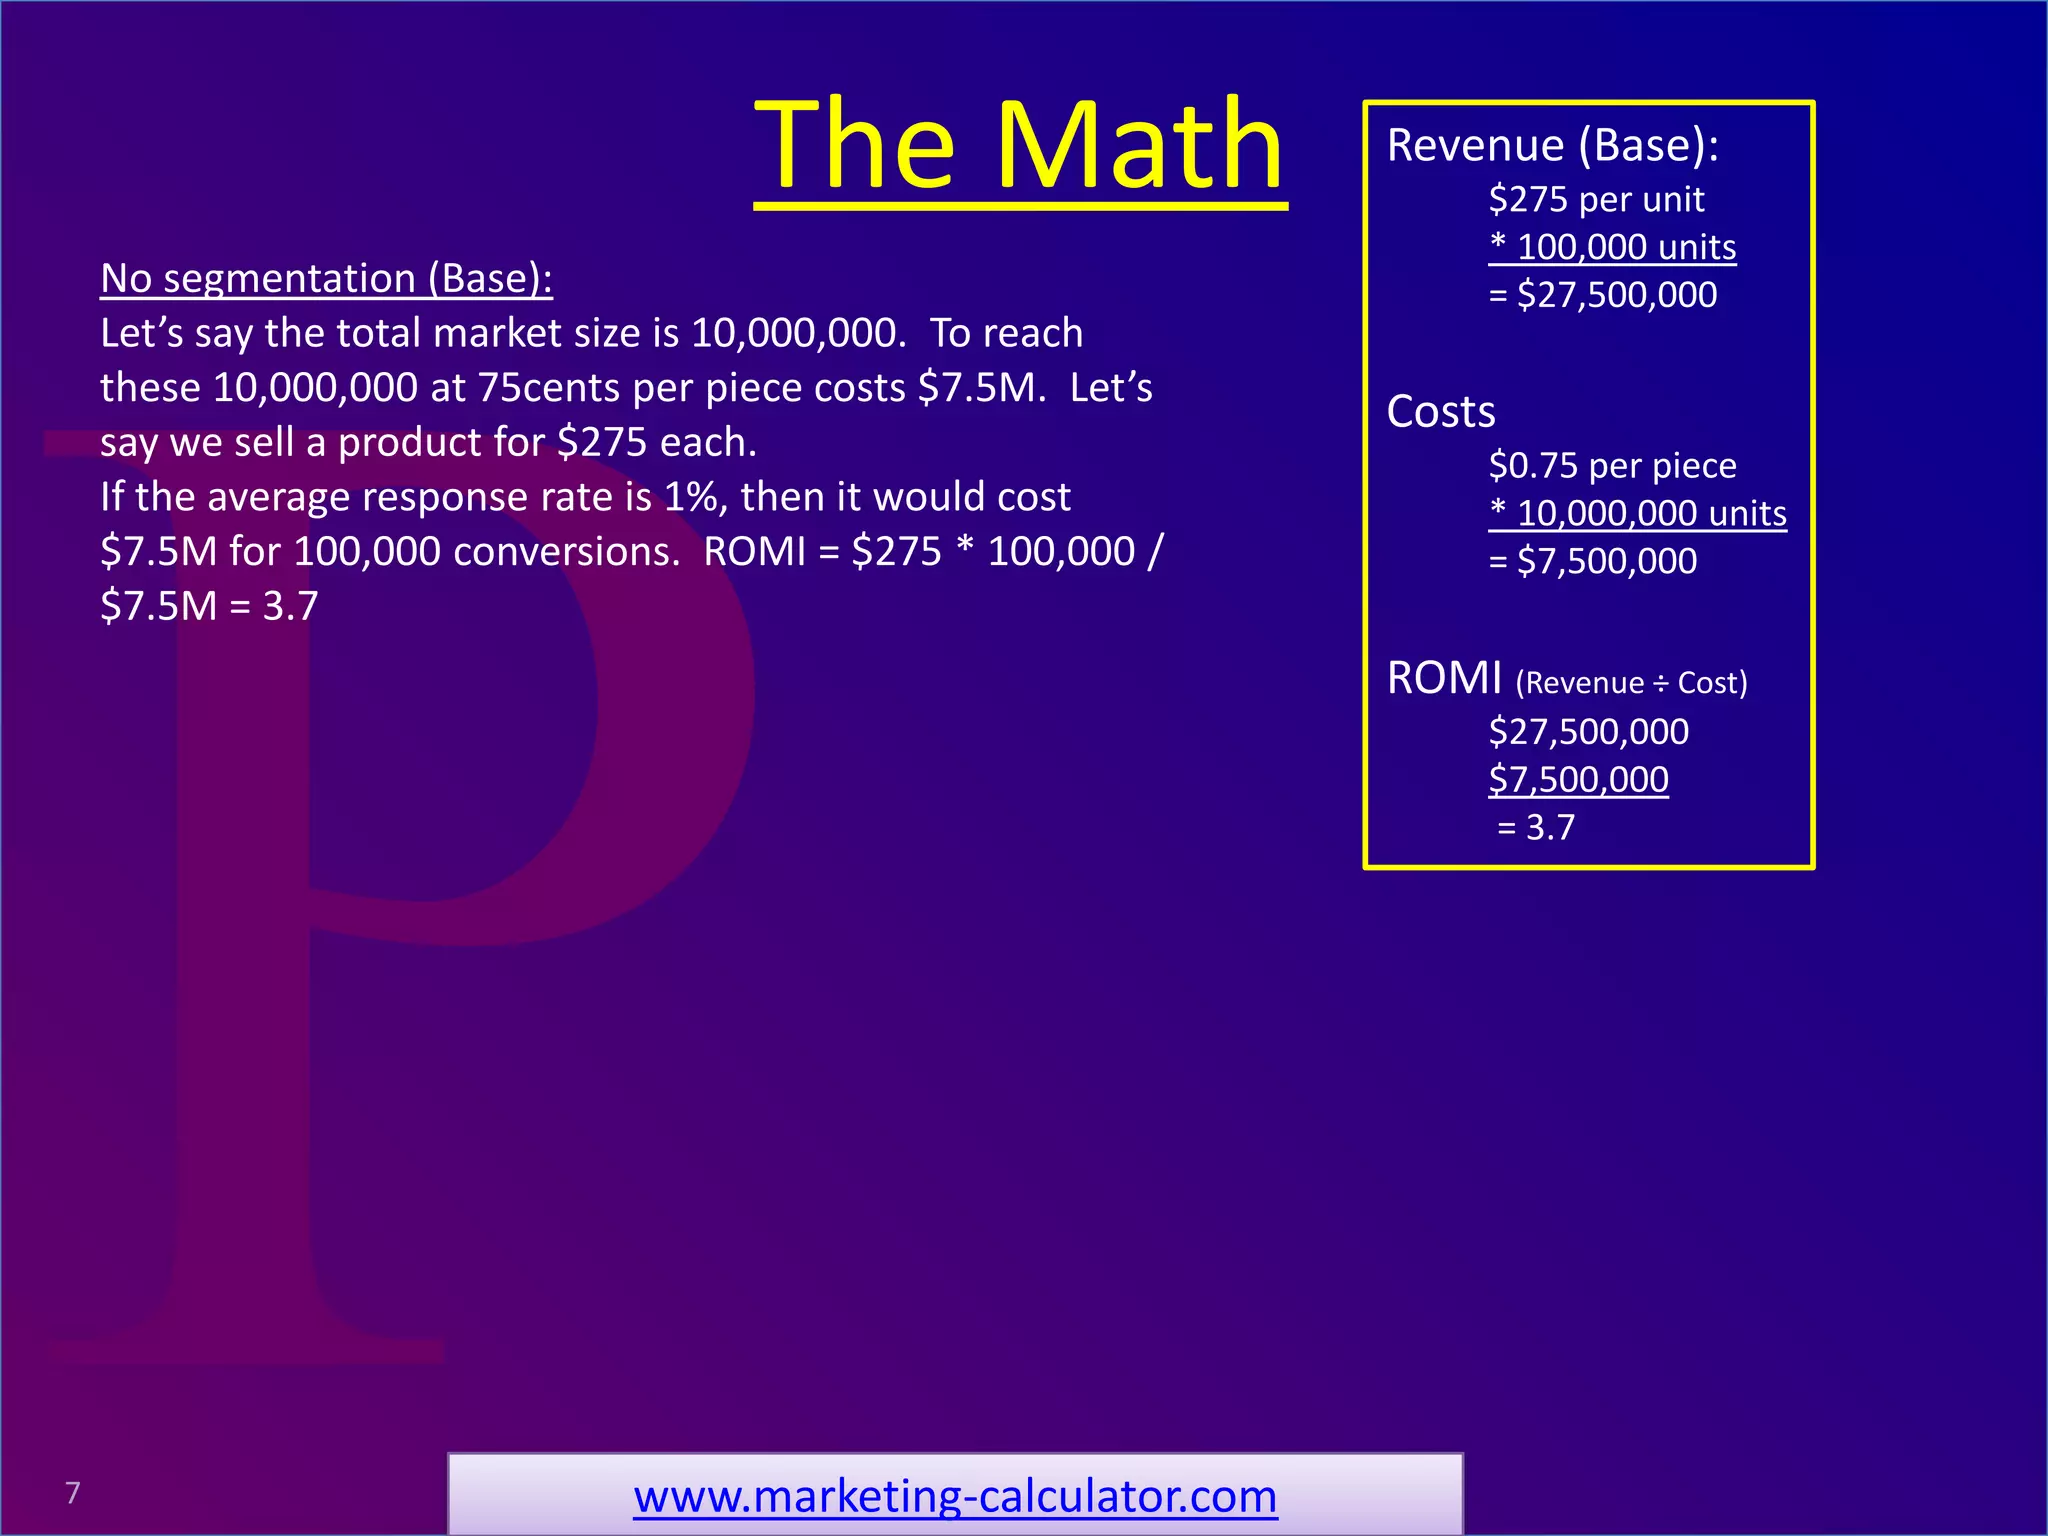
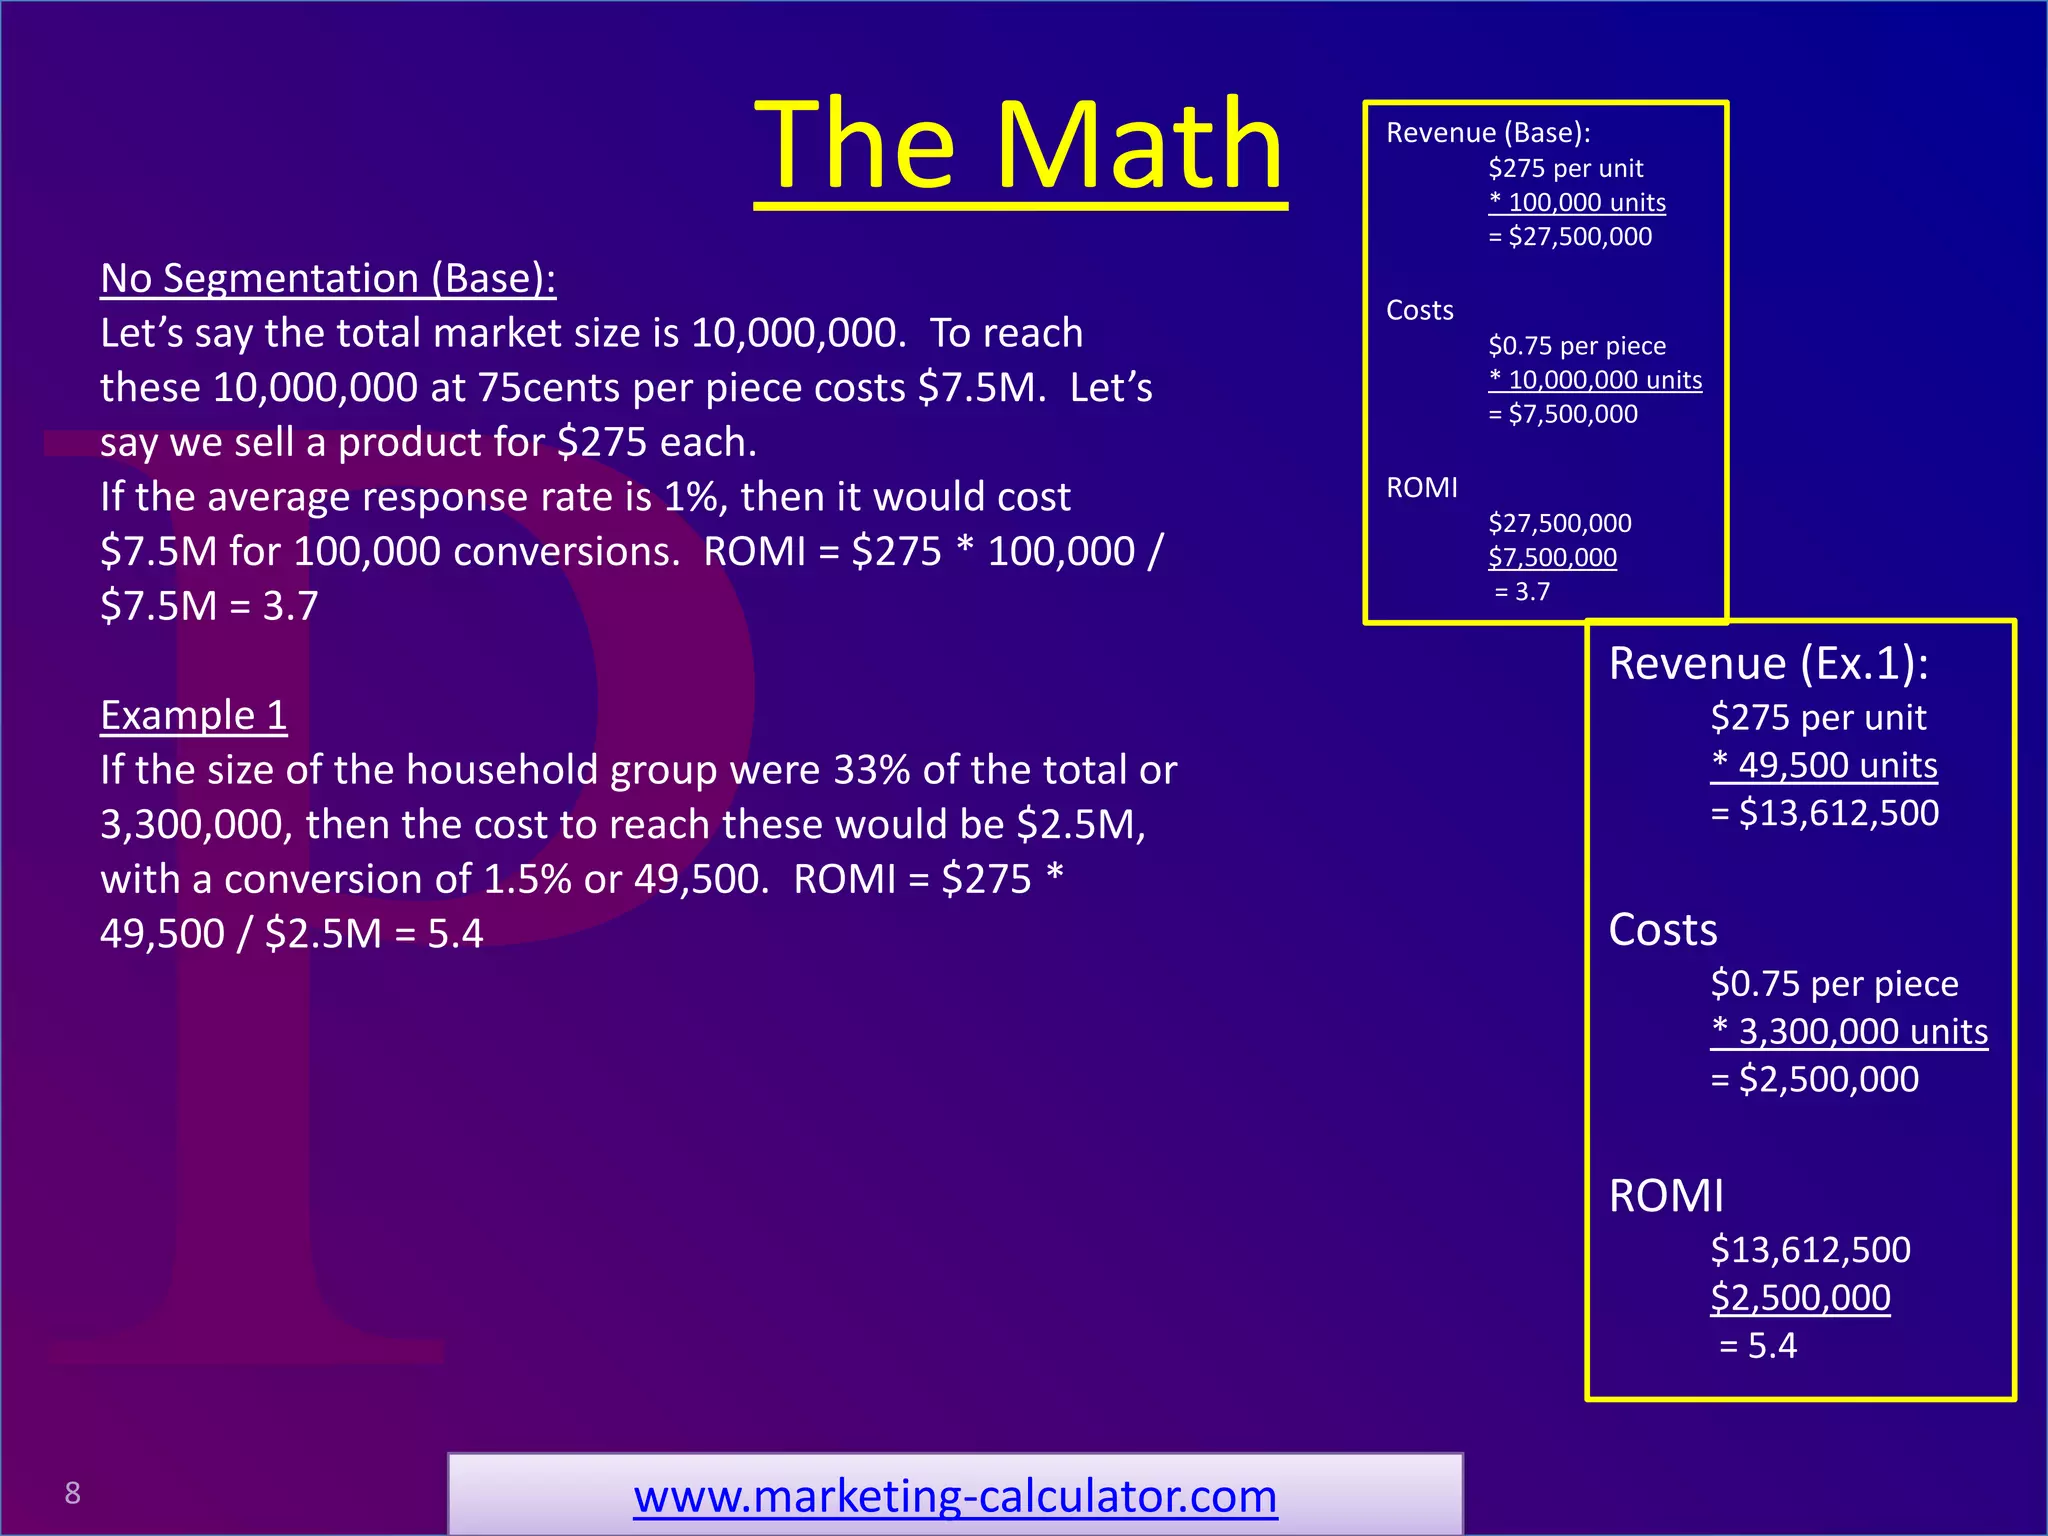
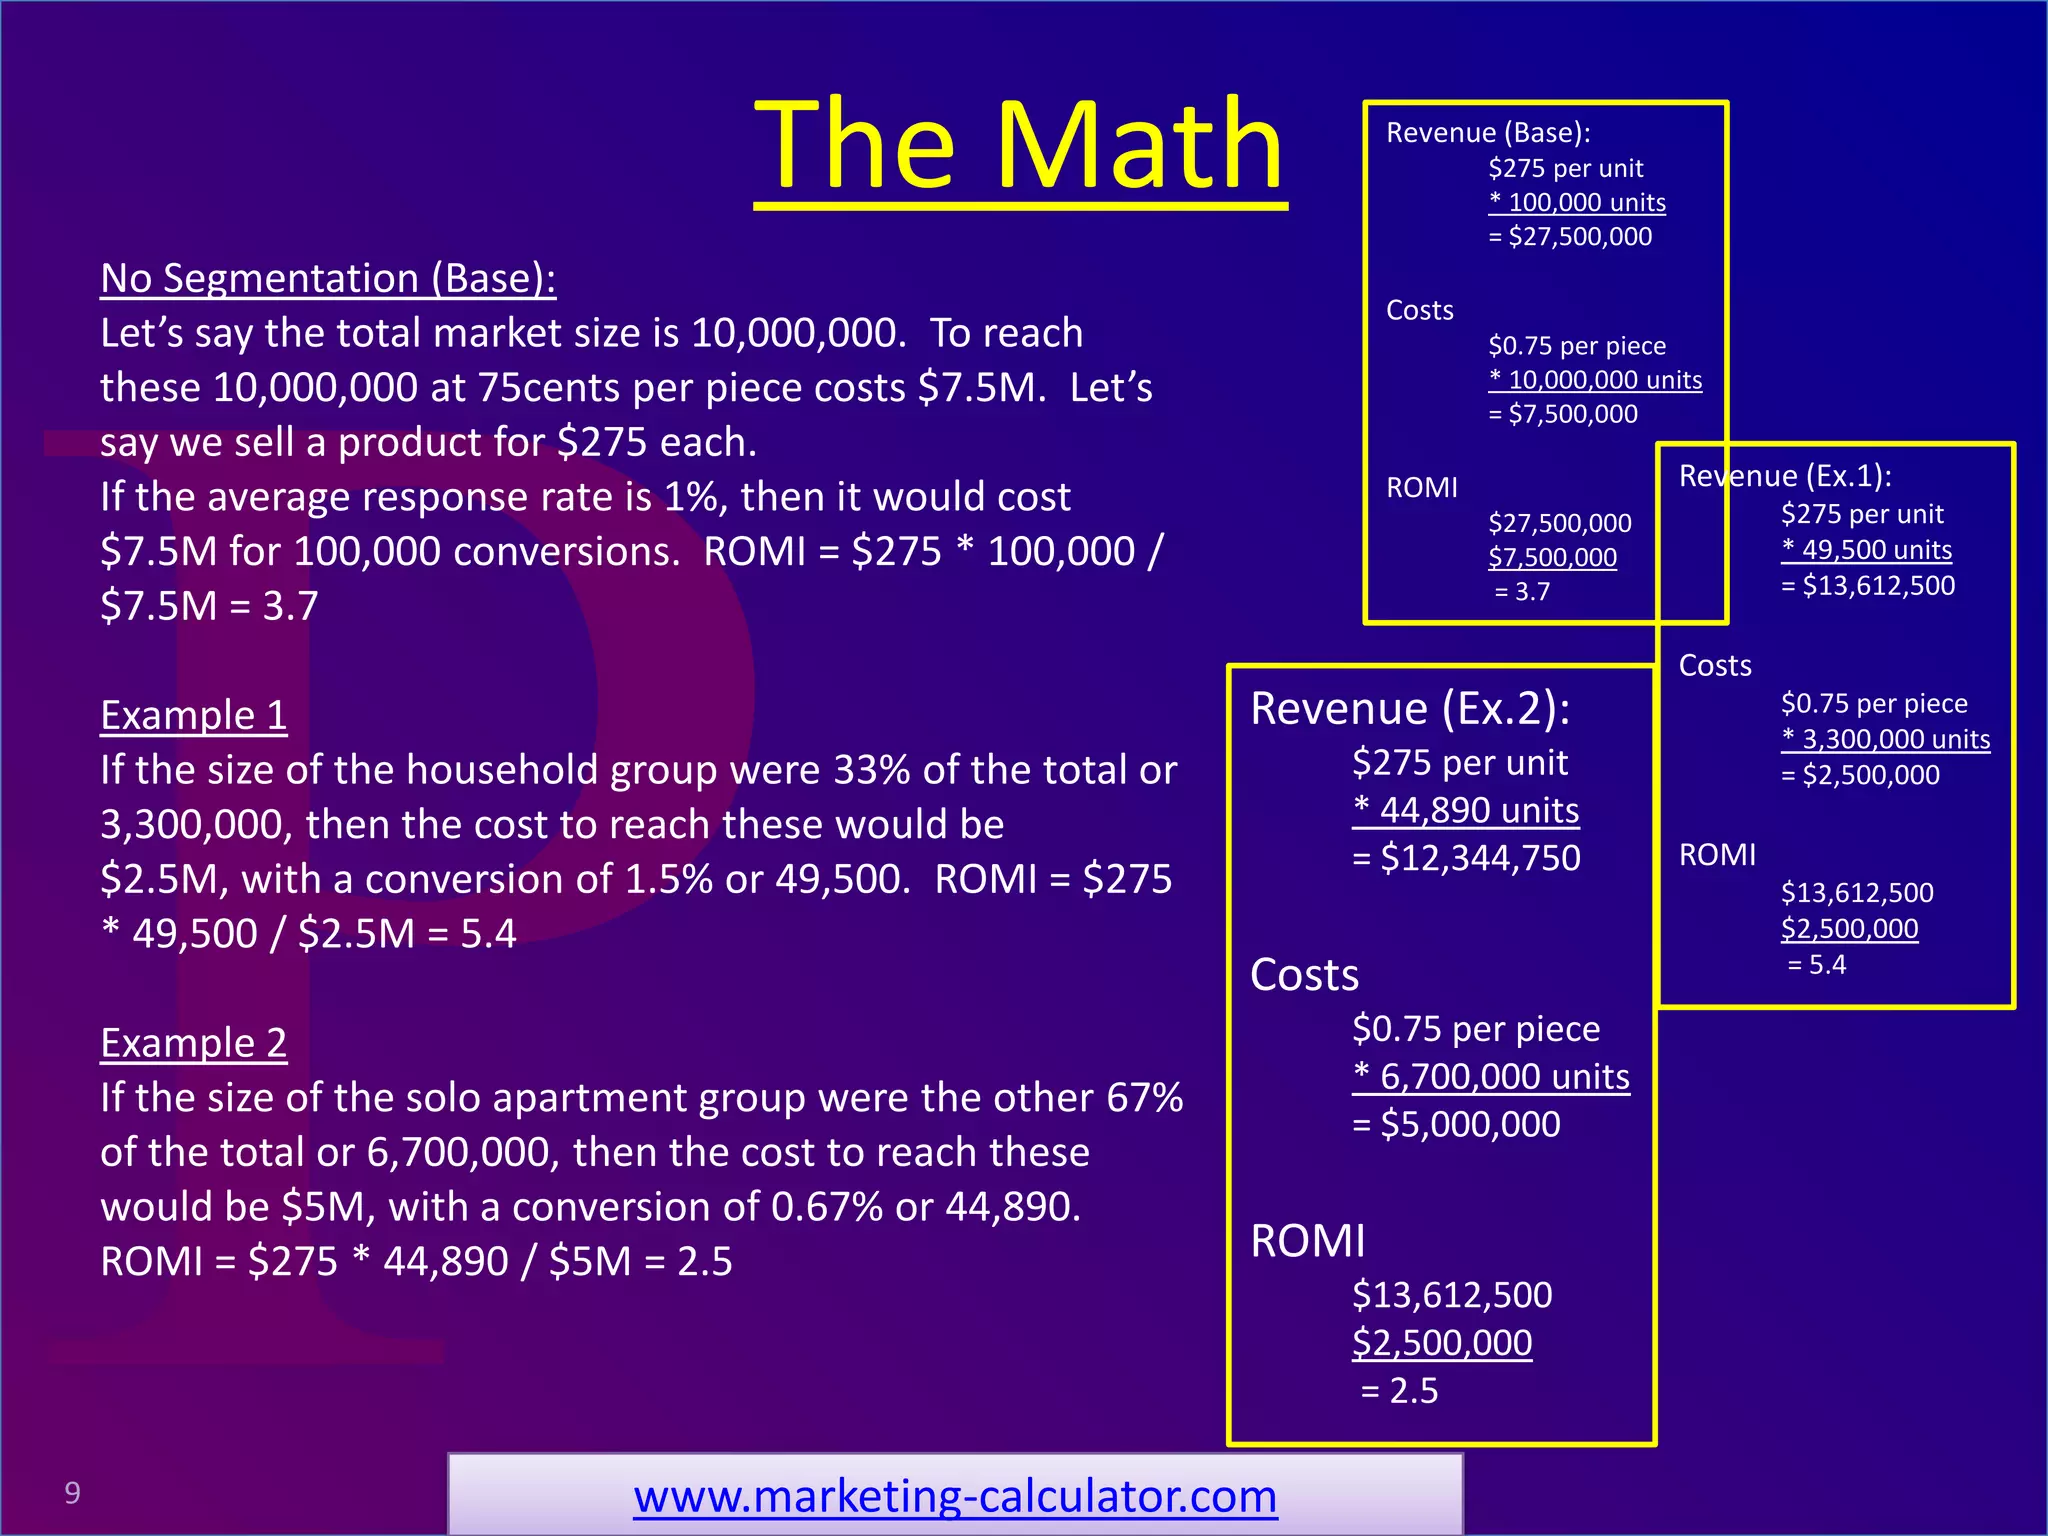
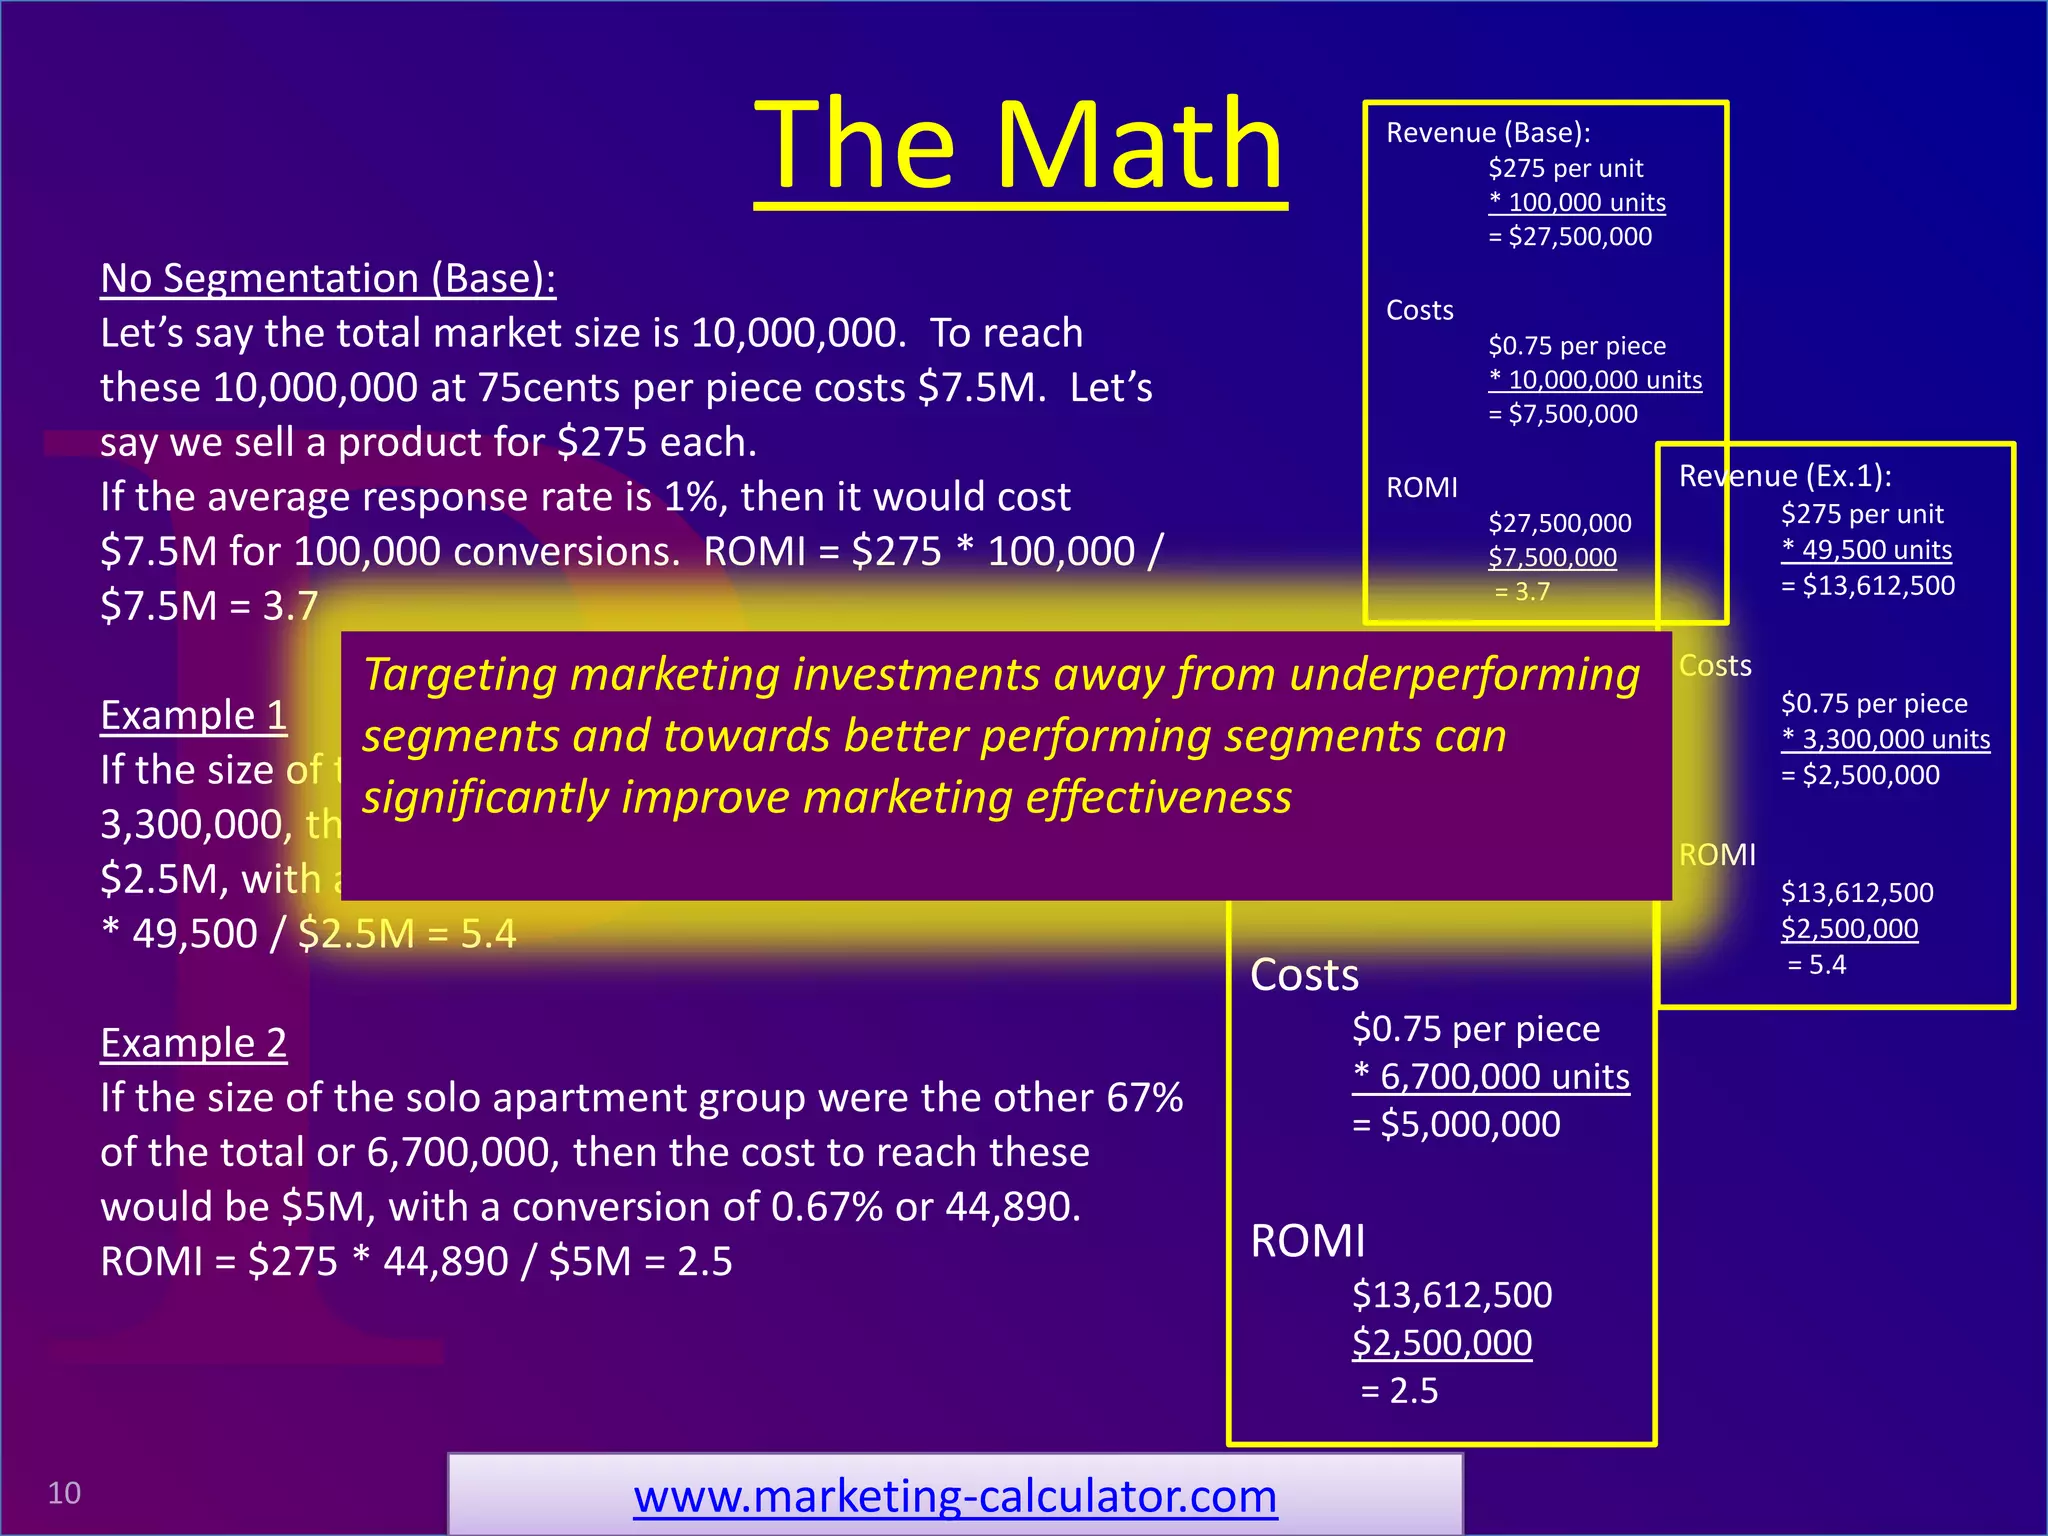
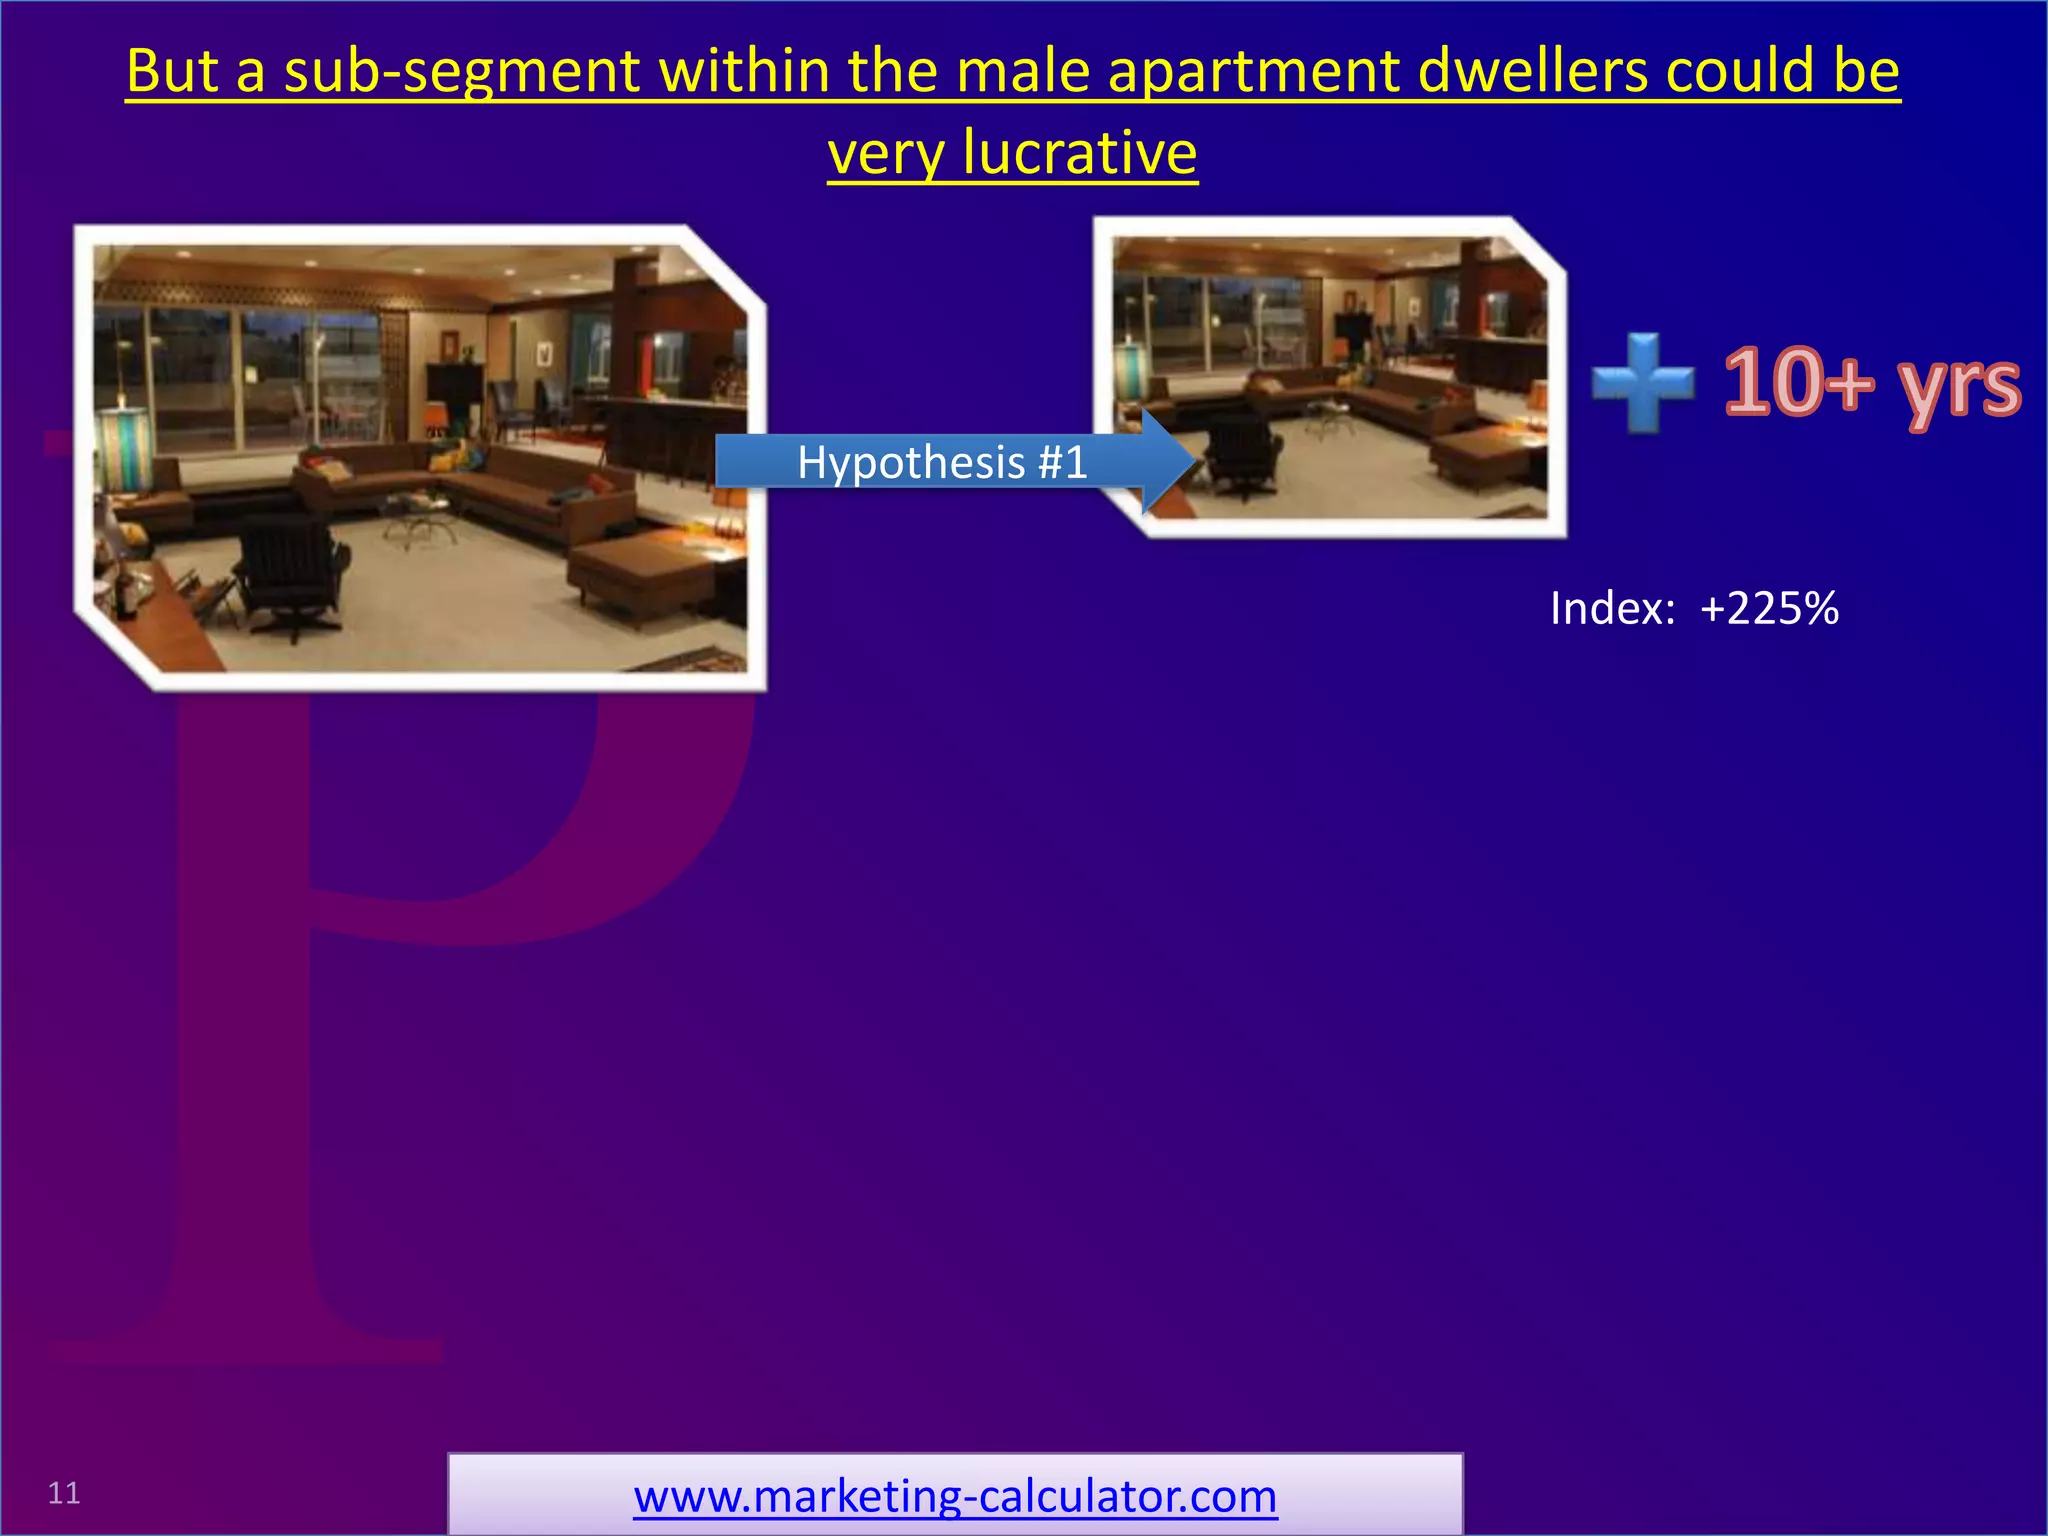
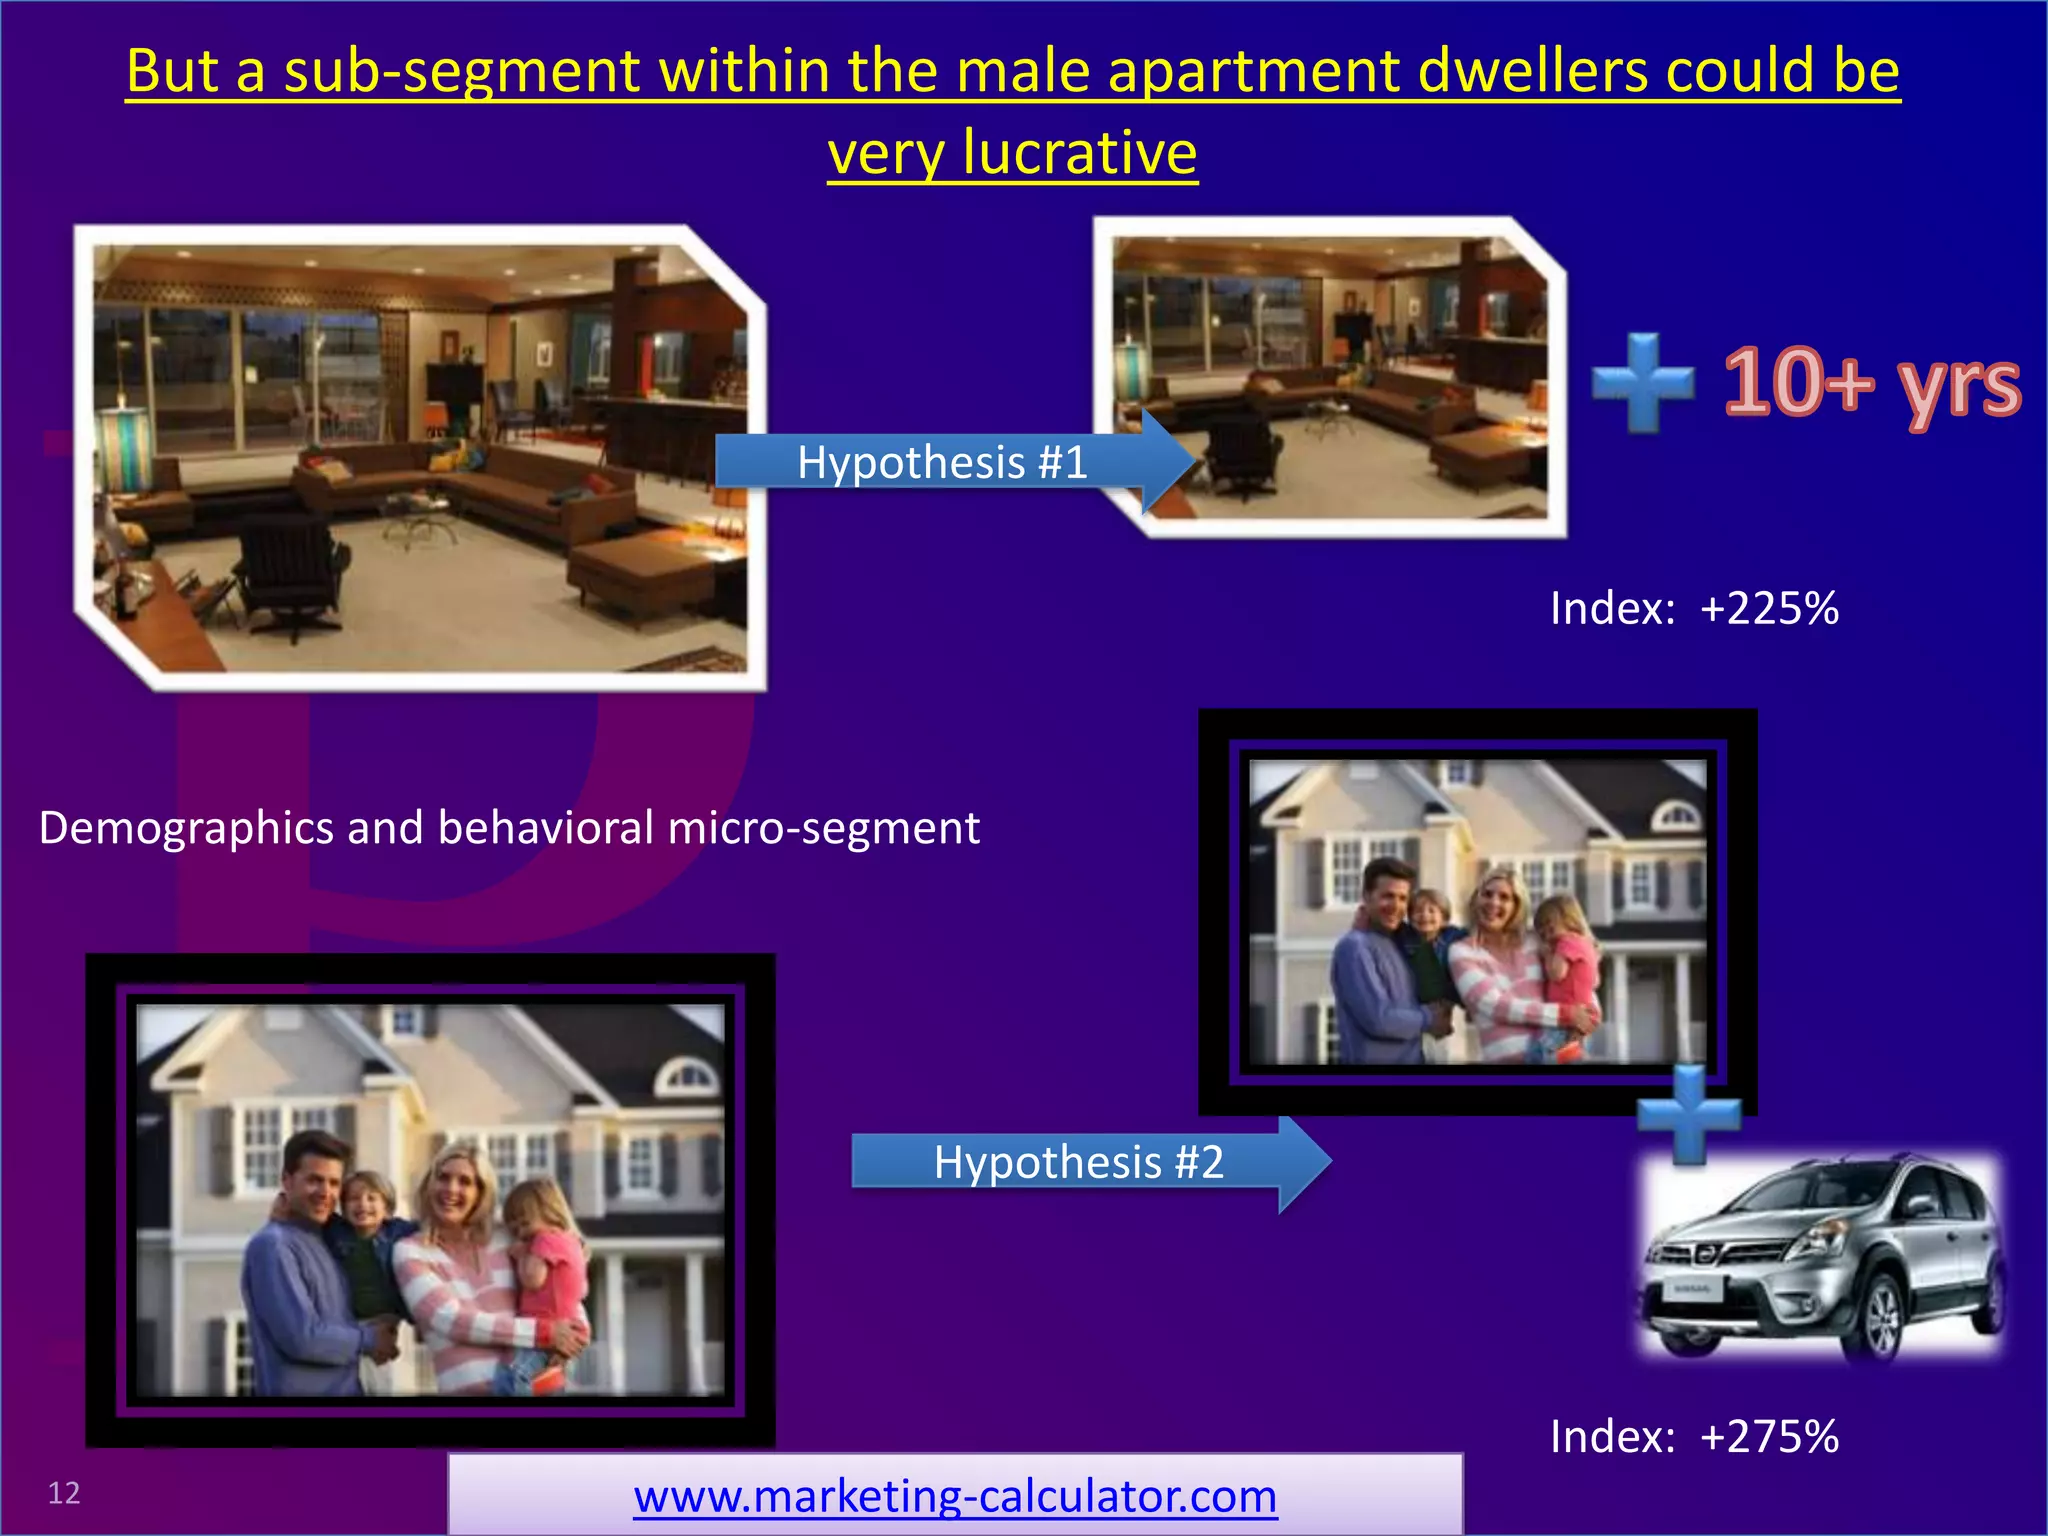
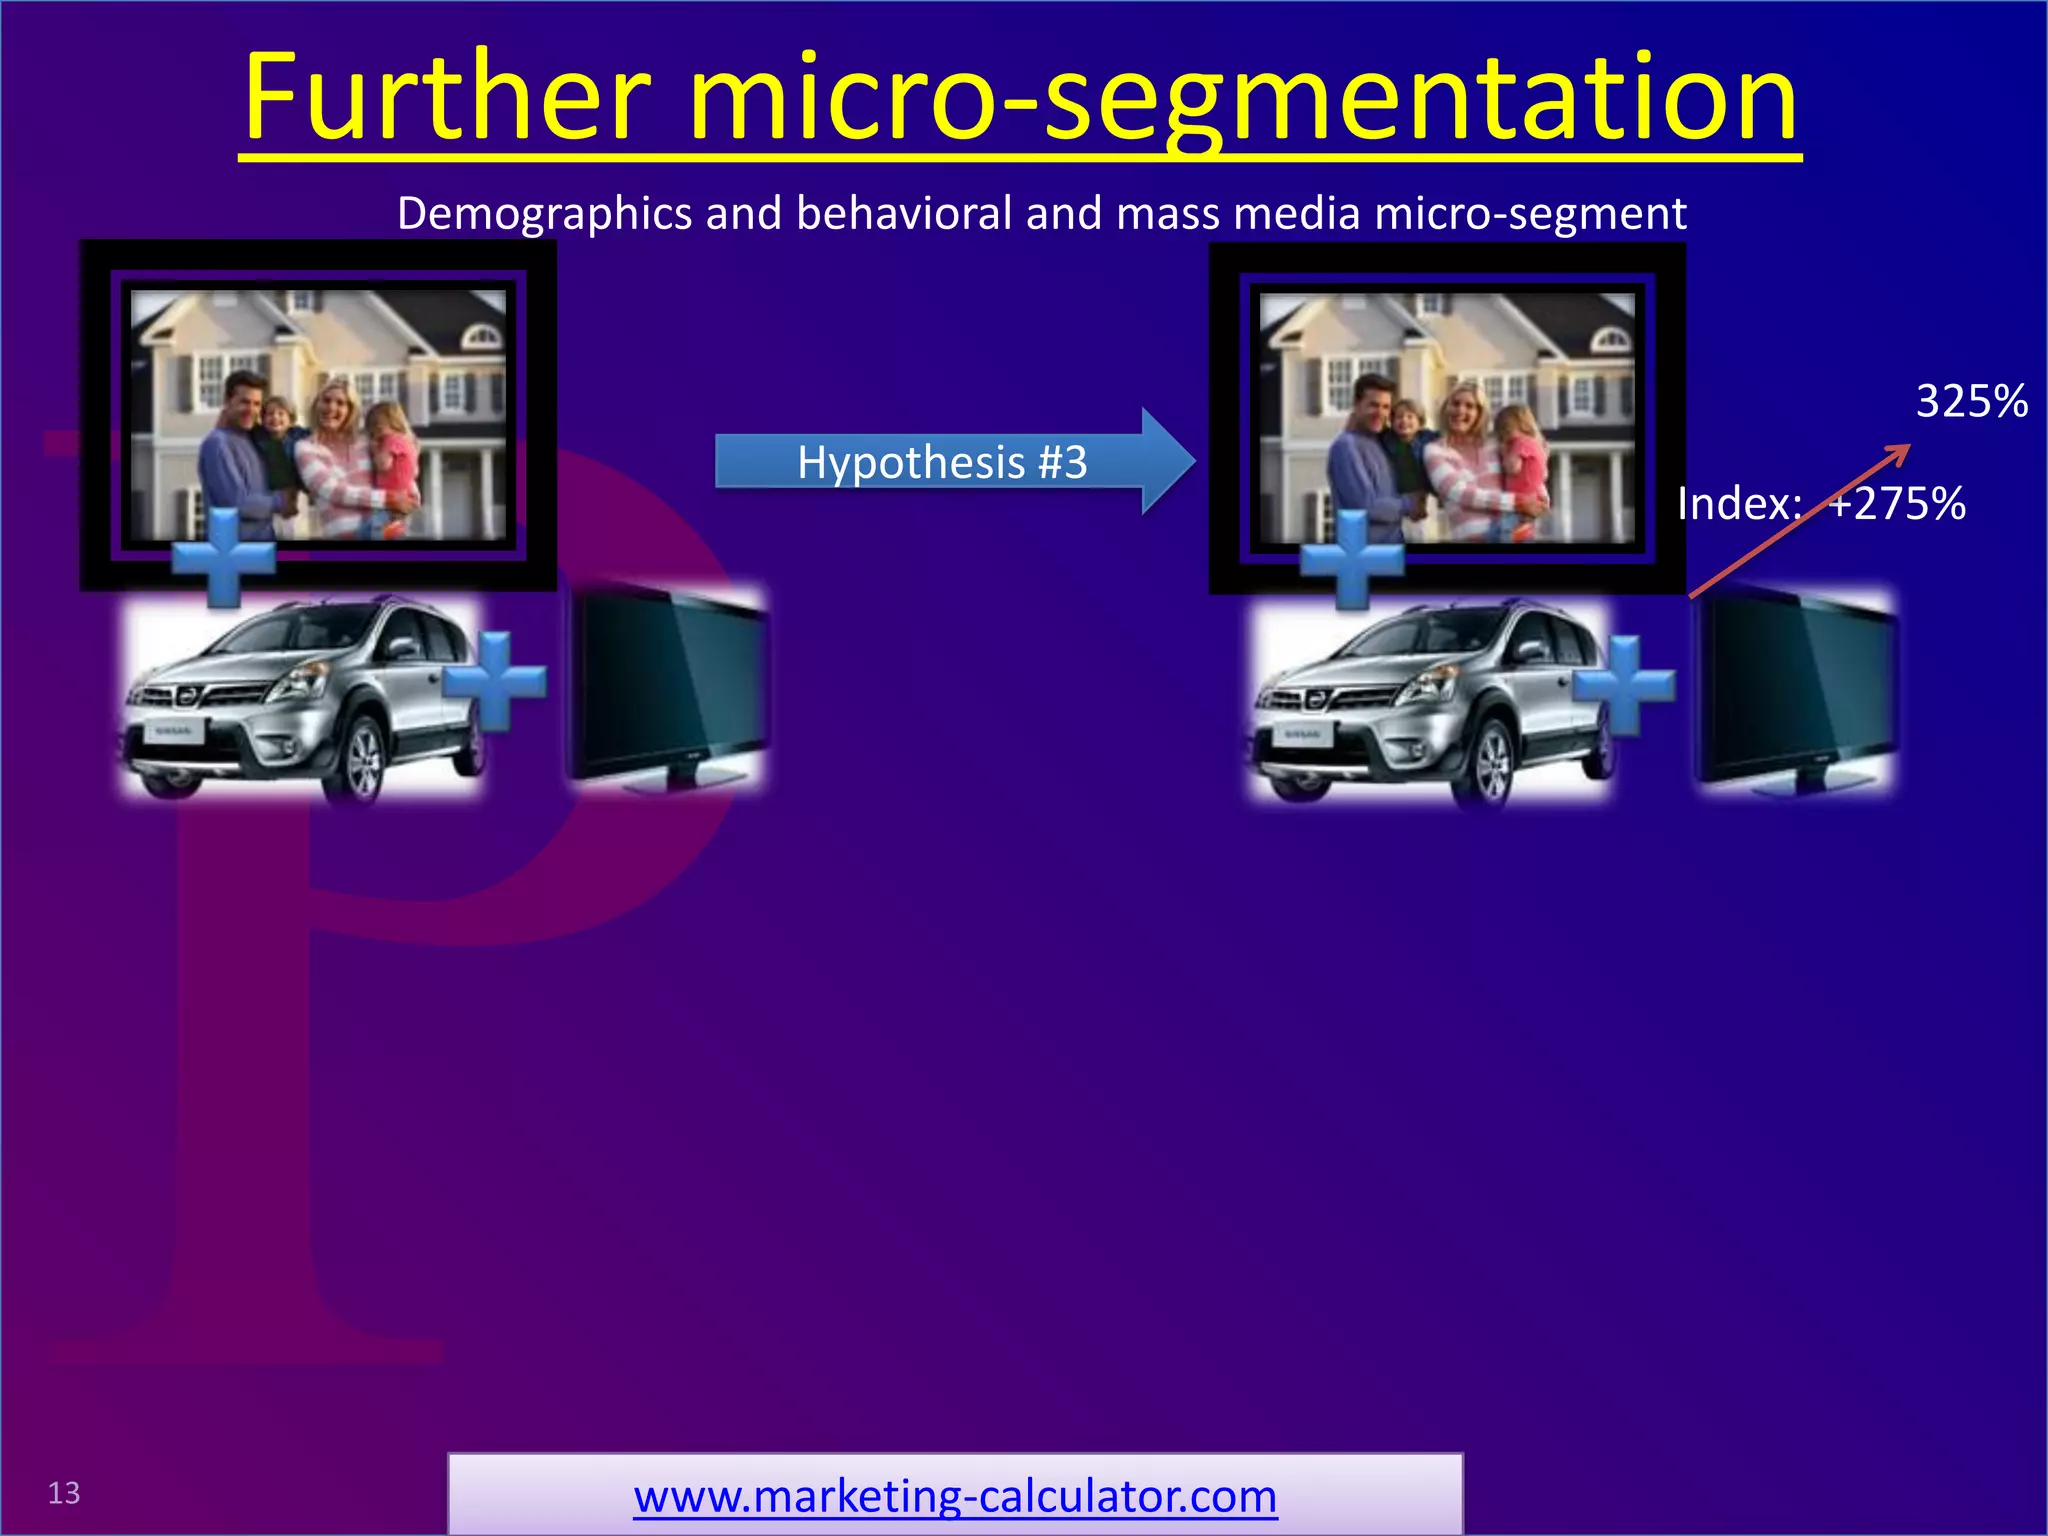
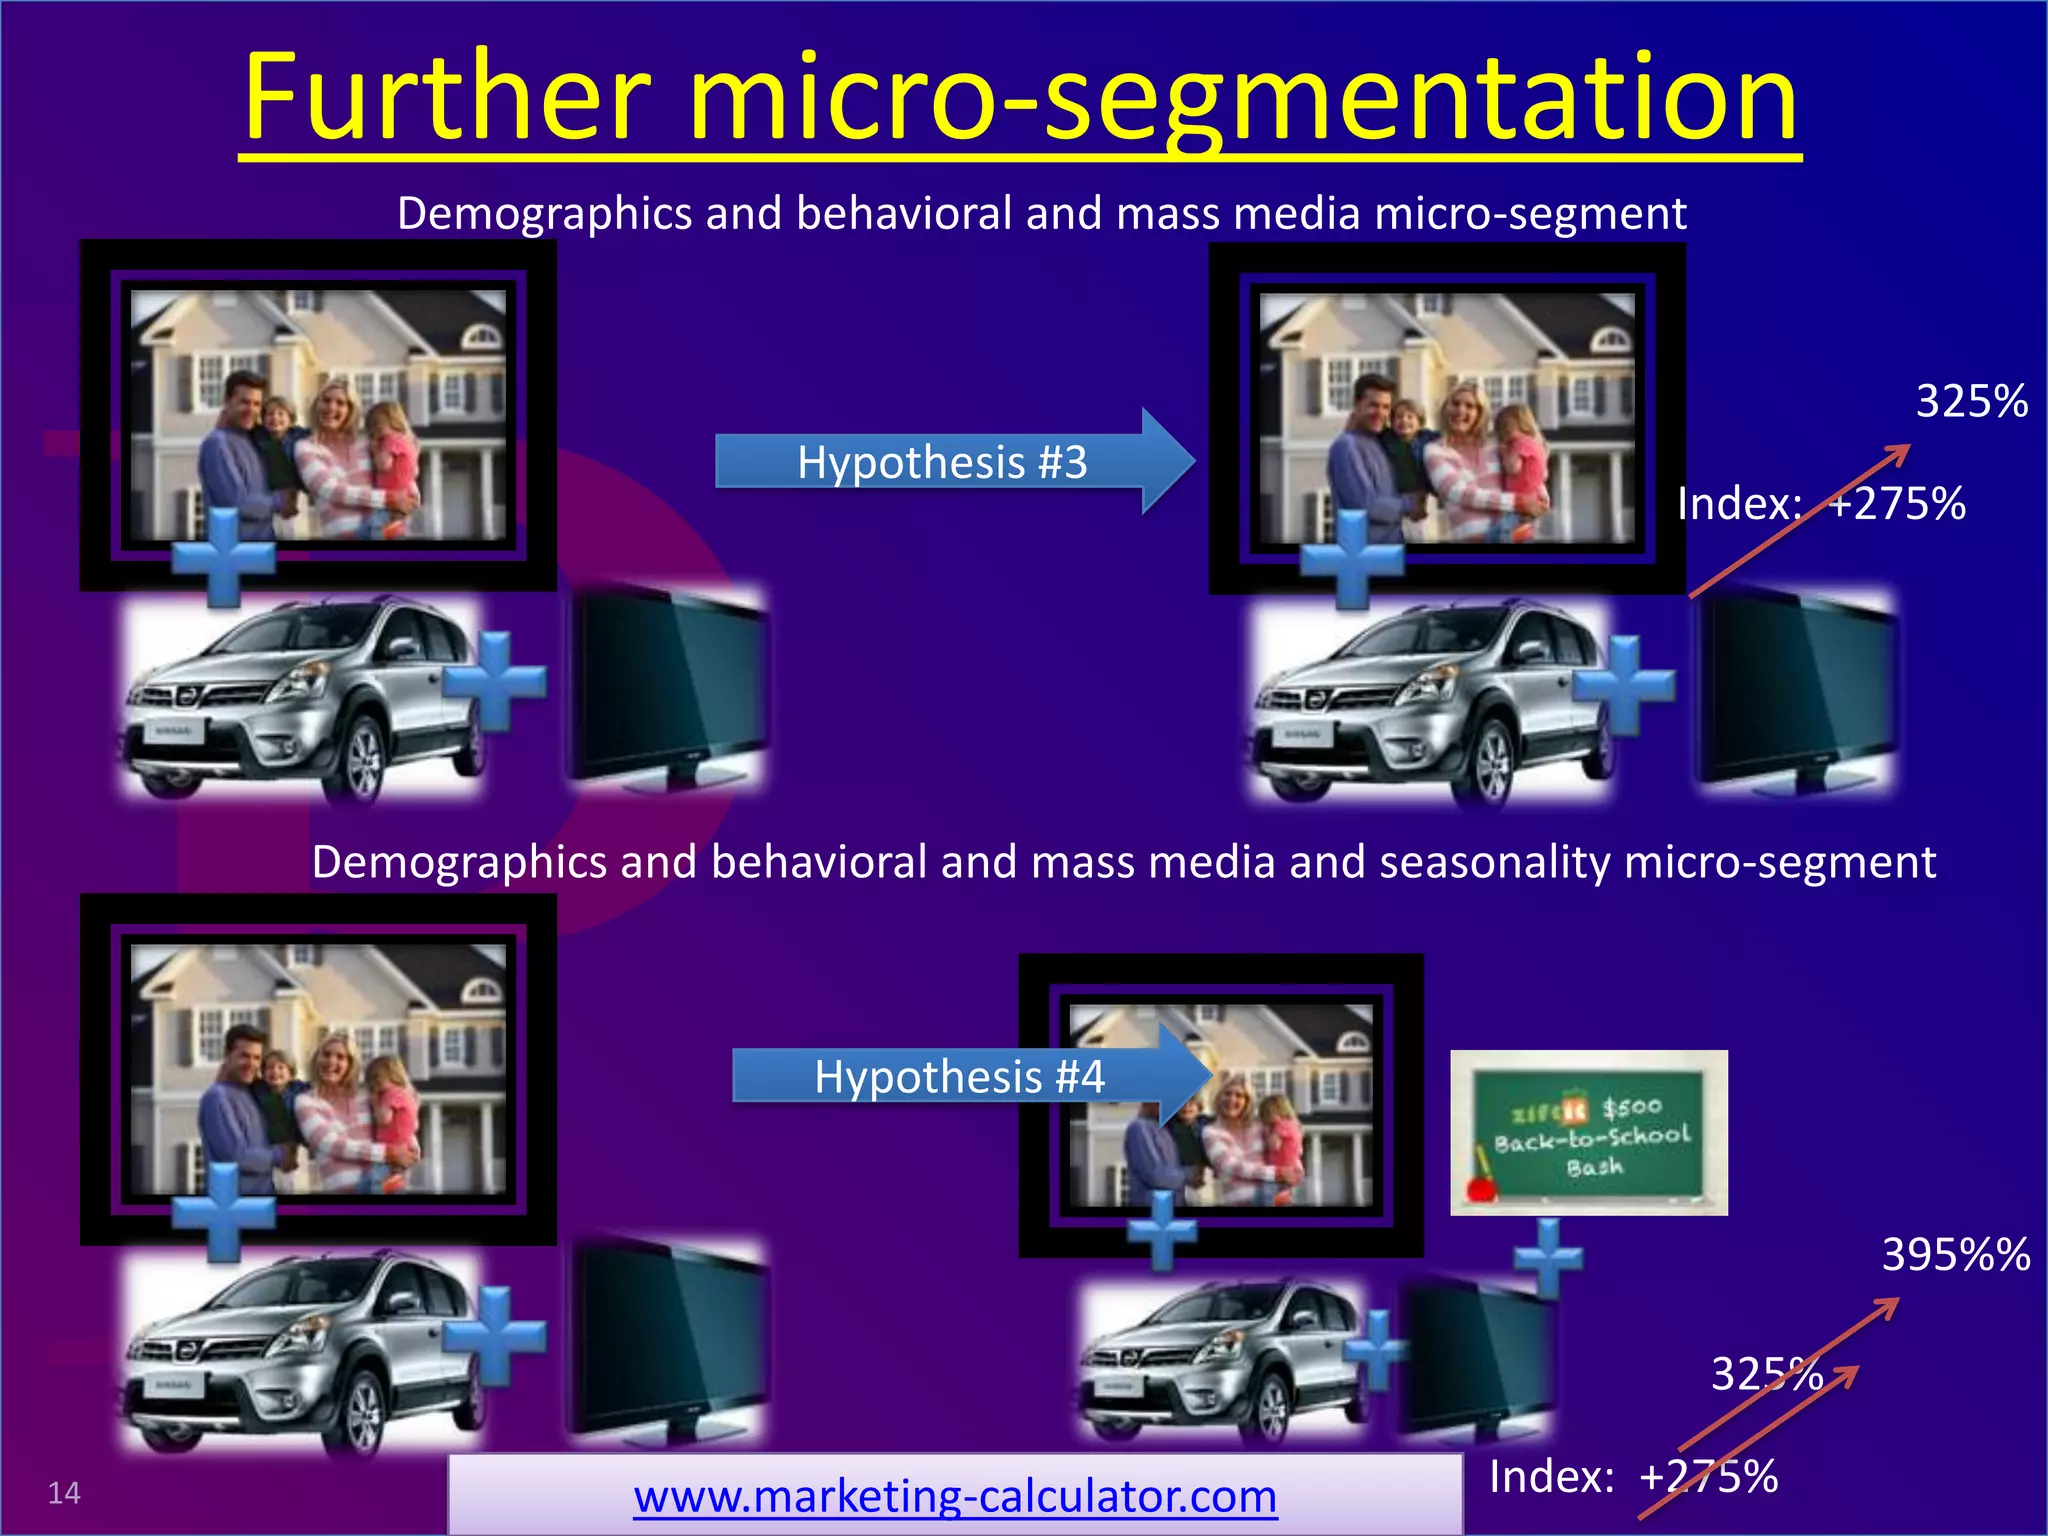
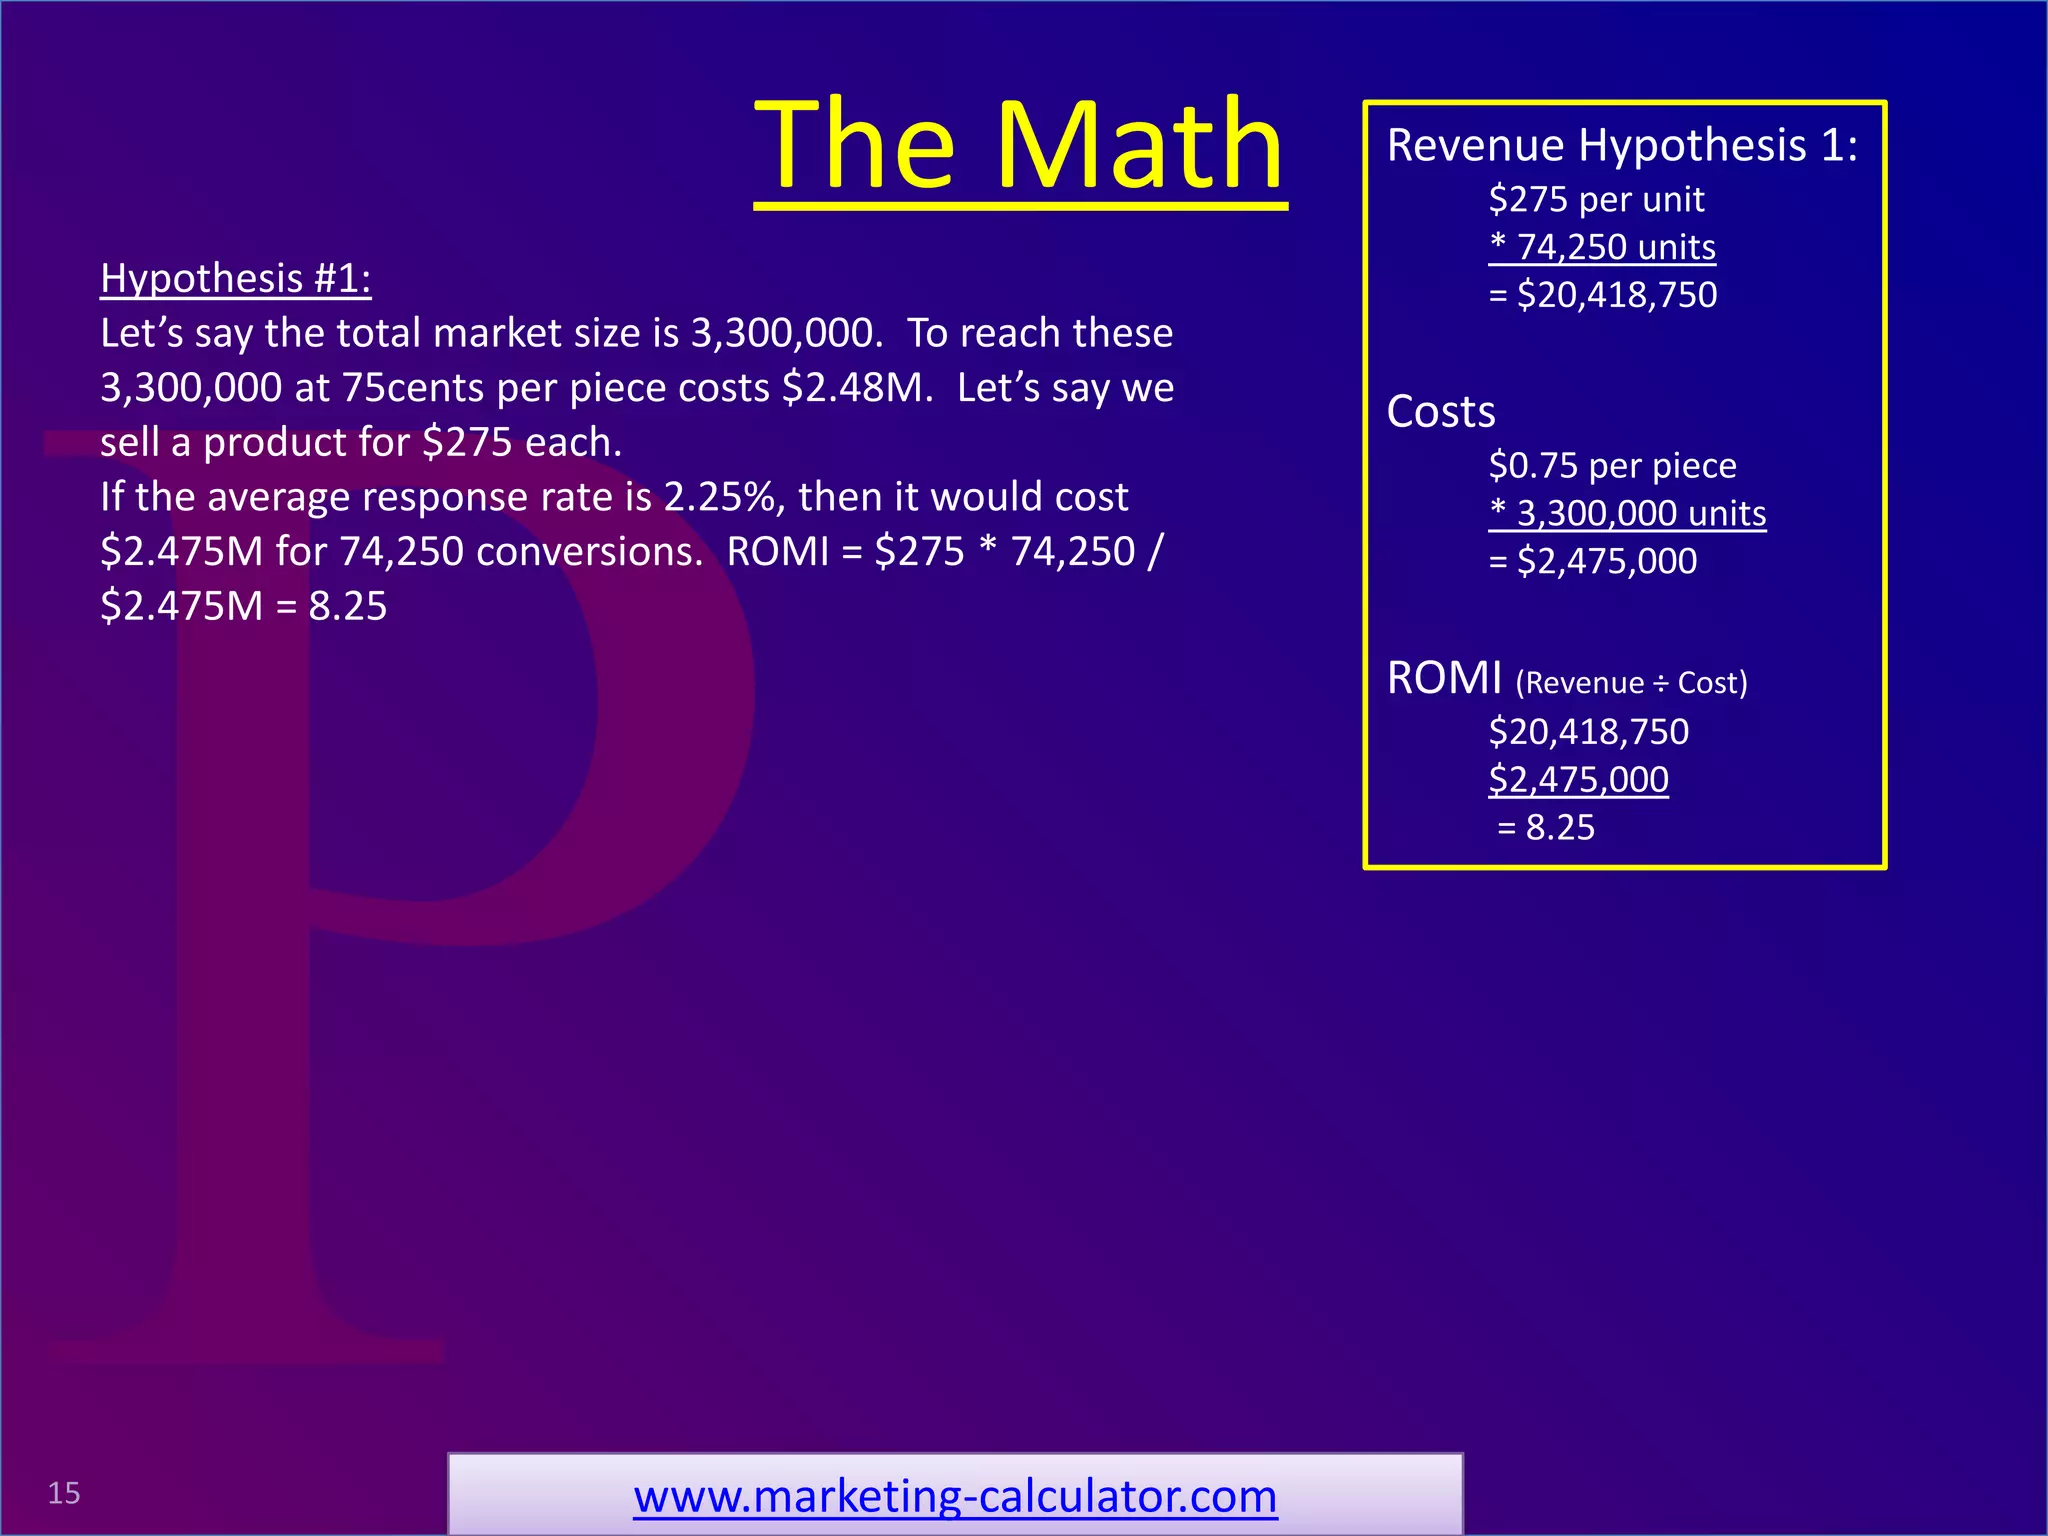
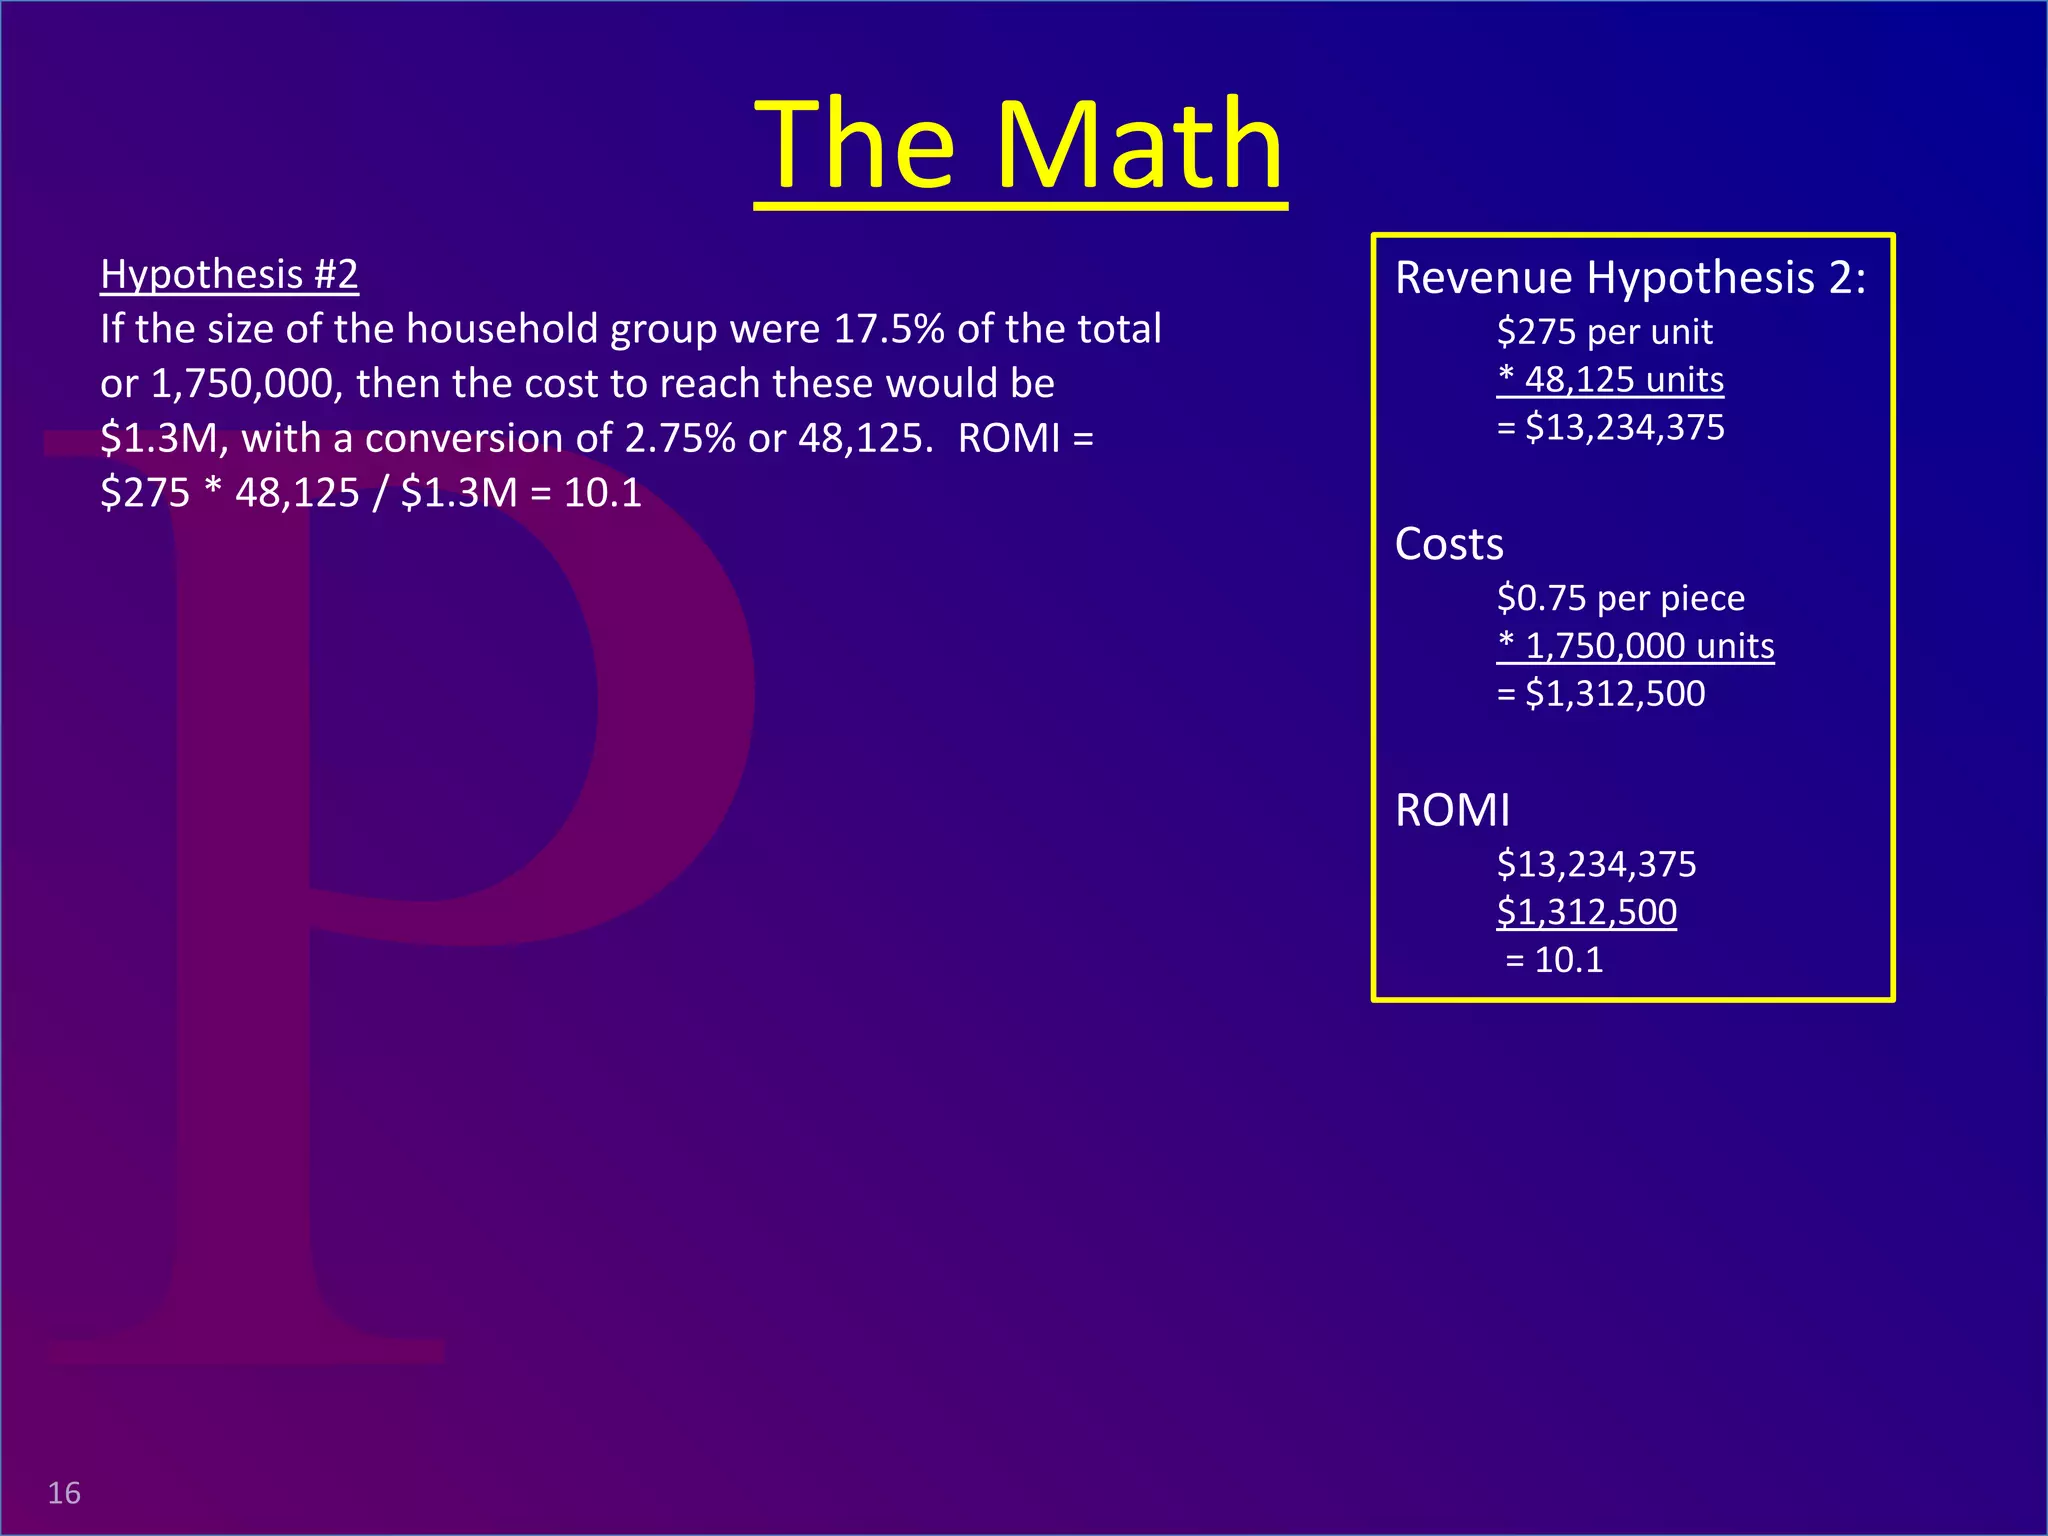
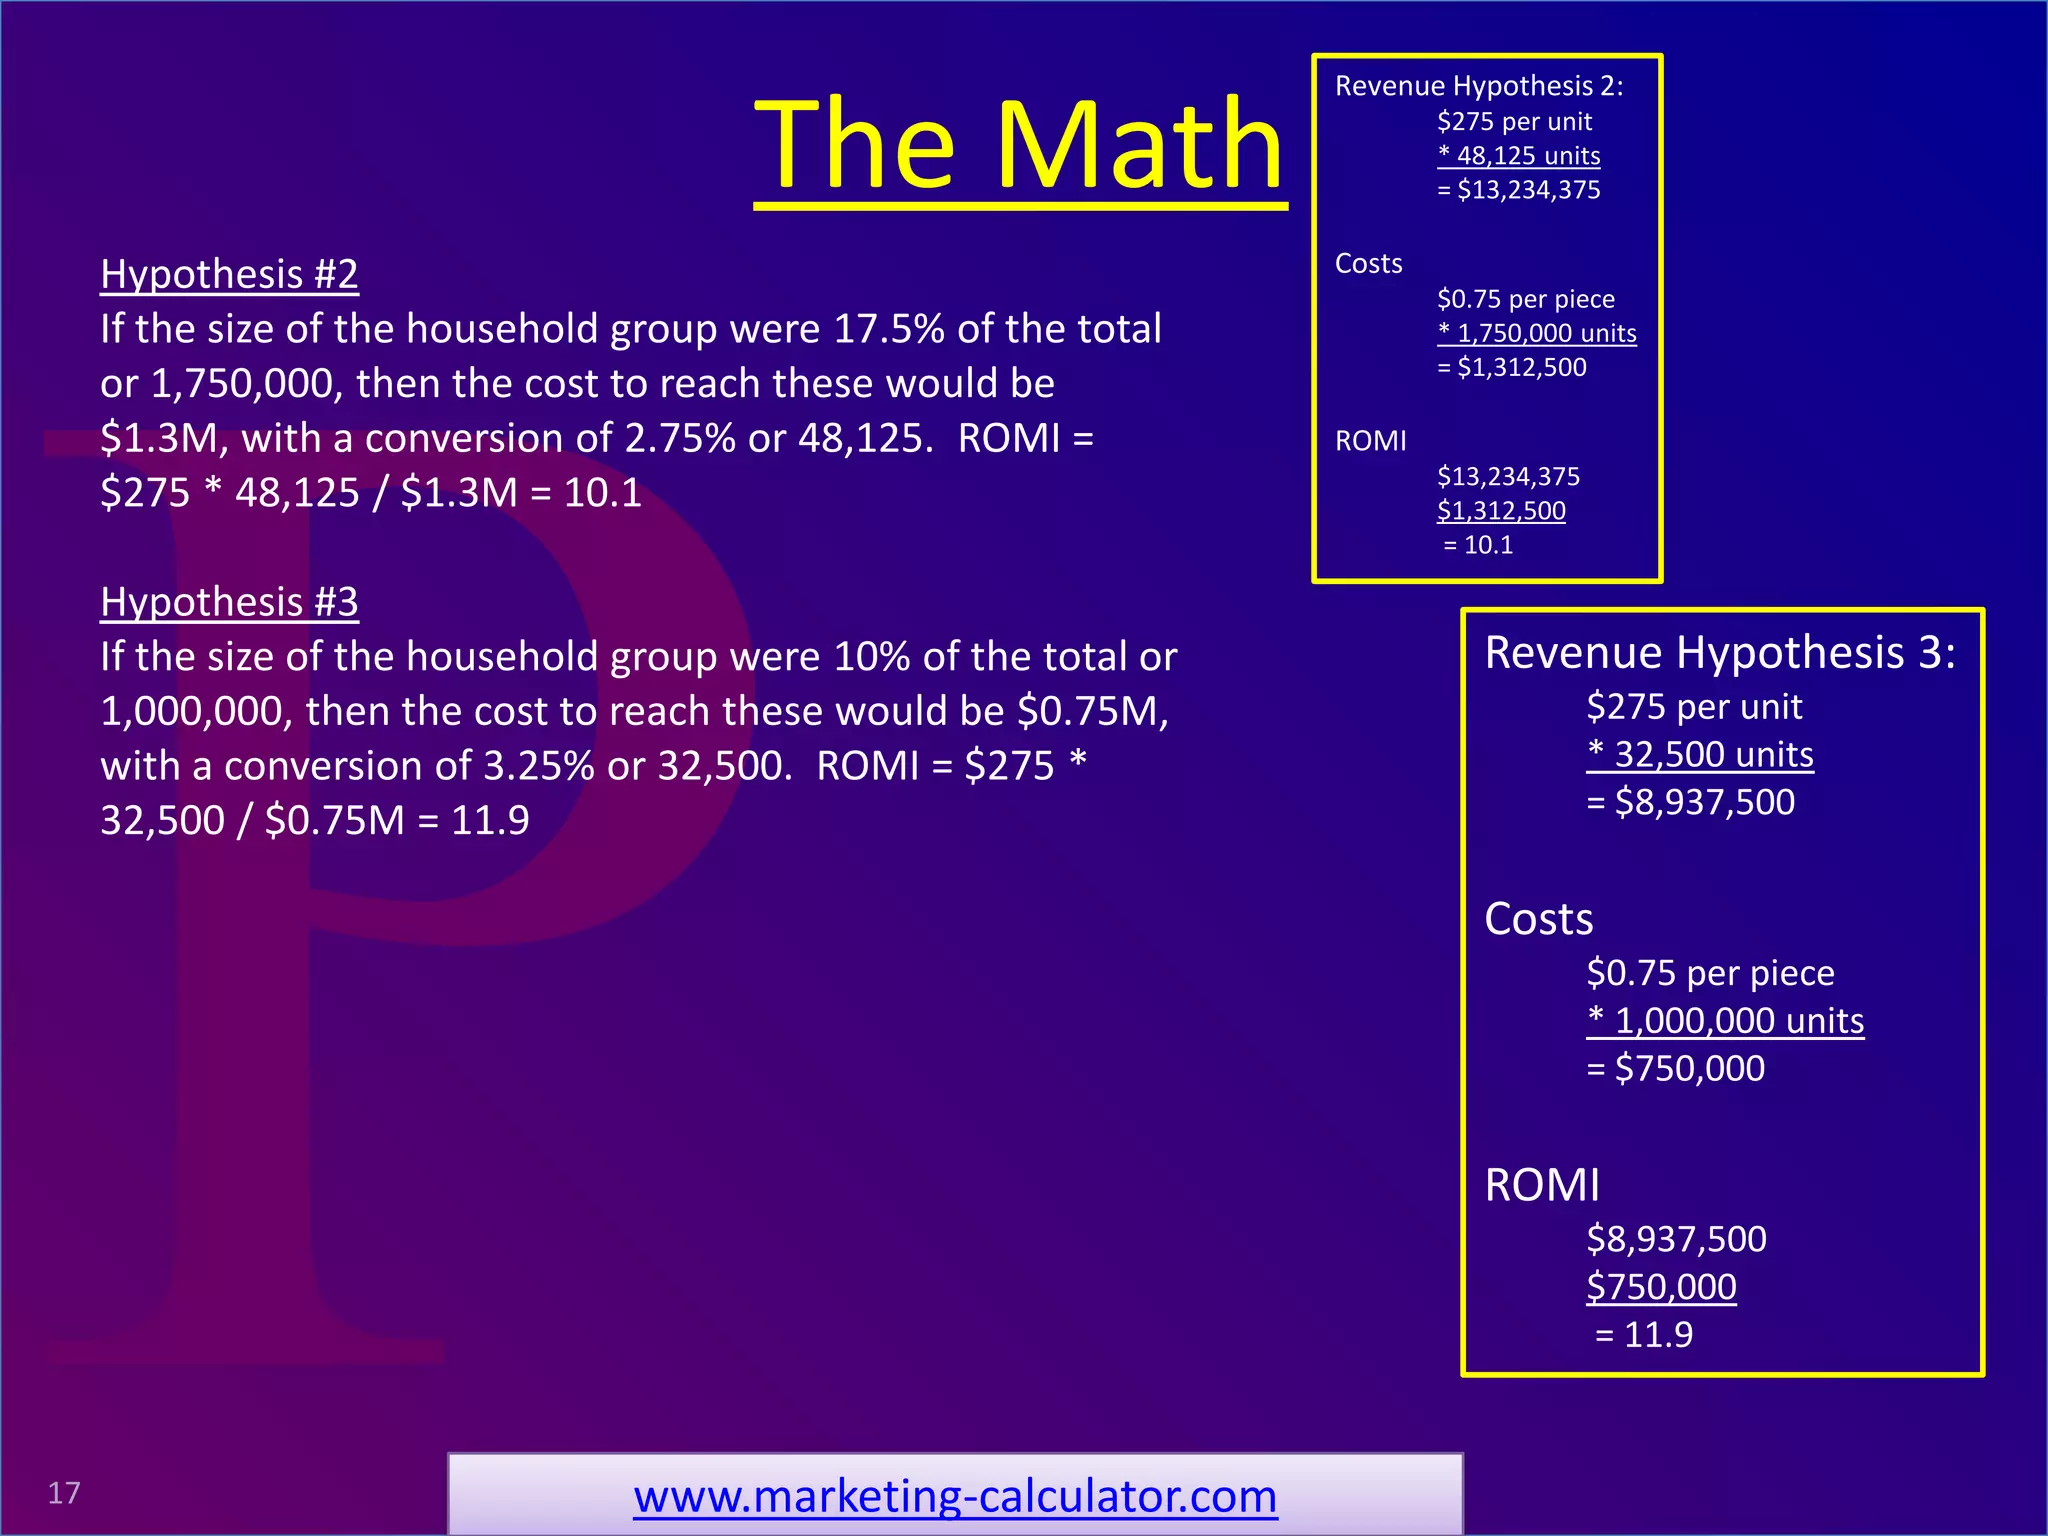
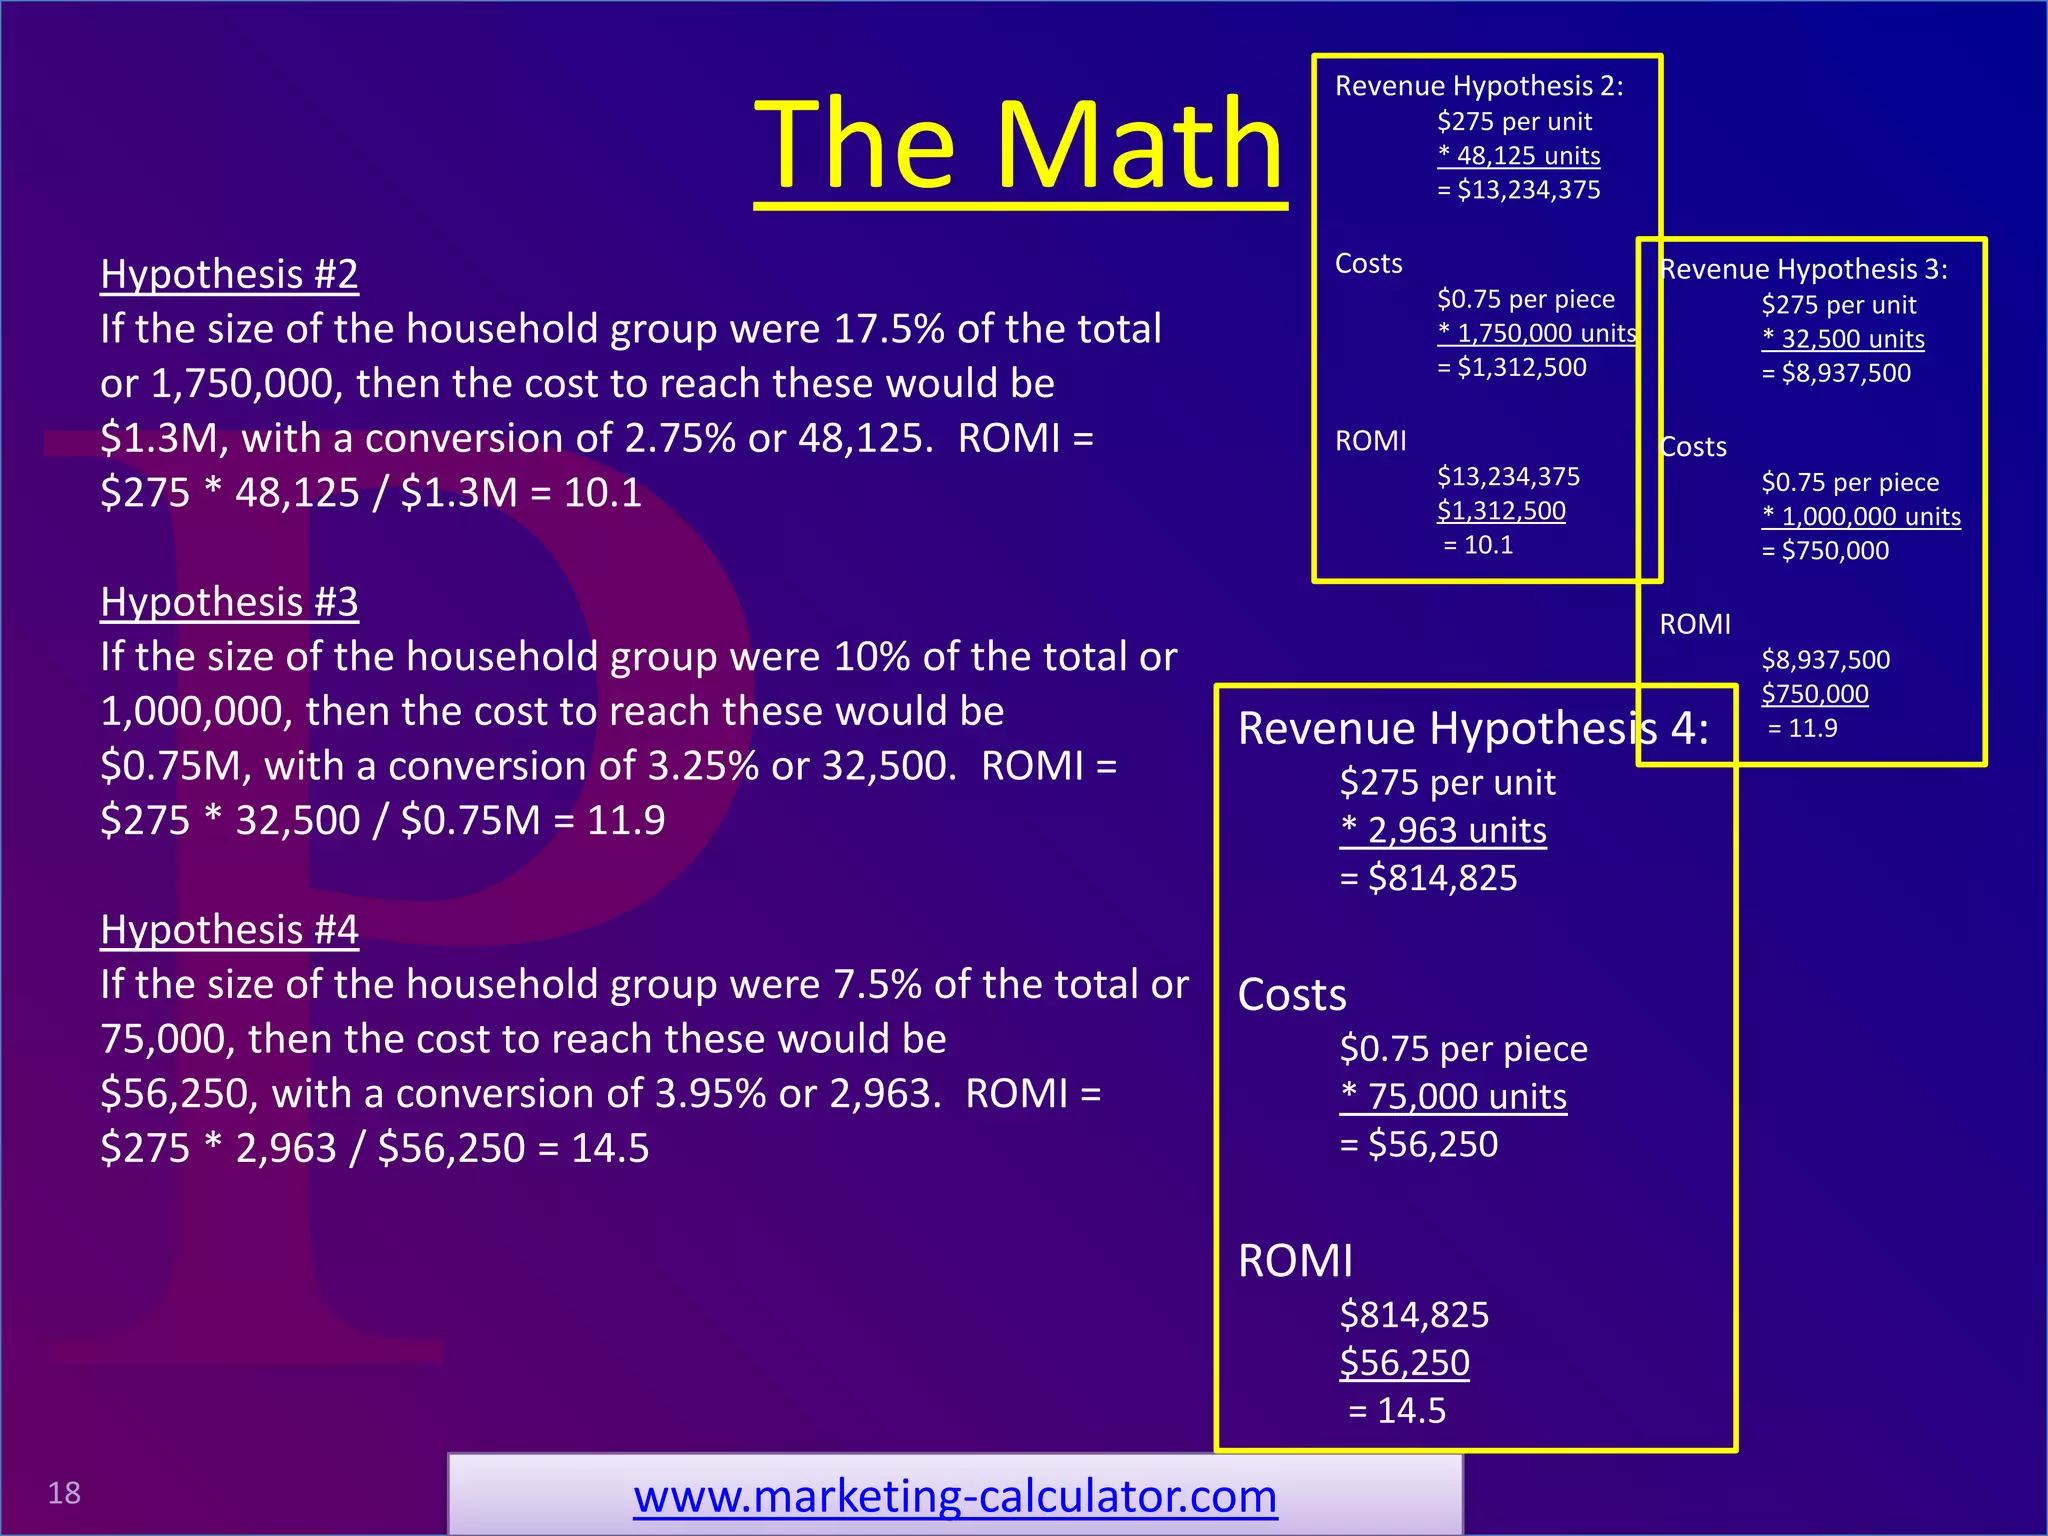
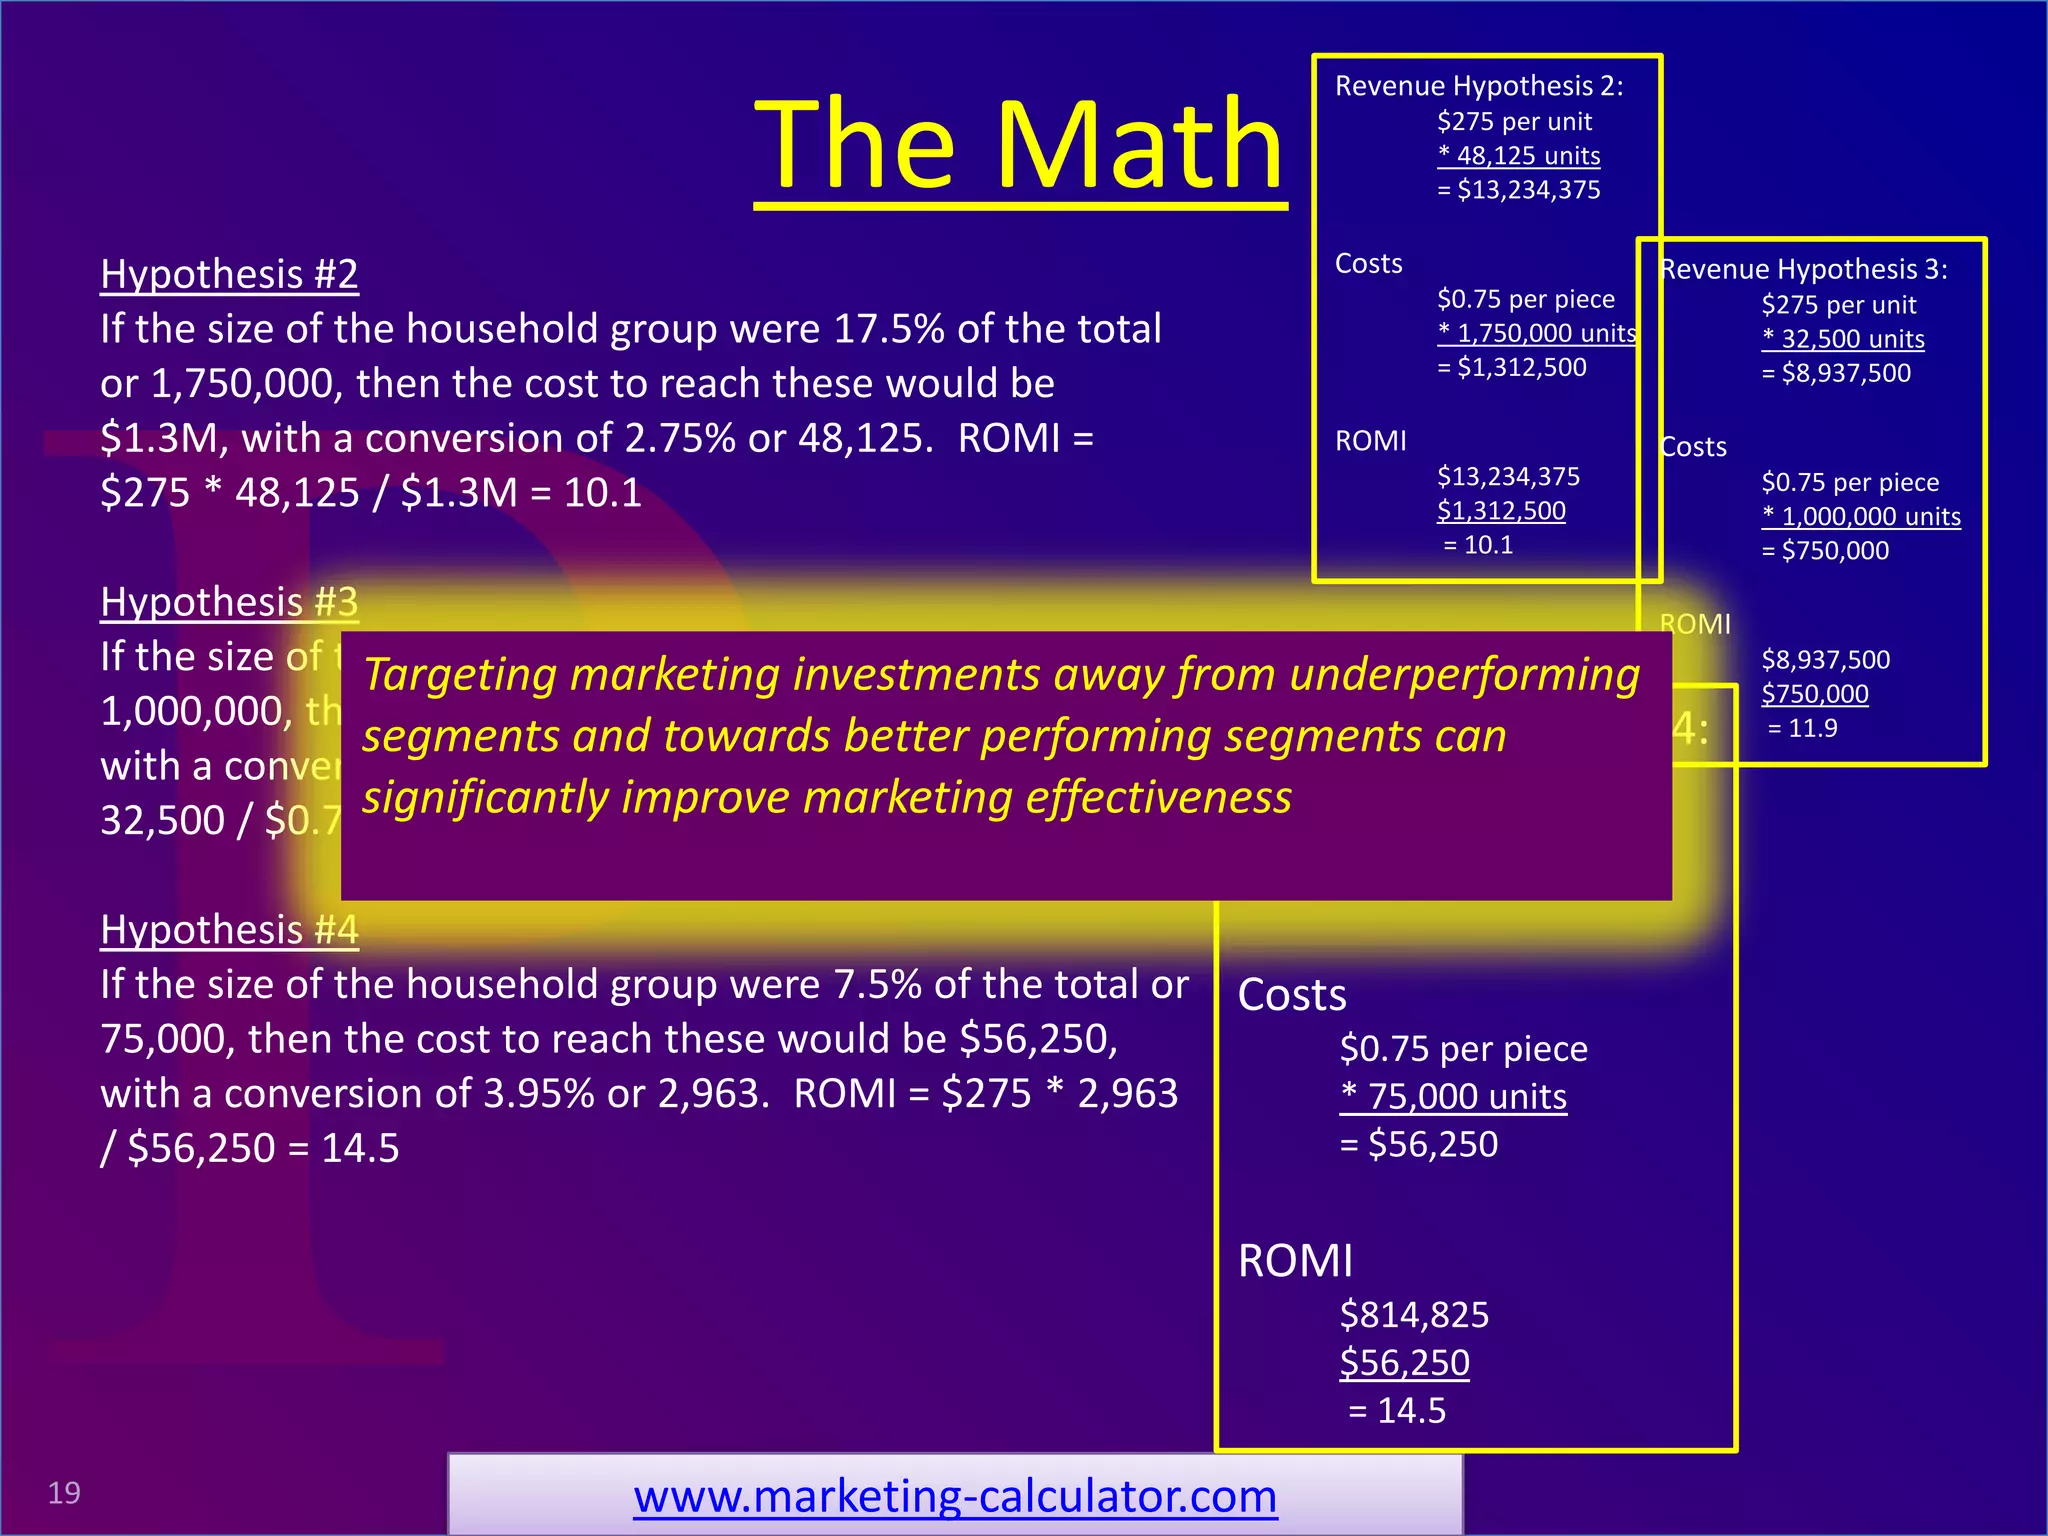
ProRelevant Marketing SolutionsProRelevant Marketing Solutions
Look-alike modeling
How to dial in your customers
www.marketing-calculator.com
ProRelevant Marketing Solutions2
Look-Alike Models are used to build larger audiences from smaller audience
segments to create reach for advertisers. They reflect similar characteristics
to a benchmark set of characteristics the original audience segment
represents, such as in-market kitchen-appliance shoppers.
Look-Alike Modeling
www.marketing-calculator.com
ProRelevant Marketing Solutions3
Look-Alike Models are used to build larger audiences from smaller audience
segments to create reach for advertisers. They reflect similar characteristics
to a benchmark set of characteristics the original audience segment
represents, such as in-market kitchen-appliance shoppers.
Look-Alike Modeling
www.marketing-calculator.com
Generally, the higher the
marketer's tolerance for
loosening the model, the
larger the segment can
become.
ProRelevant Marketing Solutions4
Let’s say that a certain demographic is
more likely to purchase than another. For
example a household with income over
$100,000 per year, own their own home
and have children. Let’s say that they are
50% more likely to purchase than the
average.
This segment would index at 150%.
Demographic Segmentation
www.marketing-calculator.com
ProRelevant Marketing Solutions5
Let’s say there is another group of single
males living in apartments and they are
33% less likely to purchase than the
average.
This segment would index at 67%.
Demographic Segmentation
www.marketing-calculator.com
Let’s say that a certain demographic is
more likely to purchase than another. For
example a household with income over
$100,000 per year, own their own home
and have children. Let’s say that they are
50% more likely to purchase than the
average.
This segment would index at 150%.
ProRelevant Marketing Solutions6
Index: +150%
Index: +67%
Demographic Segmentation
www.marketing-calculator.com
Let’s say there is another group of single
males living in apartments and they are
33% less likely to purchase than the
average.
This segment would index at 67%.
Let’s say that a certain demographic is
more likely to purchase than another. For
example a household with income over
$100,000 per year, own their own home
and have children. Let’s say that they are
50% more likely to purchase than the
average.
This segment would index at 150%.
ProRelevant Marketing Solutions7
No segmentation (Base):
Let’s say the total market size is 10,000,000. To reach
these 10,000,000 at 75cents per piece costs $7.5M. Let’s
say we sell a product for $275 each.
If the average response rate is 1%, then it would cost
$7.5M for 100,000 conversions. ROMI = $275 * 100,000 /
$7.5M = 3.7
The Math
www.marketing-calculator.com
Revenue (Base):
$275 per unit
* 100,000 units
= $27,500,000
Costs
$0.75 per piece
* 10,000,000 units
= $7,500,000
ROMI (Revenue ÷ Cost)
$27,500,000
$7,500,000
= 3.7
ProRelevant Marketing Solutions8
No Segmentation (Base):
Let’s say the total market size is 10,000,000. To reach
these 10,000,000 at 75cents per piece costs $7.5M. Let’s
say we sell a product for $275 each.
If the average response rate is 1%, then it would cost
$7.5M for 100,000 conversions. ROMI = $275 * 100,000 /
$7.5M = 3.7
Example 1
If the size of the household group were 33% of the total or
3,300,000, then the cost to reach these would be $2.5M,
with a conversion of 1.5% or 49,500. ROMI = $275 *
49,500 / $2.5M = 5.4
The Math
www.marketing-calculator.com
Revenue (Base):
$275 per unit
* 100,000 units
= $27,500,000
Costs
$0.75 per piece
* 10,000,000 units
= $7,500,000
ROMI
$27,500,000
$7,500,000
= 3.7
Revenue (Ex.1):
$275 per unit
* 49,500 units
= $13,612,500
Costs
$0.75 per piece
* 3,300,000 units
= $2,500,000
ROMI
$13,612,500
$2,500,000
= 5.4
ProRelevant Marketing Solutions9
No Segmentation (Base):
Let’s say the total market size is 10,000,000. To reach
these 10,000,000 at 75cents per piece costs $7.5M. Let’s
say we sell a product for $275 each.
If the average response rate is 1%, then it would cost
$7.5M for 100,000 conversions. ROMI = $275 * 100,000 /
$7.5M = 3.7
Example 1
If the size of the household group were 33% of the total or
3,300,000, then the cost to reach these would be
$2.5M, with a conversion of 1.5% or 49,500. ROMI = $275
* 49,500 / $2.5M = 5.4
Example 2
If the size of the solo apartment group were the other 67%
of the total or 6,700,000, then the cost to reach these
would be $5M, with a conversion of 0.67% or 44,890.
ROMI = $275 * 44,890 / $5M = 2.5
The Math
www.marketing-calculator.com
Revenue (Base):
$275 per unit
* 100,000 units
= $27,500,000
Costs
$0.75 per piece
* 10,000,000 units
= $7,500,000
ROMI
$27,500,000
$7,500,000
= 3.7
Revenue (Ex.1):
$275 per unit
* 49,500 units
= $13,612,500
Costs
$0.75 per piece
* 3,300,000 units
= $2,500,000
ROMI
$13,612,500
$2,500,000
= 5.4
Revenue (Ex.2):
$275 per unit
* 44,890 units
= $12,344,750
Costs
$0.75 per piece
* 6,700,000 units
= $5,000,000
ROMI
$13,612,500
$2,500,000
= 2.5
ProRelevant Marketing Solutions10
No Segmentation (Base):
Let’s say the total market size is 10,000,000. To reach
these 10,000,000 at 75cents per piece costs $7.5M. Let’s
say we sell a product for $275 each.
If the average response rate is 1%, then it would cost
$7.5M for 100,000 conversions. ROMI = $275 * 100,000 /
$7.5M = 3.7
Example 1
If the size of the household group were 33% of the total or
3,300,000, then the cost to reach these would be
$2.5M, with a conversion of 1.5% or 49,500. ROMI = $275
* 49,500 / $2.5M = 5.4
Example 2
If the size of the solo apartment group were the other 67%
of the total or 6,700,000, then the cost to reach these
would be $5M, with a conversion of 0.67% or 44,890.
ROMI = $275 * 44,890 / $5M = 2.5
The Math
www.marketing-calculator.com
Revenue (Base):
$275 per unit
* 100,000 units
= $27,500,000
Costs
$0.75 per piece
* 10,000,000 units
= $7,500,000
ROMI
$27,500,000
$7,500,000
= 3.7
Revenue (Ex.1):
$275 per unit
* 49,500 units
= $13,612,500
Costs
$0.75 per piece
* 3,300,000 units
= $2,500,000
ROMI
$13,612,500
$2,500,000
= 5.4
Revenue (Ex.2):
$275 per unit
* 44,890 units
= $12,344,750
Costs
$0.75 per piece
* 6,700,000 units
= $5,000,000
ROMI
$13,612,500
$2,500,000
= 2.5
Targeting marketing investments away from underperforming
segments and towards better performing segments can
significantly improve marketing effectiveness
ProRelevant Marketing Solutions11
Index: +225%
Hypothesis #1
But a sub-segment within the male apartment dwellers could be
very lucrative
www.marketing-calculator.com
ProRelevant Marketing Solutions12
Index: +225%
Hypothesis #2
Index: +275%
Demographics and behavioral micro-segment
Hypothesis #1
But a sub-segment within the male apartment dwellers could be
very lucrative
www.marketing-calculator.com
ProRelevant Marketing Solutions13
Demographics and behavioral and mass media micro-segment
Hypothesis #3
Index: +275%
325%
Further micro-segmentation
www.marketing-calculator.com
ProRelevant Marketing Solutions14
Demographics and behavioral and mass media micro-segment
Demographics and behavioral and mass media and seasonality micro-segment
Hypothesis #3
Index: +275%
325%
Hypothesis #4
Index: +275%
325%
395%%
Further micro-segmentation
www.marketing-calculator.com
ProRelevant Marketing Solutions15
Hypothesis #1:
Let’s say the total market size is 3,300,000. To reach these
3,300,000 at 75cents per piece costs $2.48M. Let’s say we
sell a product for $275 each.
If the average response rate is 2.25%, then it would cost
$2.475M for 74,250 conversions. ROMI = $275 * 74,250 /
$2.475M = 8.25
The Math
www.marketing-calculator.com
Revenue Hypothesis 1:
$275 per unit
* 74,250 units
= $20,418,750
Costs
$0.75 per piece
* 3,300,000 units
= $2,475,000
ROMI (Revenue ÷ Cost)
$20,418,750
$2,475,000
= 8.25
ProRelevant Marketing Solutions16
Hypothesis #2
If the size of the household group were 17.5% of the total
or 1,750,000, then the cost to reach these would be
$1.3M, with a conversion of 2.75% or 48,125. ROMI =
$275 * 48,125 / $1.3M = 10.1
Revenue Hypothesis 2:
$275 per unit
* 48,125 units
= $13,234,375
Costs
$0.75 per piece
* 1,750,000 units
= $1,312,500
ROMI
$13,234,375
$1,312,500
= 10.1
The Math
ProRelevant Marketing Solutions17
The Math
www.marketing-calculator.com
Hypothesis #2
If the size of the household group were 17.5% of the total
or 1,750,000, then the cost to reach these would be
$1.3M, with a conversion of 2.75% or 48,125. ROMI =
$275 * 48,125 / $1.3M = 10.1
Hypothesis #3
If the size of the household group were 10% of the total or
1,000,000, then the cost to reach these would be $0.75M,
with a conversion of 3.25% or 32,500. ROMI = $275 *
32,500 / $0.75M = 11.9
Revenue Hypothesis 2:
$275 per unit
* 48,125 units
= $13,234,375
Costs
$0.75 per piece
* 1,750,000 units
= $1,312,500
ROMI
$13,234,375
$1,312,500
= 10.1
Revenue Hypothesis 3:
$275 per unit
* 32,500 units
= $8,937,500
Costs
$0.75 per piece
* 1,000,000 units
= $750,000
ROMI
$8,937,500
$750,000
= 11.9
ProRelevant Marketing Solutions18
The Math
www.marketing-calculator.com
Hypothesis #2
If the size of the household group were 17.5% of the total
or 1,750,000, then the cost to reach these would be
$1.3M, with a conversion of 2.75% or 48,125. ROMI =
$275 * 48,125 / $1.3M = 10.1
Hypothesis #3
If the size of the household group were 10% of the total or
1,000,000, then the cost to reach these would be
$0.75M, with a conversion of 3.25% or 32,500. ROMI =
$275 * 32,500 / $0.75M = 11.9
Hypothesis #4
If the size of the household group were 7.5% of the total or
75,000, then the cost to reach these would be
$56,250, with a conversion of 3.95% or 2,963. ROMI =
$275 * 2,963 / $56,250 = 14.5
Revenue Hypothesis 2:
$275 per unit
* 48,125 units
= $13,234,375
Costs
$0.75 per piece
* 1,750,000 units
= $1,312,500
ROMI
$13,234,375
$1,312,500
= 10.1
Revenue Hypothesis 3:
$275 per unit
* 32,500 units
= $8,937,500
Costs
$0.75 per piece
* 1,000,000 units
= $750,000
ROMI
$8,937,500
$750,000
= 11.9Revenue Hypothesis 4:
$275 per unit
* 2,963 units
= $814,825
Costs
$0.75 per piece
* 75,000 units
= $56,250
ROMI
$814,825
$56,250
= 14.5
ProRelevant Marketing Solutions19
The Math
www.marketing-calculator.com
Hypothesis #2
If the size of the household group were 17.5% of the total
or 1,750,000, then the cost to reach these would be
$1.3M, with a conversion of 2.75% or 48,125. ROMI =
$275 * 48,125 / $1.3M = 10.1
Hypothesis #3
If the size of the household group were 10% of the total or
1,000,000, then the cost to reach these would be $0.75M,
with a conversion of 3.25% or 32,500. ROMI = $275 *
32,500 / $0.75M = 11.9
Hypothesis #4
If the size of the household group were 7.5% of the total or
75,000, then the cost to reach these would be $56,250,
with a conversion of 3.95% or 2,963. ROMI = $275 * 2,963
/ $56,250 = 14.5
Revenue Hypothesis 2:
$275 per unit
* 48,125 units
= $13,234,375
Costs
$0.75 per piece
* 1,750,000 units
= $1,312,500
ROMI
$13,234,375
$1,312,500
= 10.1
Revenue Hypothesis 3:
$275 per unit
* 32,500 units
= $8,937,500
Costs
$0.75 per piece
* 1,000,000 units
= $750,000
ROMI
$8,937,500
$750,000
= 11.9Revenue Hypothesis 4:
$275 per unit
* 2,963 units
= $814,825
Costs
$0.75 per piece
* 75,000 units
= $56,250
ROMI
$814,825
$56,250
= 14.5
Targeting marketing investments away from underperforming
segments and towards better performing segments can
significantly improve marketing effectiveness
ProRelevant Marketing Solutions20
Facebook will now begin to offer this same
capability for their fan pages and advertising.
This will yield a significantly higher targeting
opportunity, improved marketing ROI and better
response. There will be much less marketing
wastage in Facebook
ProRelevant Marketing Solutions21
The conclusion generally: the increase in marketing effectiveness is
significant.
Based on the best hypotheses, the ‘budget’ can be spent much more
effectively.
In this case we improved the ROMI from 5.4 to 14.3
There is however a cost to look alike modeling. The analytics and potentially
now from Facebook, the cost of targeting these micro-segments will be higher
than targeting the overall segments. The marketer simply has to weigh the
incremental cost of look alike modeling against the incremental response and
effectiveness
The marketer than tests/simulates different hypotheses against the data to
determine best and most effective micro-targeting campaign investments.
The best campaigns are chosen, best to worst until the budget is fully
allocated.
Look-Alike Modeling Conclusion
www.marketing-calculator.com
ProRelevant Marketing Solutions22
www.ProRelevant.com
Marketing@ProRelevant.com
Guy R. Powell
Pres. ProRelevant
www.Marketing-Calculator.com
www.ROIofSocialMedia.com
ProRelevant Marketing SolutionsProRelevant Marketing Solutions
Go to our blog @
http://www.Marketing-Calculator.com
ProRelevant.com
Guy R. Powell
Thank you

Facebook and Look-Alike Modeling: A Short Primer

  • 1.
    ProRelevant Marketing SolutionsProRelevantMarketing Solutions Look-alike modeling How to dial in your customers www.marketing-calculator.com
  • 2.
    ProRelevant Marketing Solutions2 Look-AlikeModels are used to build larger audiences from smaller audience segments to create reach for advertisers. They reflect similar characteristics to a benchmark set of characteristics the original audience segment represents, such as in-market kitchen-appliance shoppers. Look-Alike Modeling www.marketing-calculator.com
  • 3.
    ProRelevant Marketing Solutions3 Look-AlikeModels are used to build larger audiences from smaller audience segments to create reach for advertisers. They reflect similar characteristics to a benchmark set of characteristics the original audience segment represents, such as in-market kitchen-appliance shoppers. Look-Alike Modeling www.marketing-calculator.com Generally, the higher the marketer's tolerance for loosening the model, the larger the segment can become.
  • 4.
    ProRelevant Marketing Solutions4 Let’ssay that a certain demographic is more likely to purchase than another. For example a household with income over $100,000 per year, own their own home and have children. Let’s say that they are 50% more likely to purchase than the average. This segment would index at 150%. Demographic Segmentation www.marketing-calculator.com
  • 5.
    ProRelevant Marketing Solutions5 Let’ssay there is another group of single males living in apartments and they are 33% less likely to purchase than the average. This segment would index at 67%. Demographic Segmentation www.marketing-calculator.com Let’s say that a certain demographic is more likely to purchase than another. For example a household with income over $100,000 per year, own their own home and have children. Let’s say that they are 50% more likely to purchase than the average. This segment would index at 150%.
  • 6.
    ProRelevant Marketing Solutions6 Index:+150% Index: +67% Demographic Segmentation www.marketing-calculator.com Let’s say there is another group of single males living in apartments and they are 33% less likely to purchase than the average. This segment would index at 67%. Let’s say that a certain demographic is more likely to purchase than another. For example a household with income over $100,000 per year, own their own home and have children. Let’s say that they are 50% more likely to purchase than the average. This segment would index at 150%.
  • 7.
    ProRelevant Marketing Solutions7 Nosegmentation (Base): Let’s say the total market size is 10,000,000. To reach these 10,000,000 at 75cents per piece costs $7.5M. Let’s say we sell a product for $275 each. If the average response rate is 1%, then it would cost $7.5M for 100,000 conversions. ROMI = $275 * 100,000 / $7.5M = 3.7 The Math www.marketing-calculator.com Revenue (Base): $275 per unit * 100,000 units = $27,500,000 Costs $0.75 per piece * 10,000,000 units = $7,500,000 ROMI (Revenue ÷ Cost) $27,500,000 $7,500,000 = 3.7
  • 8.
    ProRelevant Marketing Solutions8 NoSegmentation (Base): Let’s say the total market size is 10,000,000. To reach these 10,000,000 at 75cents per piece costs $7.5M. Let’s say we sell a product for $275 each. If the average response rate is 1%, then it would cost $7.5M for 100,000 conversions. ROMI = $275 * 100,000 / $7.5M = 3.7 Example 1 If the size of the household group were 33% of the total or 3,300,000, then the cost to reach these would be $2.5M, with a conversion of 1.5% or 49,500. ROMI = $275 * 49,500 / $2.5M = 5.4 The Math www.marketing-calculator.com Revenue (Base): $275 per unit * 100,000 units = $27,500,000 Costs $0.75 per piece * 10,000,000 units = $7,500,000 ROMI $27,500,000 $7,500,000 = 3.7 Revenue (Ex.1): $275 per unit * 49,500 units = $13,612,500 Costs $0.75 per piece * 3,300,000 units = $2,500,000 ROMI $13,612,500 $2,500,000 = 5.4
  • 9.
    ProRelevant Marketing Solutions9 NoSegmentation (Base): Let’s say the total market size is 10,000,000. To reach these 10,000,000 at 75cents per piece costs $7.5M. Let’s say we sell a product for $275 each. If the average response rate is 1%, then it would cost $7.5M for 100,000 conversions. ROMI = $275 * 100,000 / $7.5M = 3.7 Example 1 If the size of the household group were 33% of the total or 3,300,000, then the cost to reach these would be $2.5M, with a conversion of 1.5% or 49,500. ROMI = $275 * 49,500 / $2.5M = 5.4 Example 2 If the size of the solo apartment group were the other 67% of the total or 6,700,000, then the cost to reach these would be $5M, with a conversion of 0.67% or 44,890. ROMI = $275 * 44,890 / $5M = 2.5 The Math www.marketing-calculator.com Revenue (Base): $275 per unit * 100,000 units = $27,500,000 Costs $0.75 per piece * 10,000,000 units = $7,500,000 ROMI $27,500,000 $7,500,000 = 3.7 Revenue (Ex.1): $275 per unit * 49,500 units = $13,612,500 Costs $0.75 per piece * 3,300,000 units = $2,500,000 ROMI $13,612,500 $2,500,000 = 5.4 Revenue (Ex.2): $275 per unit * 44,890 units = $12,344,750 Costs $0.75 per piece * 6,700,000 units = $5,000,000 ROMI $13,612,500 $2,500,000 = 2.5
  • 10.
    ProRelevant Marketing Solutions10 NoSegmentation (Base): Let’s say the total market size is 10,000,000. To reach these 10,000,000 at 75cents per piece costs $7.5M. Let’s say we sell a product for $275 each. If the average response rate is 1%, then it would cost $7.5M for 100,000 conversions. ROMI = $275 * 100,000 / $7.5M = 3.7 Example 1 If the size of the household group were 33% of the total or 3,300,000, then the cost to reach these would be $2.5M, with a conversion of 1.5% or 49,500. ROMI = $275 * 49,500 / $2.5M = 5.4 Example 2 If the size of the solo apartment group were the other 67% of the total or 6,700,000, then the cost to reach these would be $5M, with a conversion of 0.67% or 44,890. ROMI = $275 * 44,890 / $5M = 2.5 The Math www.marketing-calculator.com Revenue (Base): $275 per unit * 100,000 units = $27,500,000 Costs $0.75 per piece * 10,000,000 units = $7,500,000 ROMI $27,500,000 $7,500,000 = 3.7 Revenue (Ex.1): $275 per unit * 49,500 units = $13,612,500 Costs $0.75 per piece * 3,300,000 units = $2,500,000 ROMI $13,612,500 $2,500,000 = 5.4 Revenue (Ex.2): $275 per unit * 44,890 units = $12,344,750 Costs $0.75 per piece * 6,700,000 units = $5,000,000 ROMI $13,612,500 $2,500,000 = 2.5 Targeting marketing investments away from underperforming segments and towards better performing segments can significantly improve marketing effectiveness
  • 11.
    ProRelevant Marketing Solutions11 Index:+225% Hypothesis #1 But a sub-segment within the male apartment dwellers could be very lucrative www.marketing-calculator.com
  • 12.
    ProRelevant Marketing Solutions12 Index:+225% Hypothesis #2 Index: +275% Demographics and behavioral micro-segment Hypothesis #1 But a sub-segment within the male apartment dwellers could be very lucrative www.marketing-calculator.com
  • 13.
    ProRelevant Marketing Solutions13 Demographicsand behavioral and mass media micro-segment Hypothesis #3 Index: +275% 325% Further micro-segmentation www.marketing-calculator.com
  • 14.
    ProRelevant Marketing Solutions14 Demographicsand behavioral and mass media micro-segment Demographics and behavioral and mass media and seasonality micro-segment Hypothesis #3 Index: +275% 325% Hypothesis #4 Index: +275% 325% 395%% Further micro-segmentation www.marketing-calculator.com
  • 15.
    ProRelevant Marketing Solutions15 Hypothesis#1: Let’s say the total market size is 3,300,000. To reach these 3,300,000 at 75cents per piece costs $2.48M. Let’s say we sell a product for $275 each. If the average response rate is 2.25%, then it would cost $2.475M for 74,250 conversions. ROMI = $275 * 74,250 / $2.475M = 8.25 The Math www.marketing-calculator.com Revenue Hypothesis 1: $275 per unit * 74,250 units = $20,418,750 Costs $0.75 per piece * 3,300,000 units = $2,475,000 ROMI (Revenue ÷ Cost) $20,418,750 $2,475,000 = 8.25
  • 16.
    ProRelevant Marketing Solutions16 Hypothesis#2 If the size of the household group were 17.5% of the total or 1,750,000, then the cost to reach these would be $1.3M, with a conversion of 2.75% or 48,125. ROMI = $275 * 48,125 / $1.3M = 10.1 Revenue Hypothesis 2: $275 per unit * 48,125 units = $13,234,375 Costs $0.75 per piece * 1,750,000 units = $1,312,500 ROMI $13,234,375 $1,312,500 = 10.1 The Math
  • 17.
    ProRelevant Marketing Solutions17 TheMath www.marketing-calculator.com Hypothesis #2 If the size of the household group were 17.5% of the total or 1,750,000, then the cost to reach these would be $1.3M, with a conversion of 2.75% or 48,125. ROMI = $275 * 48,125 / $1.3M = 10.1 Hypothesis #3 If the size of the household group were 10% of the total or 1,000,000, then the cost to reach these would be $0.75M, with a conversion of 3.25% or 32,500. ROMI = $275 * 32,500 / $0.75M = 11.9 Revenue Hypothesis 2: $275 per unit * 48,125 units = $13,234,375 Costs $0.75 per piece * 1,750,000 units = $1,312,500 ROMI $13,234,375 $1,312,500 = 10.1 Revenue Hypothesis 3: $275 per unit * 32,500 units = $8,937,500 Costs $0.75 per piece * 1,000,000 units = $750,000 ROMI $8,937,500 $750,000 = 11.9
  • 18.
    ProRelevant Marketing Solutions18 TheMath www.marketing-calculator.com Hypothesis #2 If the size of the household group were 17.5% of the total or 1,750,000, then the cost to reach these would be $1.3M, with a conversion of 2.75% or 48,125. ROMI = $275 * 48,125 / $1.3M = 10.1 Hypothesis #3 If the size of the household group were 10% of the total or 1,000,000, then the cost to reach these would be $0.75M, with a conversion of 3.25% or 32,500. ROMI = $275 * 32,500 / $0.75M = 11.9 Hypothesis #4 If the size of the household group were 7.5% of the total or 75,000, then the cost to reach these would be $56,250, with a conversion of 3.95% or 2,963. ROMI = $275 * 2,963 / $56,250 = 14.5 Revenue Hypothesis 2: $275 per unit * 48,125 units = $13,234,375 Costs $0.75 per piece * 1,750,000 units = $1,312,500 ROMI $13,234,375 $1,312,500 = 10.1 Revenue Hypothesis 3: $275 per unit * 32,500 units = $8,937,500 Costs $0.75 per piece * 1,000,000 units = $750,000 ROMI $8,937,500 $750,000 = 11.9Revenue Hypothesis 4: $275 per unit * 2,963 units = $814,825 Costs $0.75 per piece * 75,000 units = $56,250 ROMI $814,825 $56,250 = 14.5
  • 19.
    ProRelevant Marketing Solutions19 TheMath www.marketing-calculator.com Hypothesis #2 If the size of the household group were 17.5% of the total or 1,750,000, then the cost to reach these would be $1.3M, with a conversion of 2.75% or 48,125. ROMI = $275 * 48,125 / $1.3M = 10.1 Hypothesis #3 If the size of the household group were 10% of the total or 1,000,000, then the cost to reach these would be $0.75M, with a conversion of 3.25% or 32,500. ROMI = $275 * 32,500 / $0.75M = 11.9 Hypothesis #4 If the size of the household group were 7.5% of the total or 75,000, then the cost to reach these would be $56,250, with a conversion of 3.95% or 2,963. ROMI = $275 * 2,963 / $56,250 = 14.5 Revenue Hypothesis 2: $275 per unit * 48,125 units = $13,234,375 Costs $0.75 per piece * 1,750,000 units = $1,312,500 ROMI $13,234,375 $1,312,500 = 10.1 Revenue Hypothesis 3: $275 per unit * 32,500 units = $8,937,500 Costs $0.75 per piece * 1,000,000 units = $750,000 ROMI $8,937,500 $750,000 = 11.9Revenue Hypothesis 4: $275 per unit * 2,963 units = $814,825 Costs $0.75 per piece * 75,000 units = $56,250 ROMI $814,825 $56,250 = 14.5 Targeting marketing investments away from underperforming segments and towards better performing segments can significantly improve marketing effectiveness
  • 20.
    ProRelevant Marketing Solutions20 Facebookwill now begin to offer this same capability for their fan pages and advertising. This will yield a significantly higher targeting opportunity, improved marketing ROI and better response. There will be much less marketing wastage in Facebook
  • 21.
    ProRelevant Marketing Solutions21 Theconclusion generally: the increase in marketing effectiveness is significant. Based on the best hypotheses, the ‘budget’ can be spent much more effectively. In this case we improved the ROMI from 5.4 to 14.3 There is however a cost to look alike modeling. The analytics and potentially now from Facebook, the cost of targeting these micro-segments will be higher than targeting the overall segments. The marketer simply has to weigh the incremental cost of look alike modeling against the incremental response and effectiveness The marketer than tests/simulates different hypotheses against the data to determine best and most effective micro-targeting campaign investments. The best campaigns are chosen, best to worst until the budget is fully allocated. Look-Alike Modeling Conclusion www.marketing-calculator.com
  • 22.
    ProRelevant Marketing Solutions22 www.ProRelevant.com Marketing@ProRelevant.com GuyR. Powell Pres. ProRelevant www.Marketing-Calculator.com www.ROIofSocialMedia.com
  • 23.
    ProRelevant Marketing SolutionsProRelevantMarketing Solutions Go to our blog @ http://www.Marketing-Calculator.com ProRelevant.com Guy R. Powell Thank you