Downloaded 46 times
![RHIPE
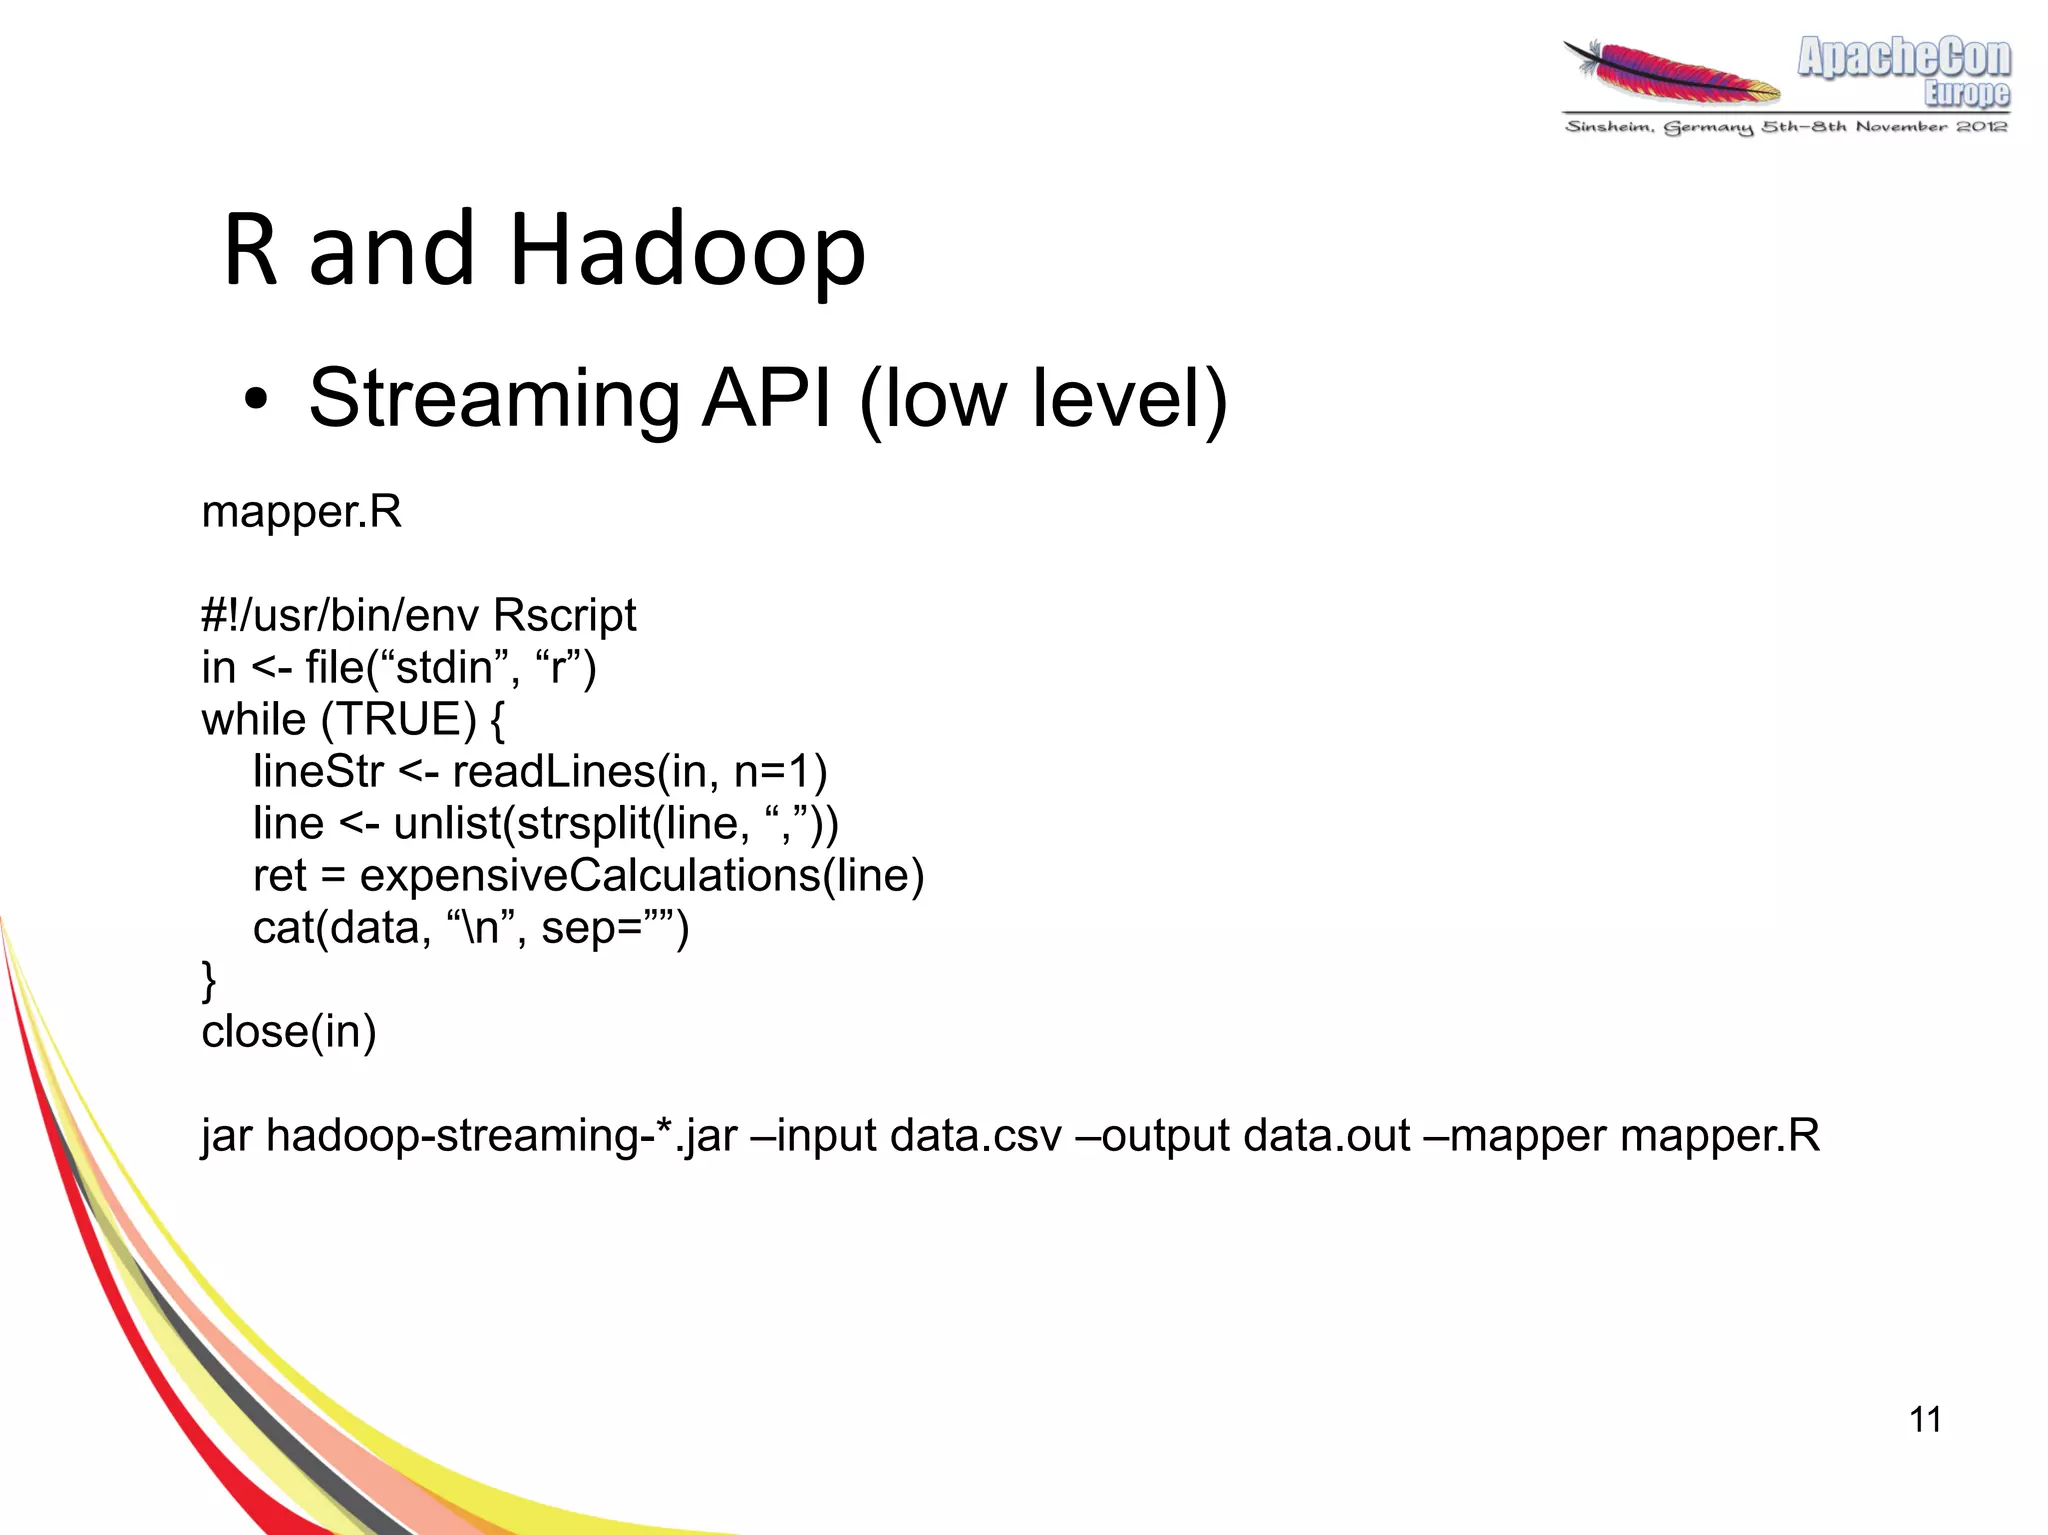
● Can use with your Hadoop cluster
● Write mappers/reduces using R only
map <- expression({
z <- f <- table(unlist(strsplit(unlist(
rhmr(map=map,reduce=reduce, map.values)," ")))
inout=c("text","sequence") n <- names(f)
,ifolder=filename p <- as.numeric(f)
,ofolder=sprintf("%s- sapply(seq_along(n),function(r)
out",filename)) rhcollect(n[r],p[r]))
})
job.result <-
rhstatus(rhex(z,async=TRUE), reduce <- expression(
mon.sec=2) pre={ total <- 0},
reduce = { total <-
total+sum(unlist(reduce.values)) },
post = { rhcollect(reduce.key,total) }
)
12
Example from Rhipe Wiki](https://image.slidesharecdn.com/rhadoopoo-121107053033-phpapp01/75/Extending-lifespan-with-Hadoop-and-R-12-2048.jpg)
![lapply()
m <- list(a = 1:10, b = exp(-3:3))
lapply(m, mean)$a
[1] 5.5
$b
[1] 4.535125
lapply(X, FUN)
returns a list of the same length as X, each element of which is
the result of applying FUN to the corresponding element of X.
15](https://image.slidesharecdn.com/rhadoopoo-121107053033-phpapp01/75/Extending-lifespan-with-Hadoop-and-R-15-2048.jpg)
![Segue in a cluster
> AnalysePearsonCorelation <- function(probe) {
A.vector <- experiments.matrix[probe,]
p.values <- c()
for(probe.name in rownames(experiments.matrix)) {
B.vector <- experiments.matrix[probe.name,]
p.values <- c(p.values, cor.test(A.vector, B.vector)$p.value)
}
return (p.values)
}
> # pearson.cor <- lapply(probes, AnalysePearsonCorelation)
Moving to the cloud in 3 lines of code!
16](https://image.slidesharecdn.com/rhadoopoo-121107053033-phpapp01/75/Extending-lifespan-with-Hadoop-and-R-16-2048.jpg)
![Segue in a cluster
> AnalysePearsonCorelation <- function(probe) {
A.vector <- experiments.matrix[probe,]
p.values <- c()
for(probe.name in rownames(experiments.matrix)) {
B.vector <- experiments.matrix[probe.name,]
p.values <- c(p.values, cor.test(A.vector, B.vector)$p.value)
}
return (p.values)
}
> # pearson.cor <- lapply(probes, AnalysePearsonCorelation)
> myCluster <- createCluster(numInstances=5,
masterBidPrice="0.68”, slaveBidPrice="0.68”,
masterInstanceType=”c1.xlarge”,
slaveInstanceType=”c1.xlarge”, copy.image=TRUE)
> pearson.cor <- emrlapply(myCluster, probes,
AnalysePearsonCorelation)
> stopCluster(myCluster)
17](https://image.slidesharecdn.com/rhadoopoo-121107053033-phpapp01/75/Extending-lifespan-with-Hadoop-and-R-17-2048.jpg)
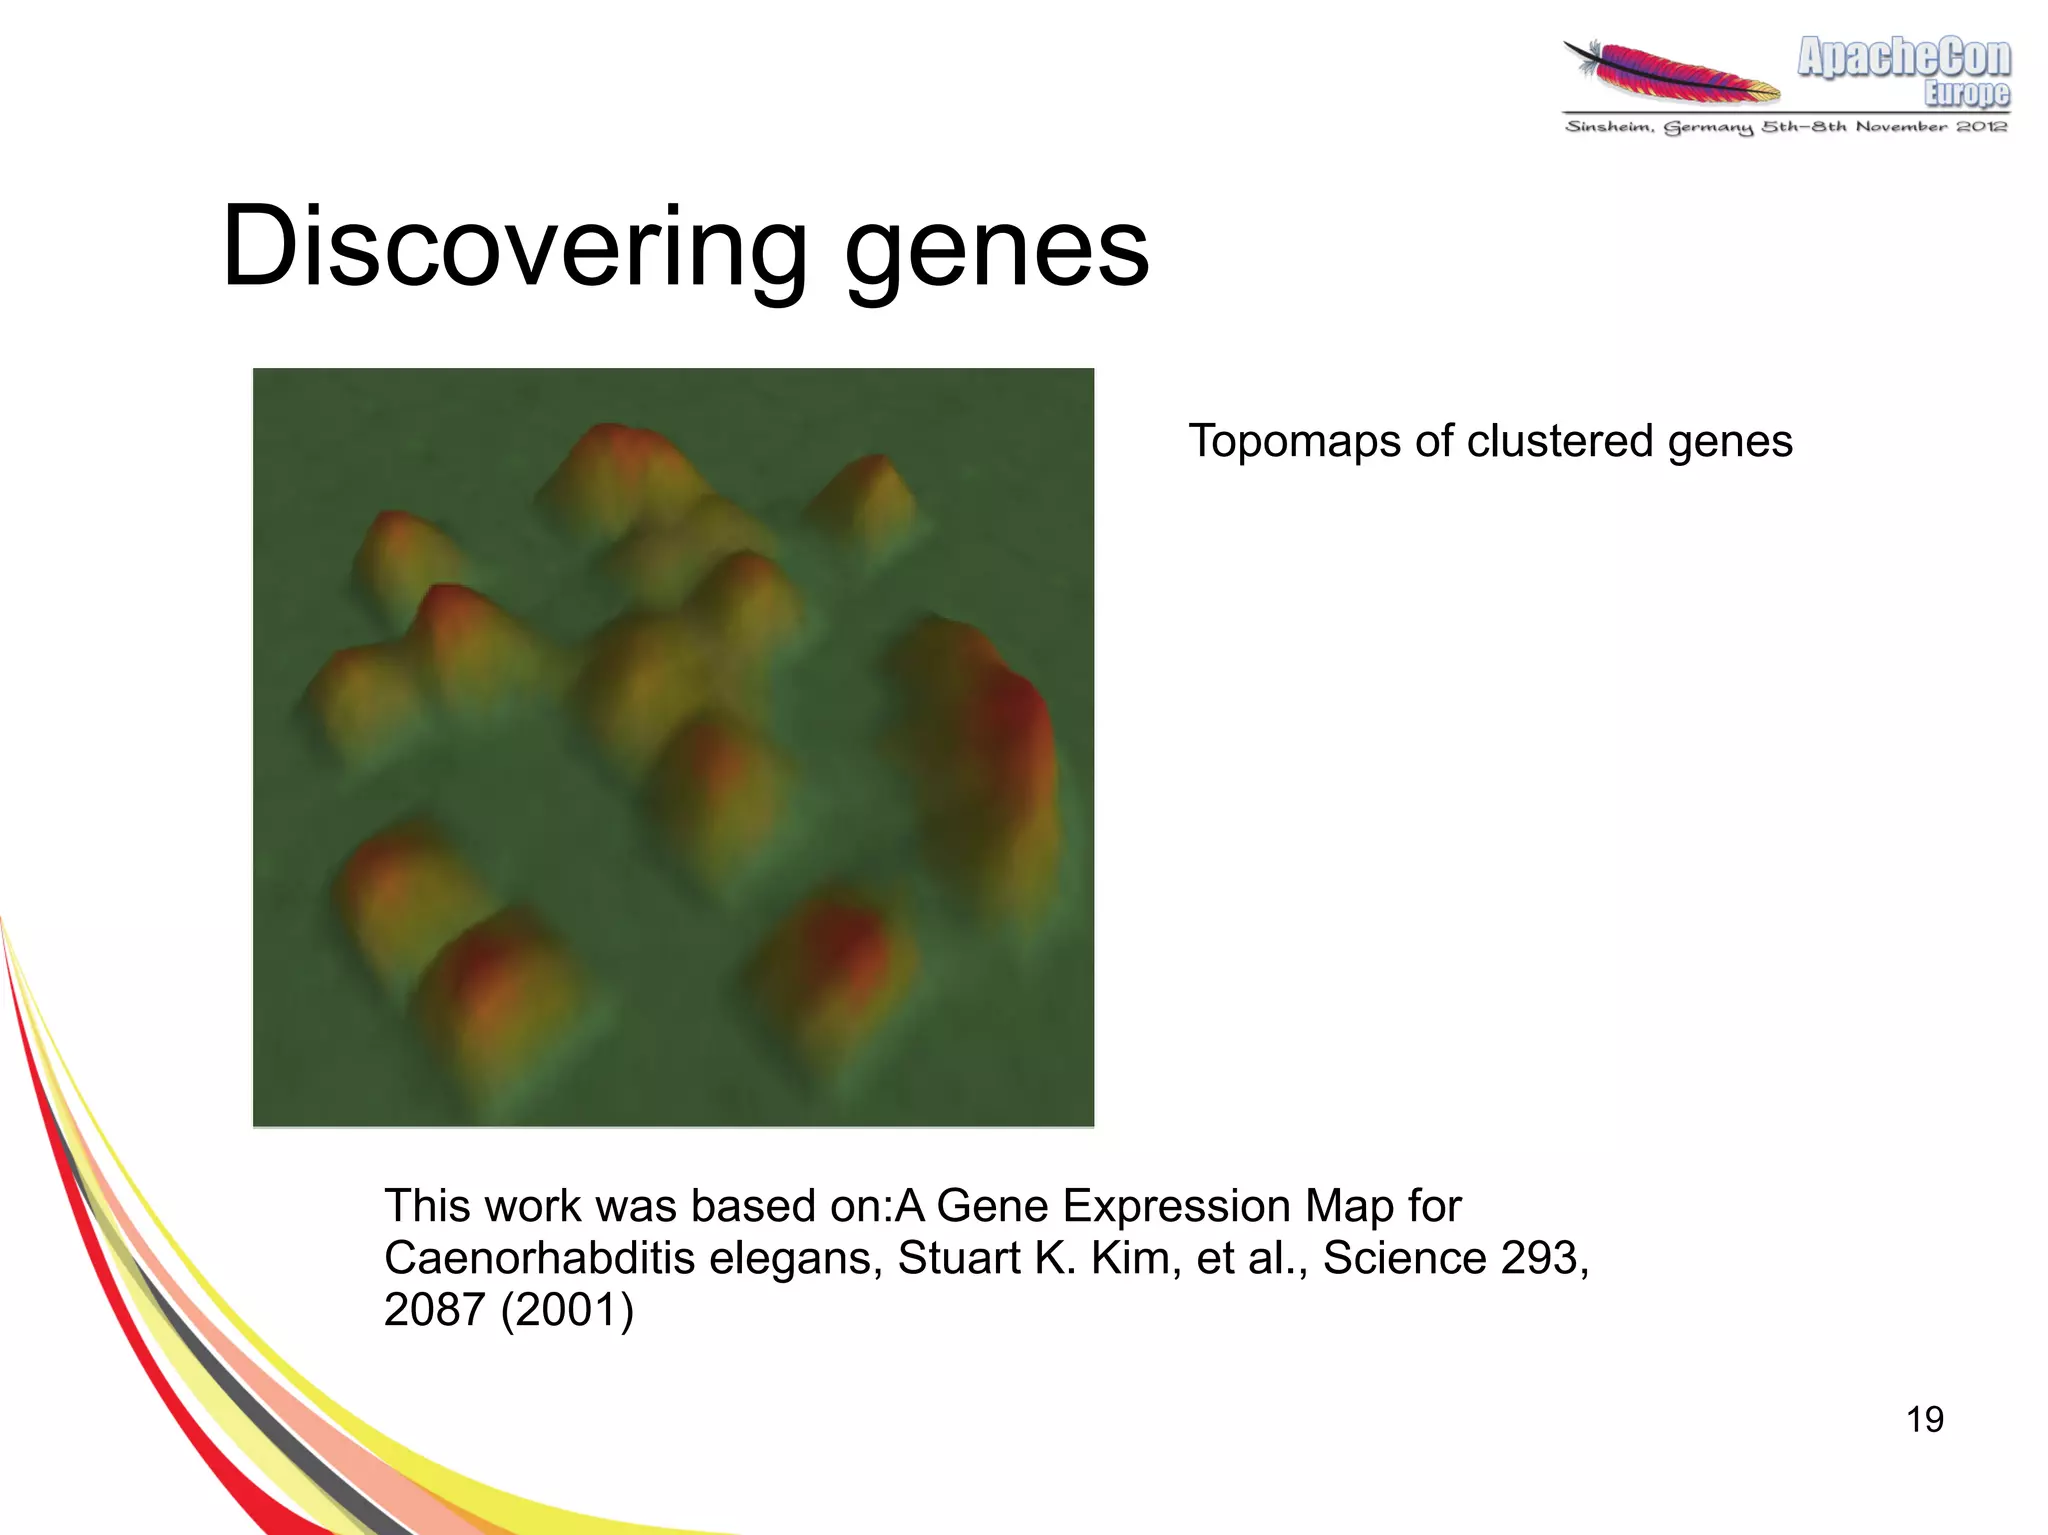
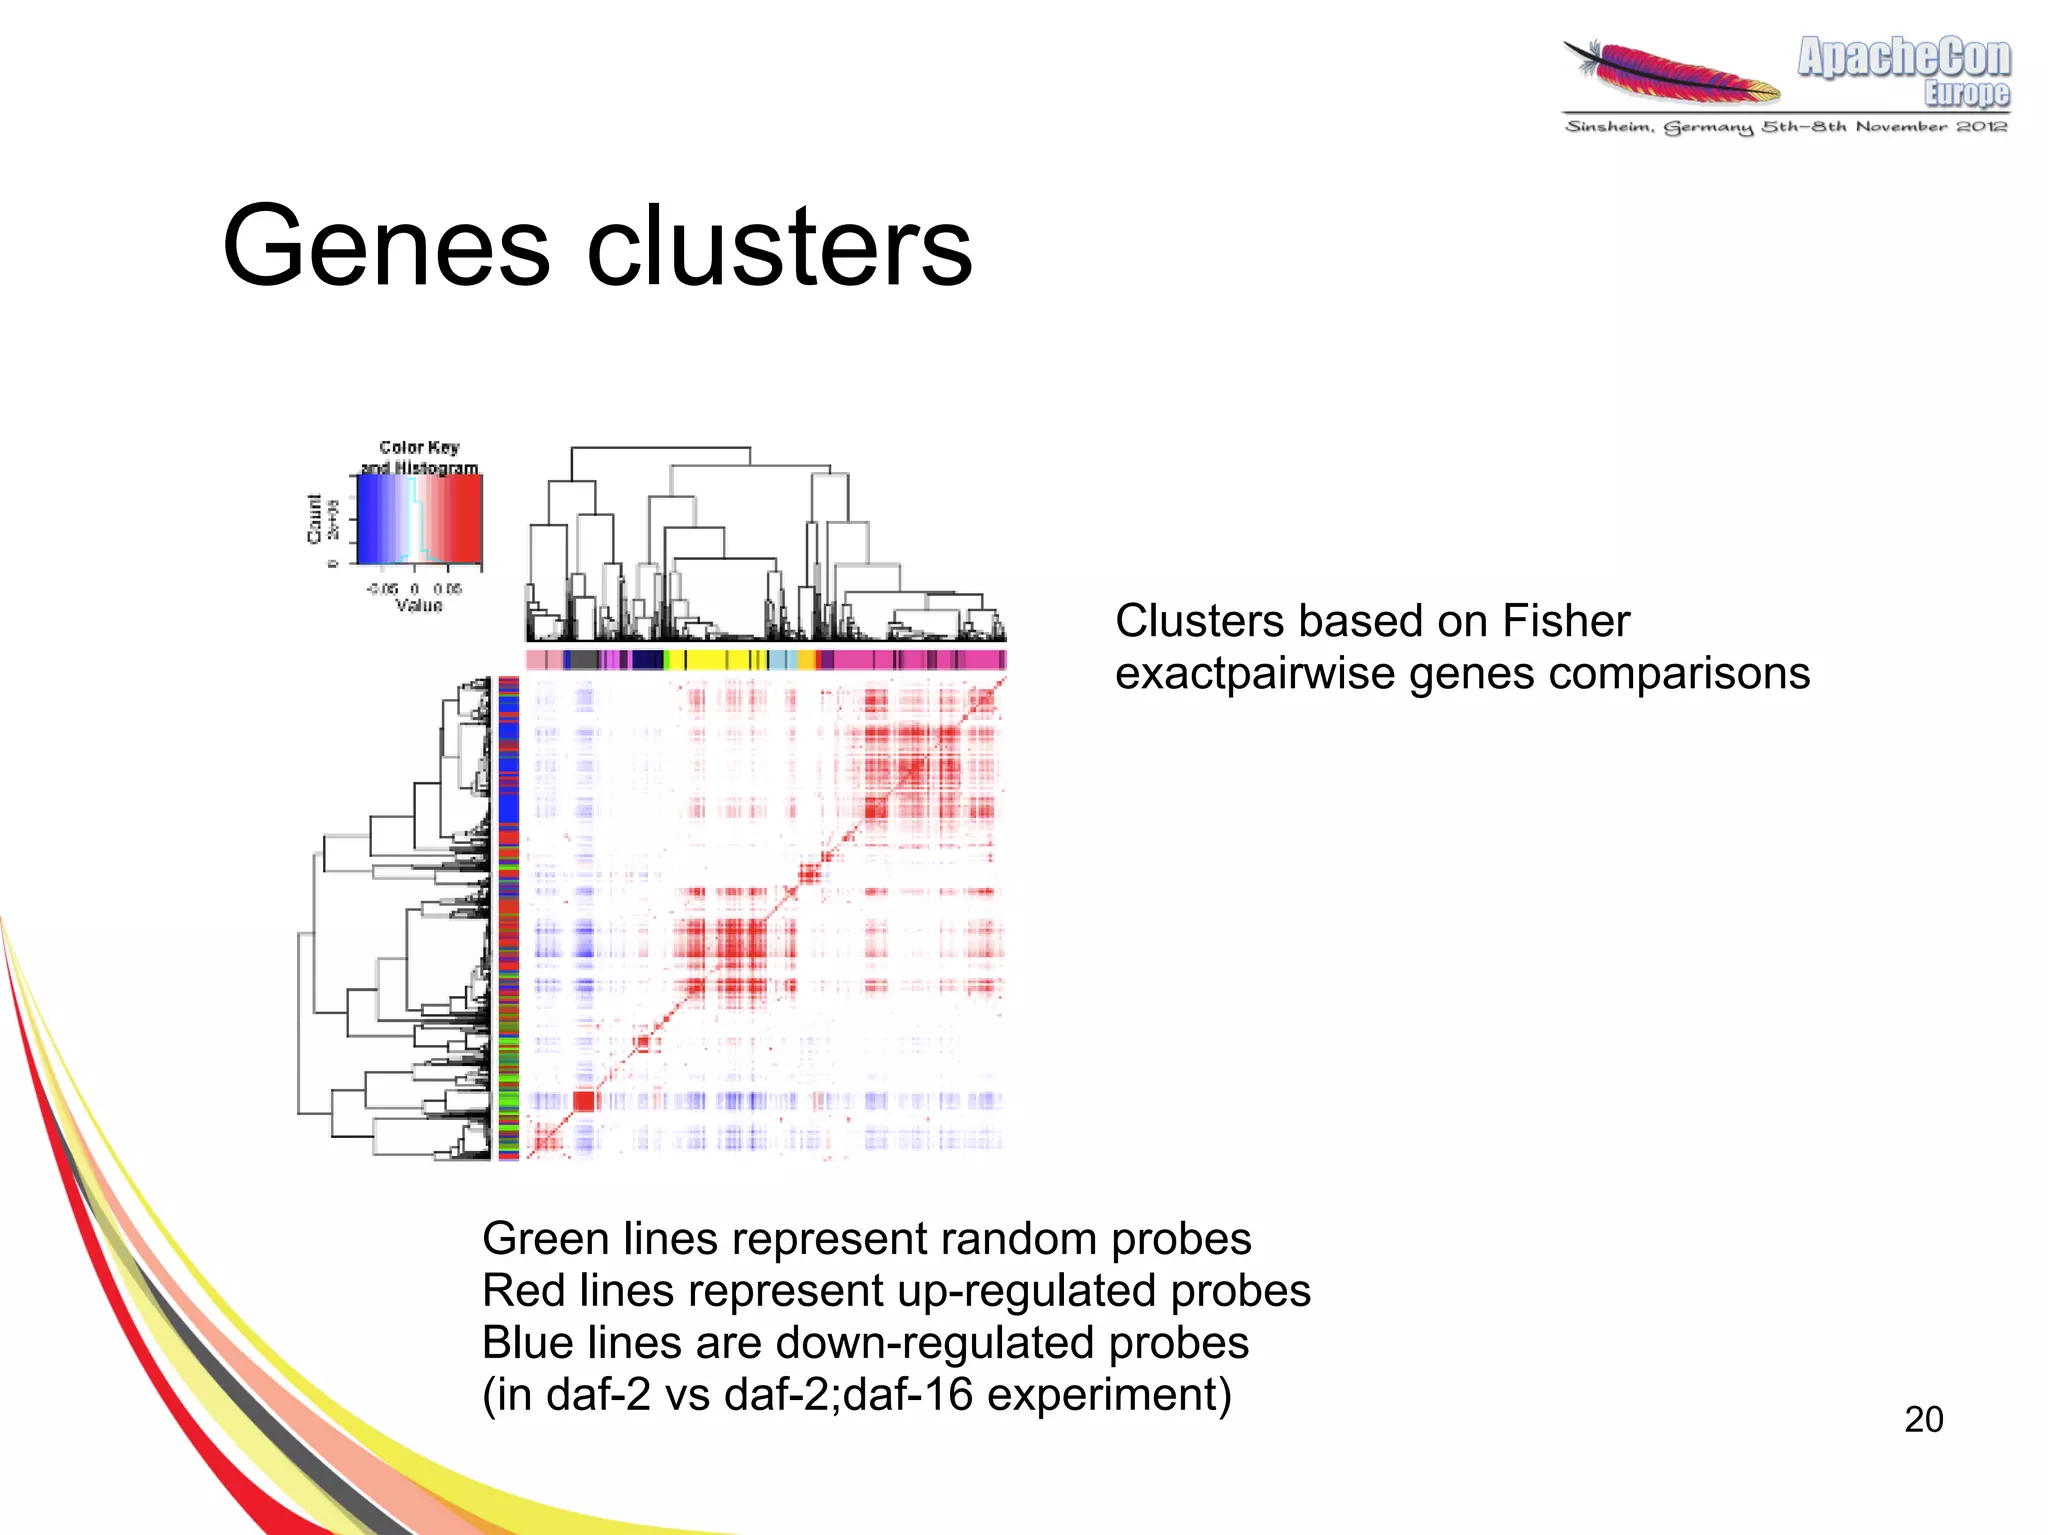
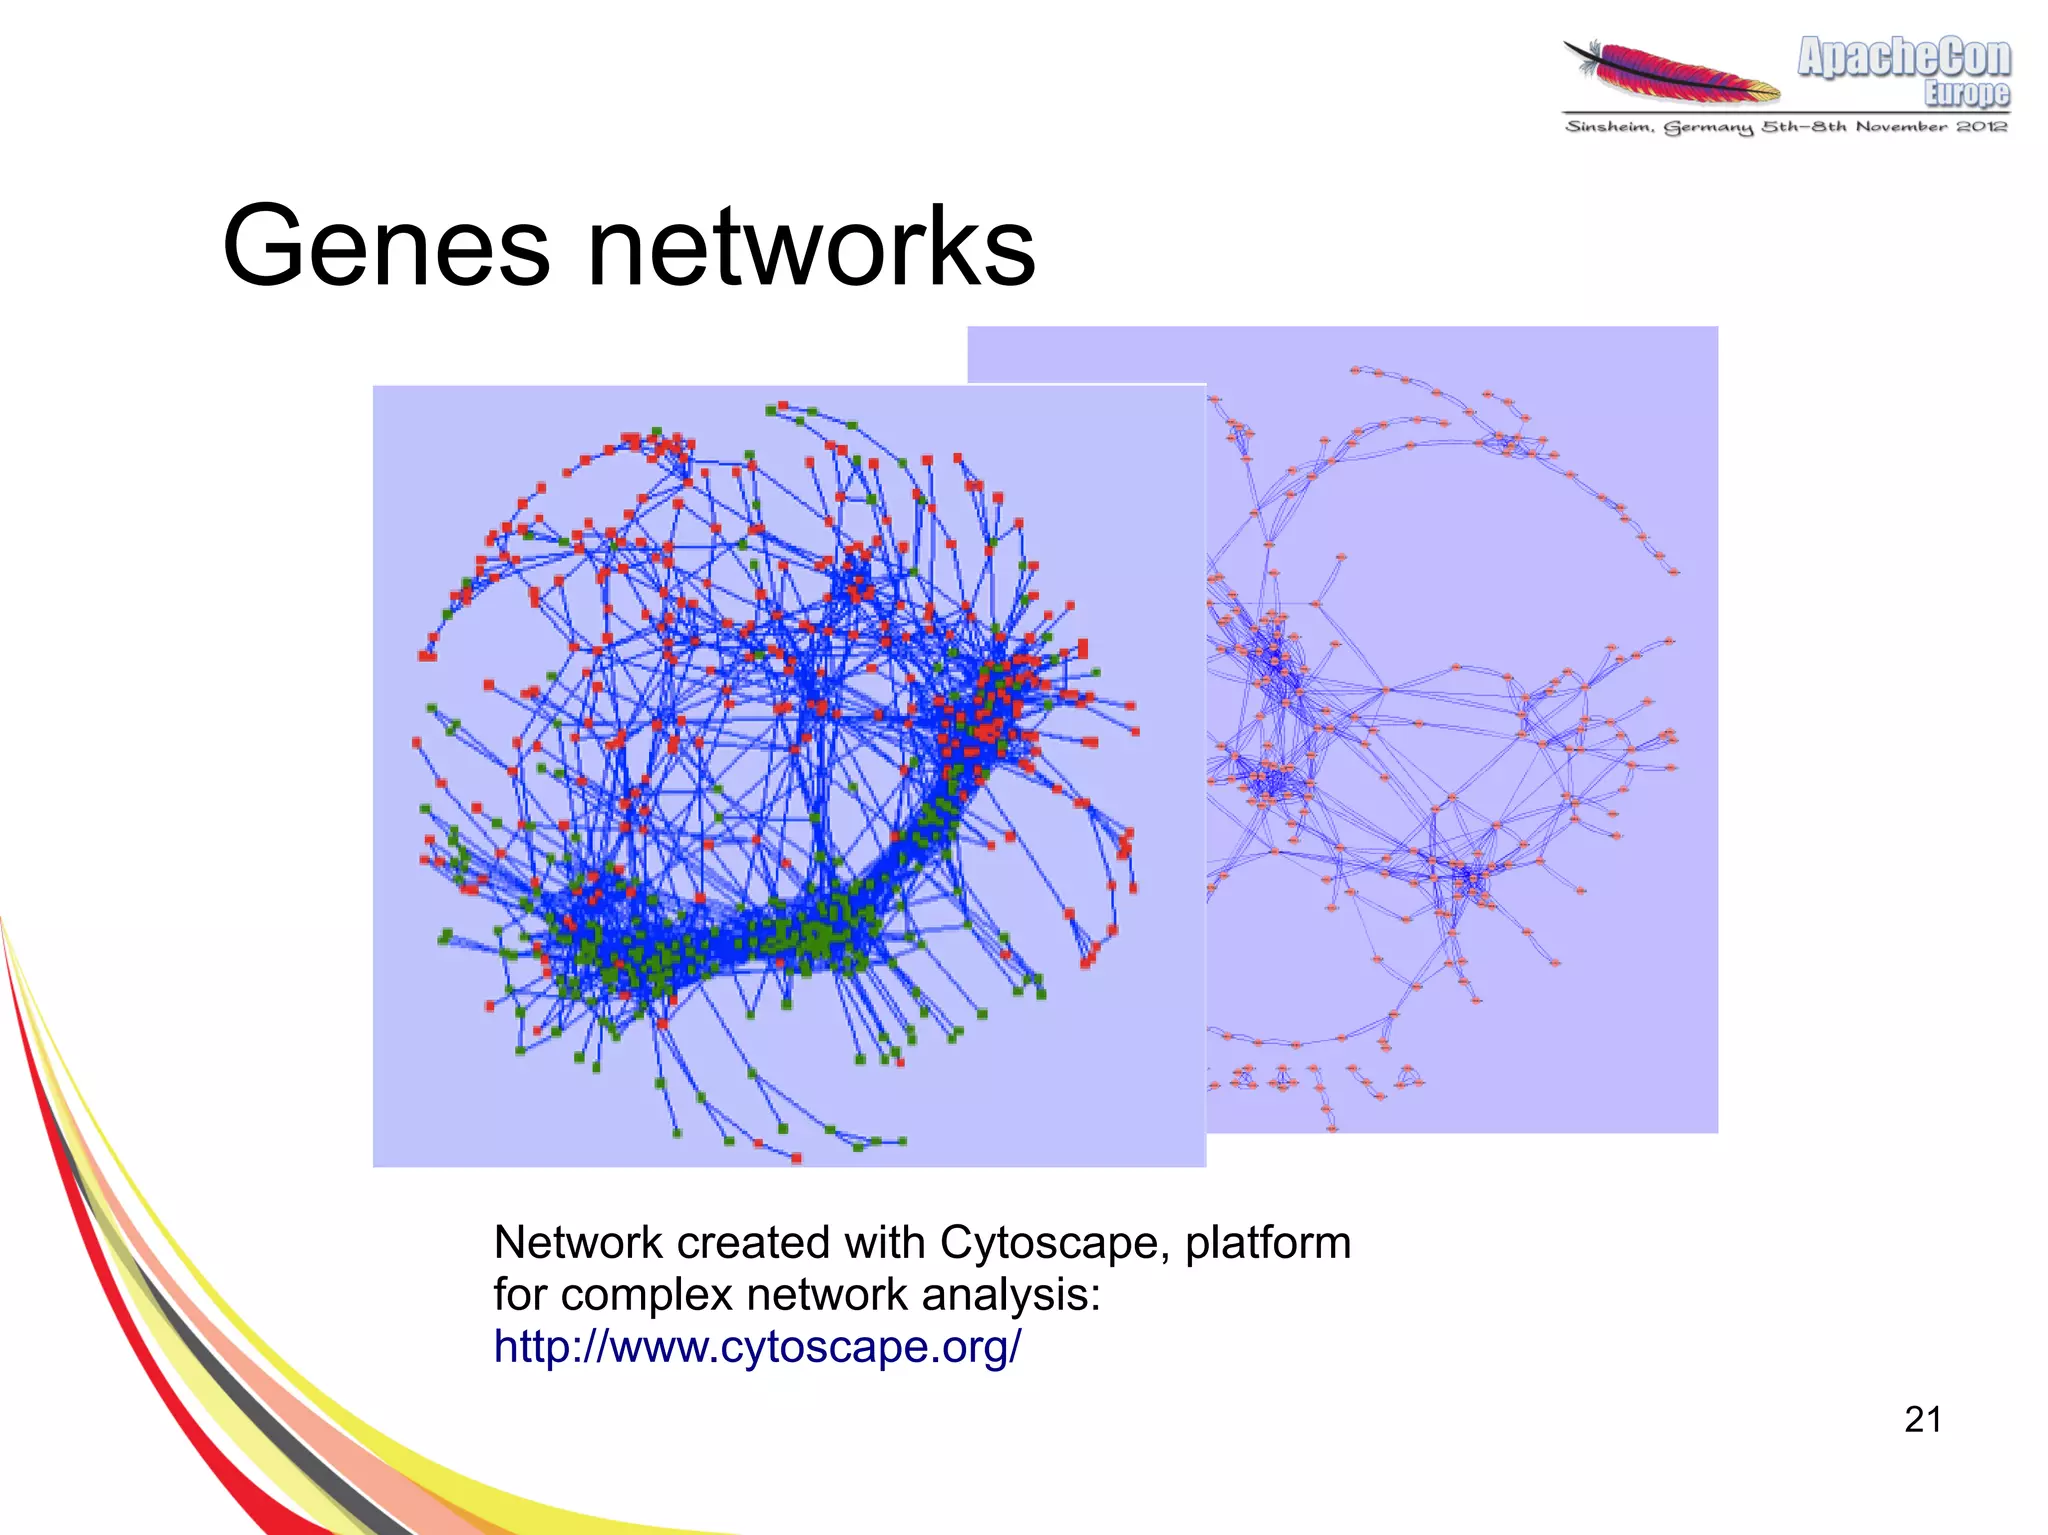
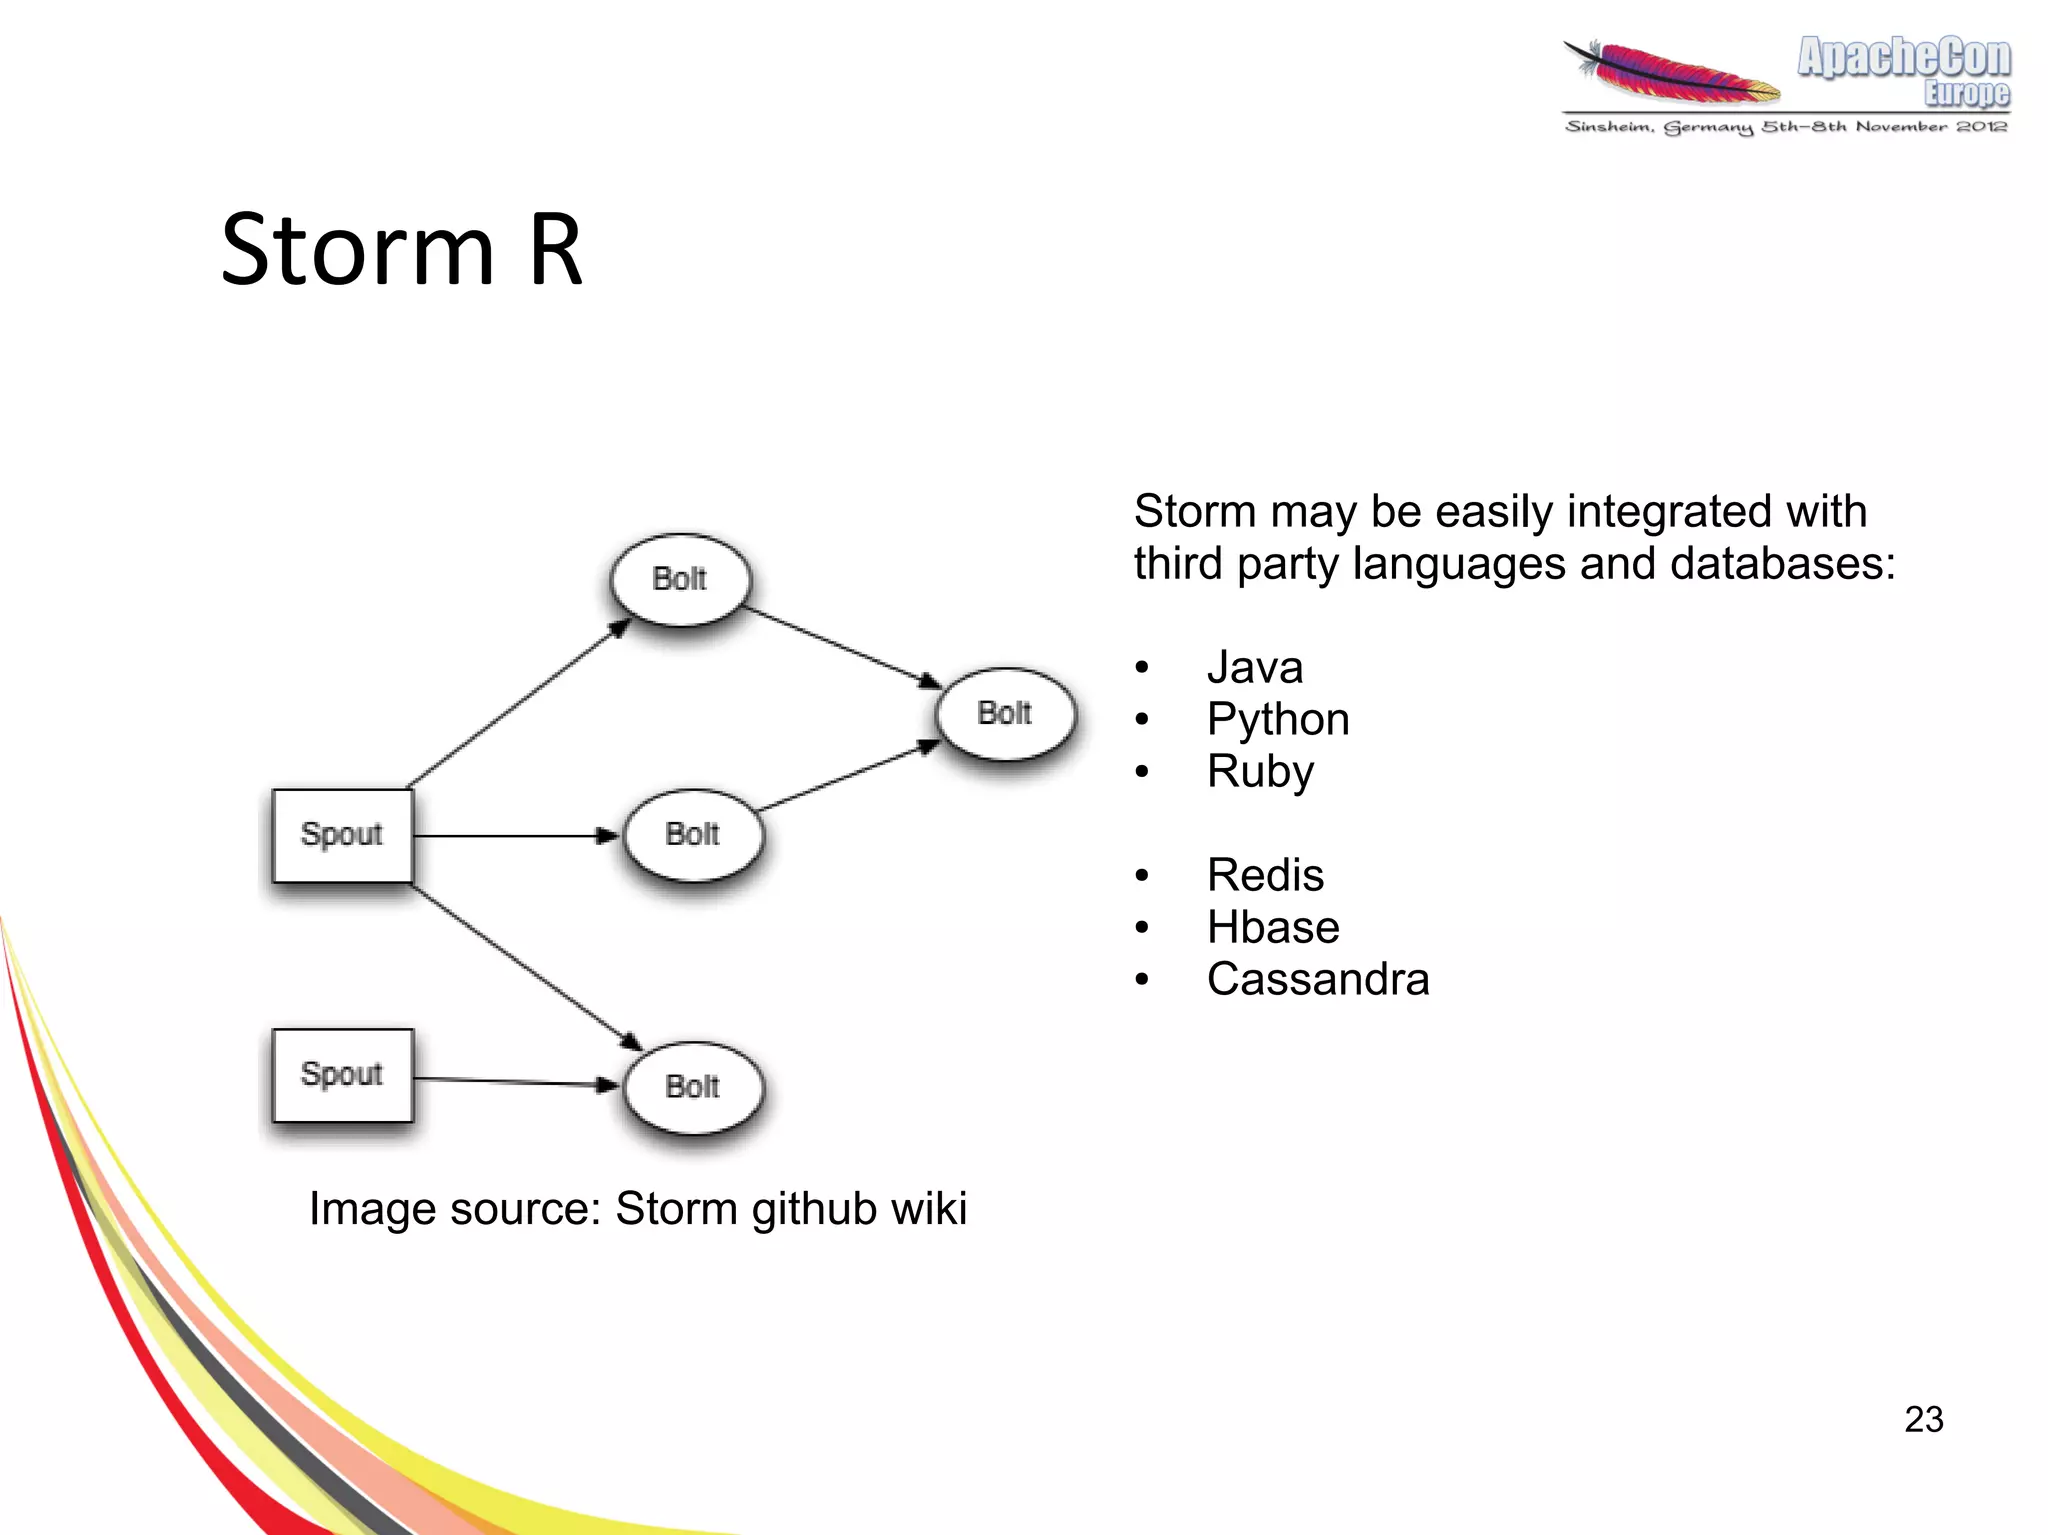

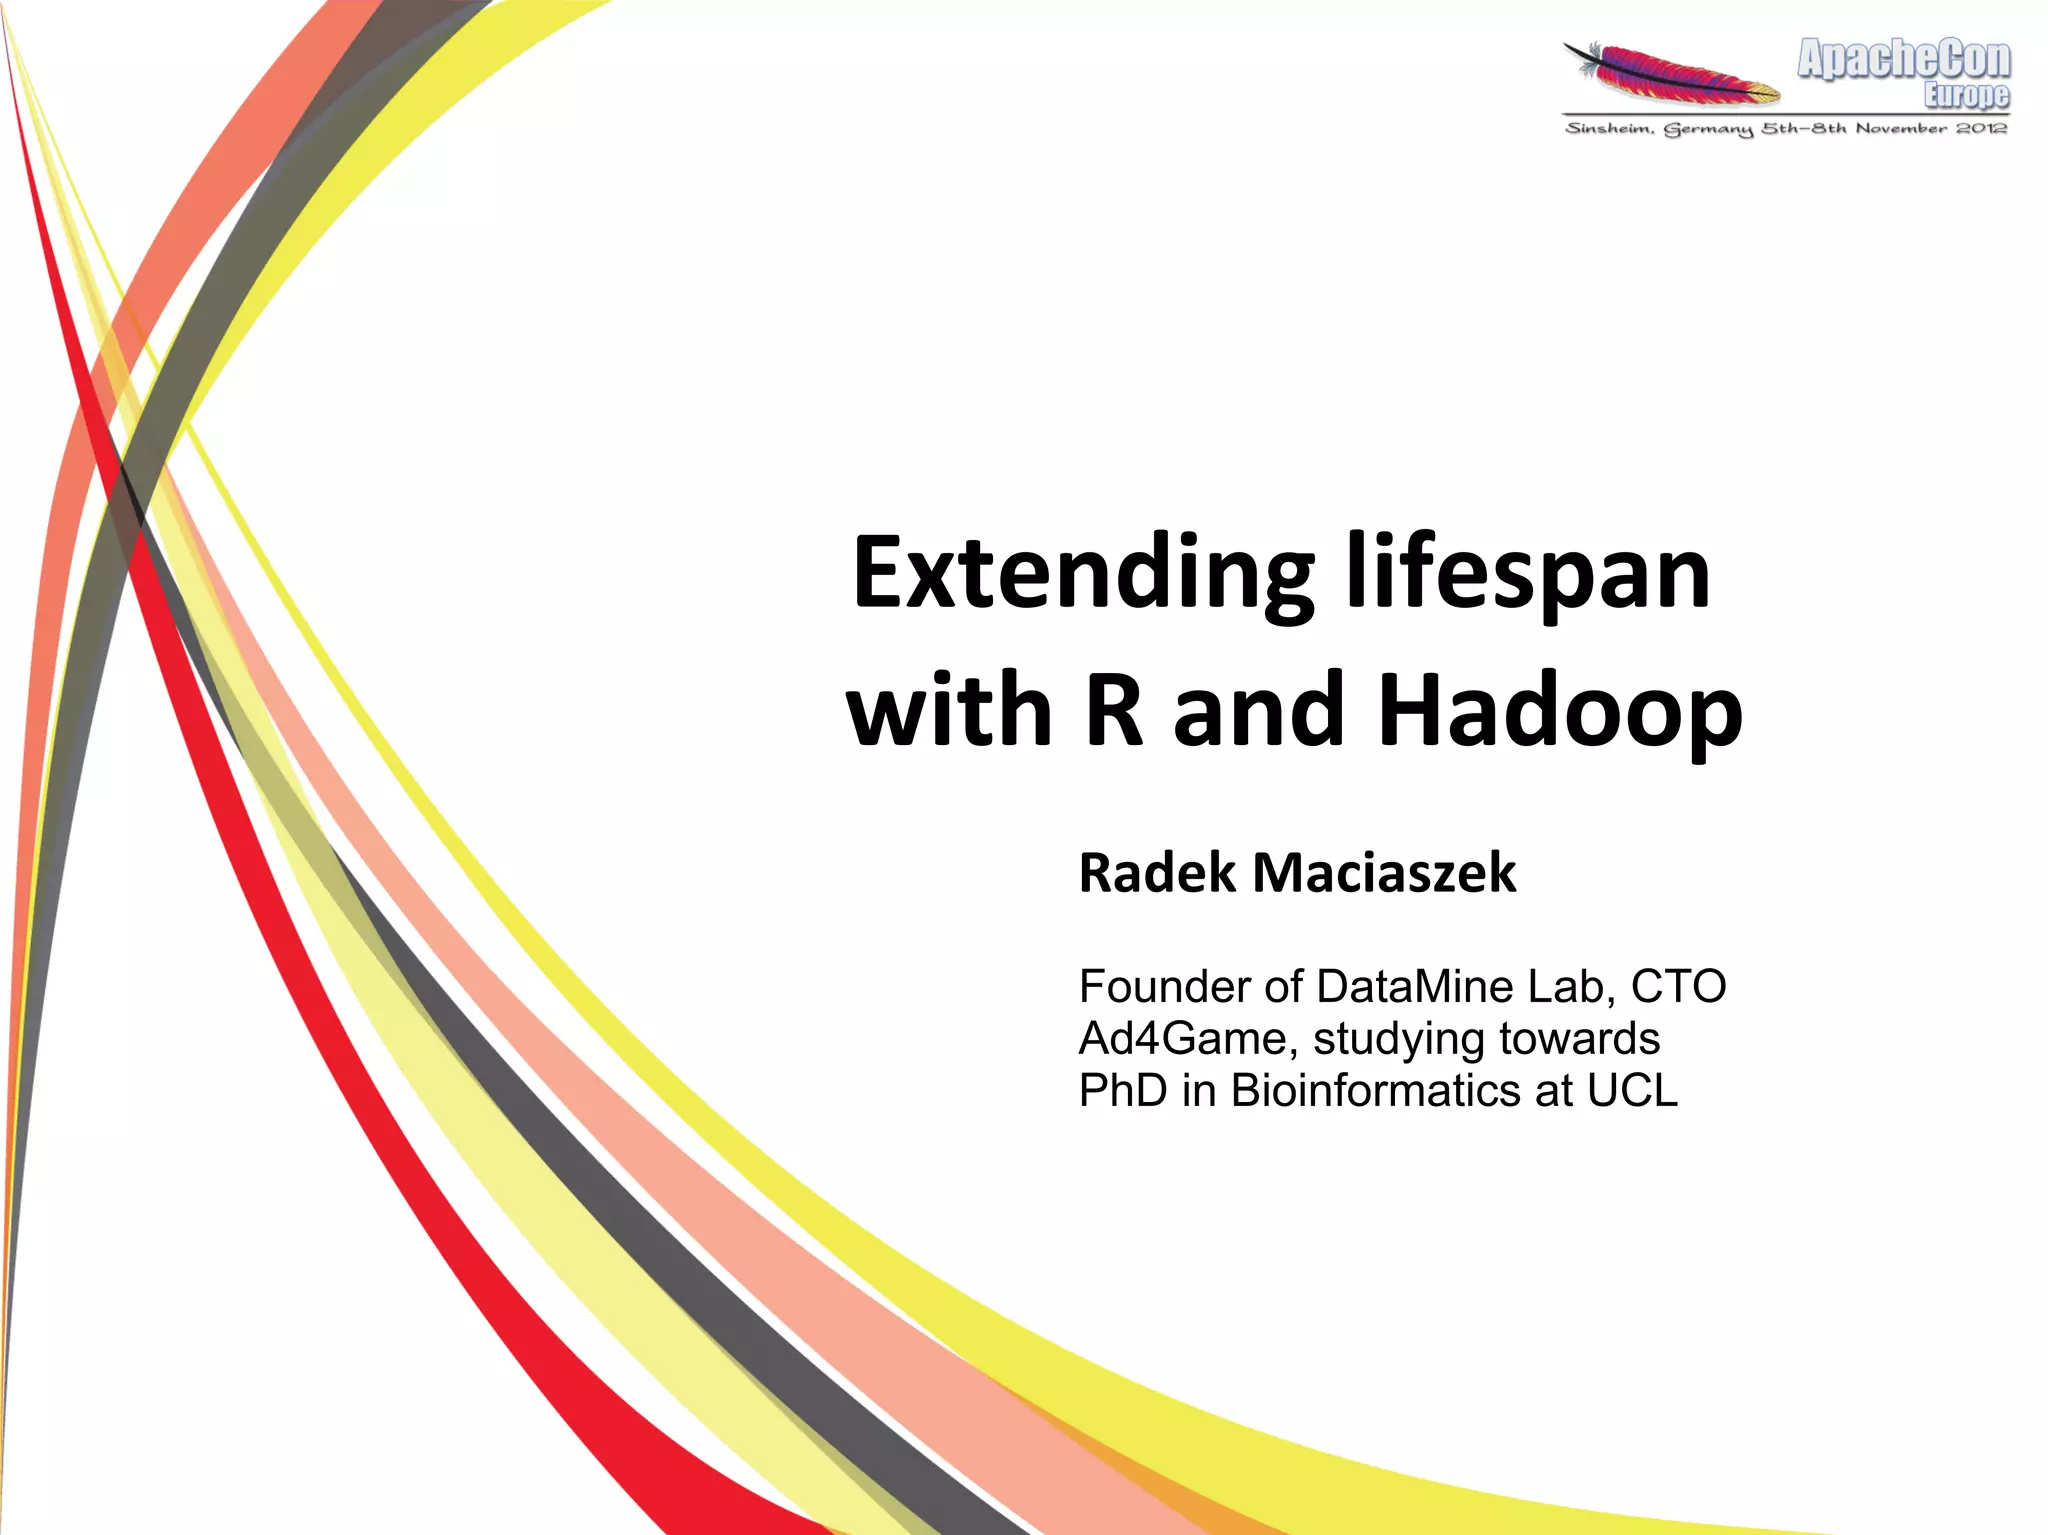
The document discusses a project on lifespan extension utilizing R and Hadoop for bioinformatics research at UCL. It highlights the use of R for data science in gene analysis, the challenges of scalability, and the integration of Hadoop for handling large datasets. The future scope includes exploring real-time processing with Storm to enhance computational efficiency.


![[DSC 2016] 系列活動:李泳泉 / 星火燎原 - Spark 機器學習初探](https://cdn.slidesharecdn.com/ss_thumbnails/sparkmllib-161026052038-thumbnail.jpg?width=640&height=640&fit=bounds)