


![Other Entry Routes
– Basic Customs Duty (BCD): This duty is levied either as 1) a specific rate based on the unit of
the item (weight, number, etc.), or more commonly, 2) ad-volorem, based on the assessable
value of the item. In some cases, a combination of the two is used.
– Additional Customs Duty (ACD): This duty is typically referred to as Countervailing duty or
(CVD) and is levied on the assessed value of goods plus BCD. It is payable only if the imported
product is such as if produce in India it would be liable for an excise duty.
– Special Additional Customs Duty (known as Special CVD): Special CVD tax is applicable on
all items (to offset the disadvantage to like Indian goods due to high excise duty on their input). It
is levied at the rate of 4 percent of the BCD and the ACD on all imports.
– [Anti-dumping Duty: This is levied on specified goods imported from specified countries,
including the United States, to protect indigenous industry from injury.
– Safeguard Duty: The Indian government may by notification impose a safeguard duty on
articles after concluding that increased imported quantities and under current conditions will
cause or threaten to cause serious injury to domestic industry.]
w w w . k e g l e r b r o w n . c o m](https://image.slidesharecdn.com/final-seminar-presentation-120223135523-phpapp01/75/Exporting-to-India-Strategies-for-Success-75-2048.jpg)


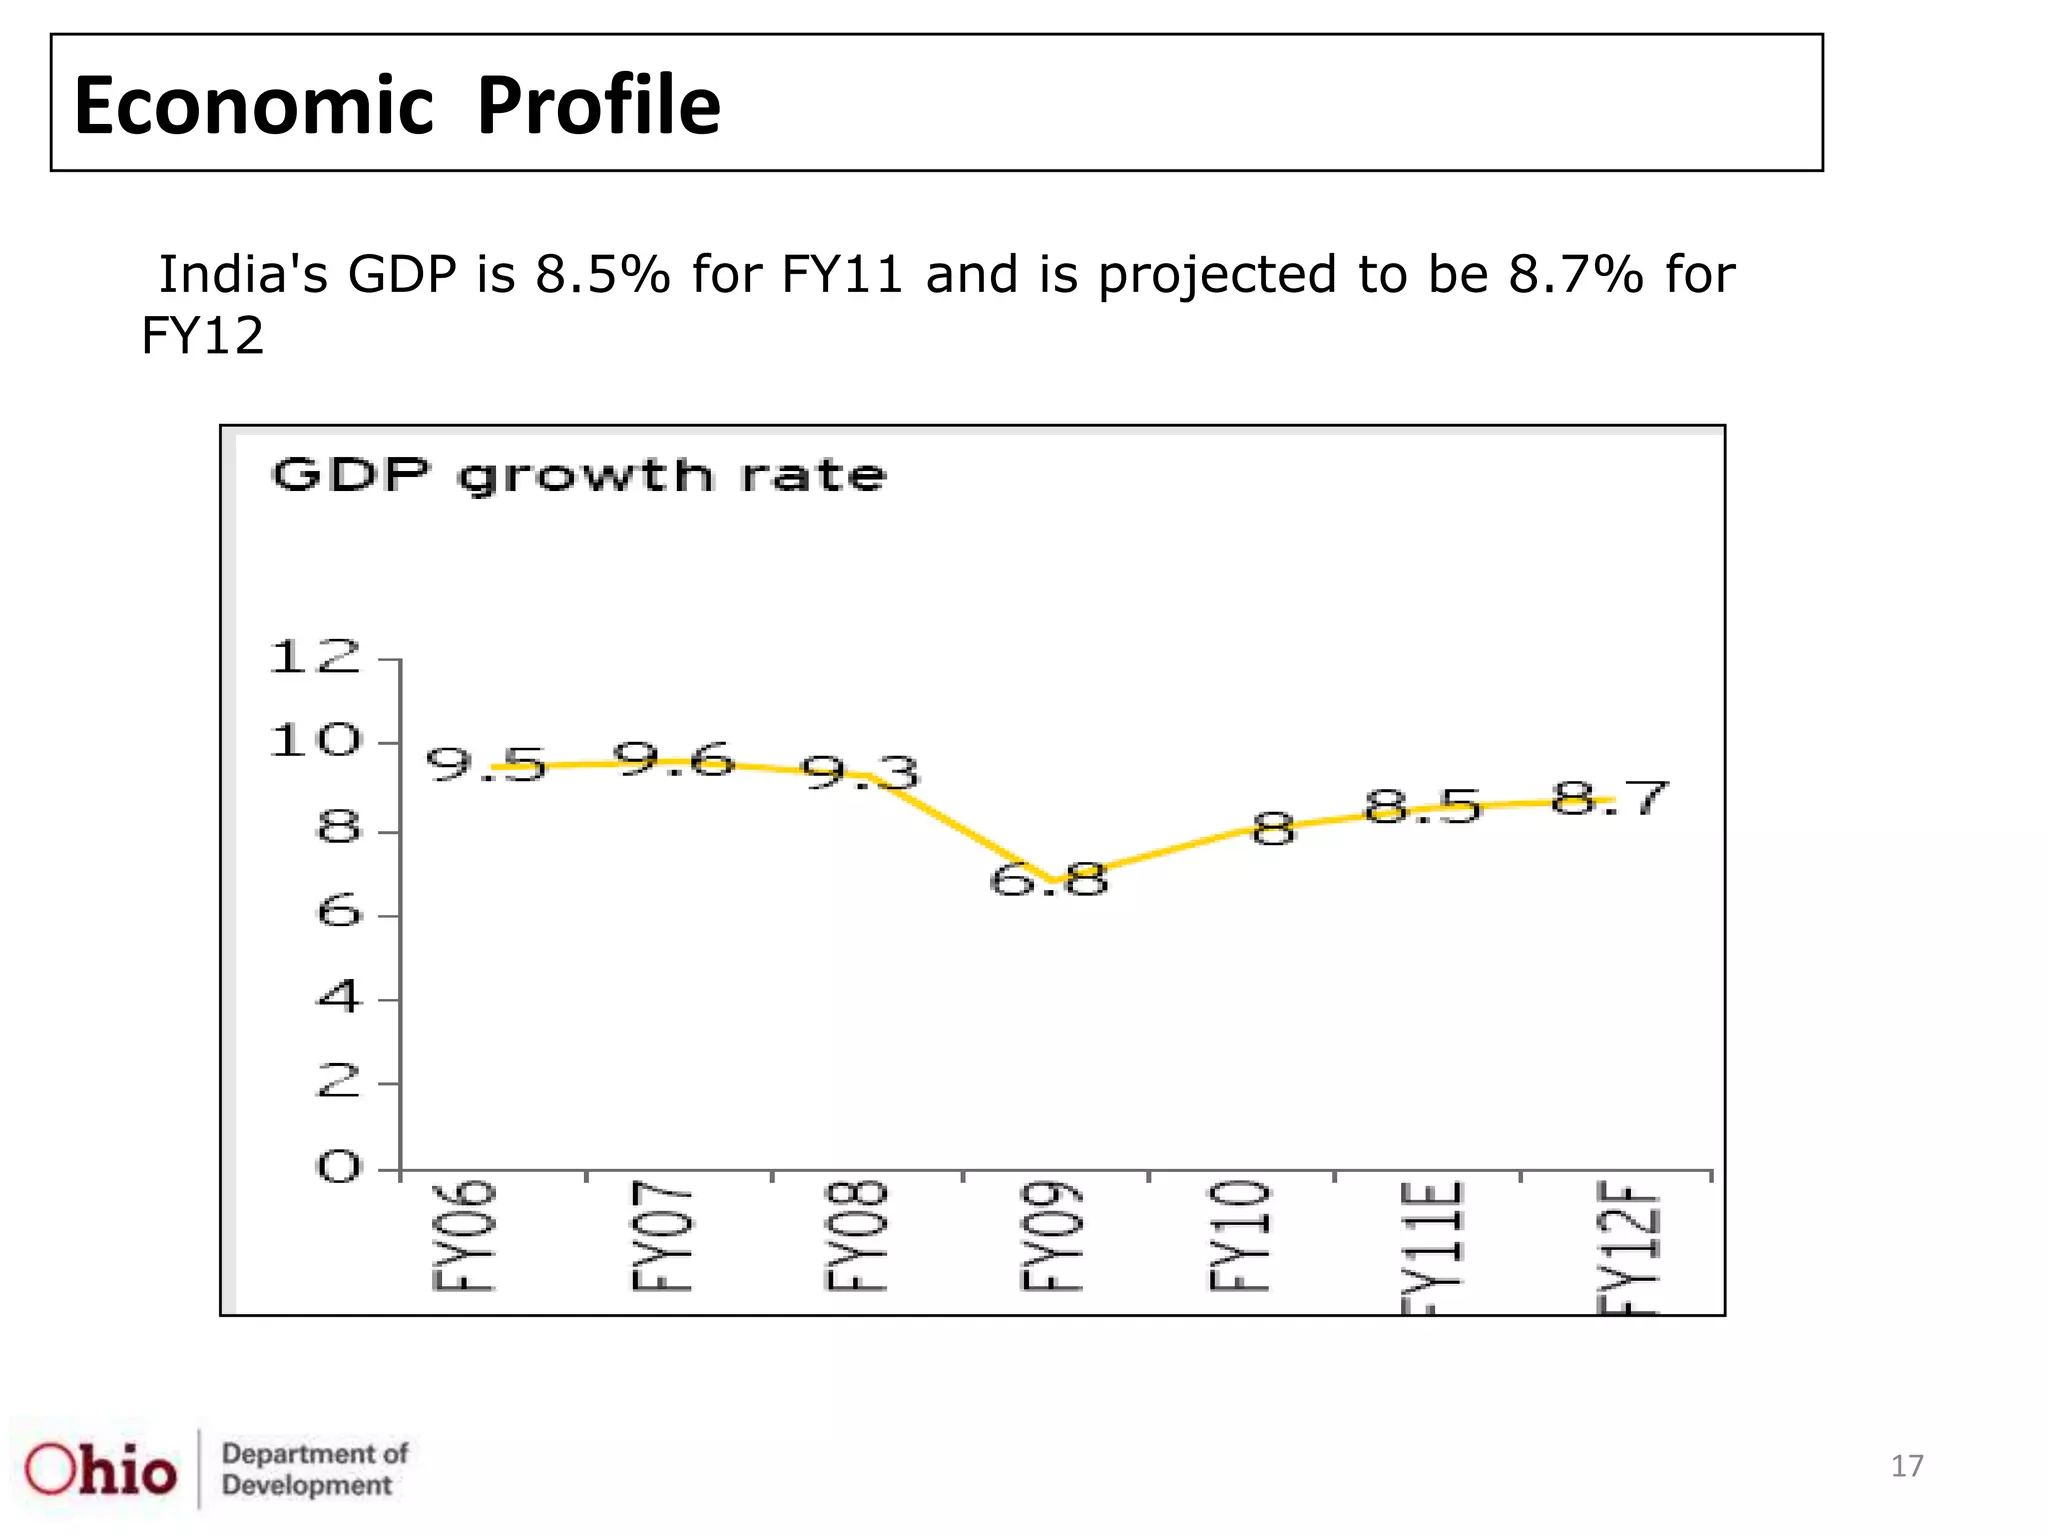
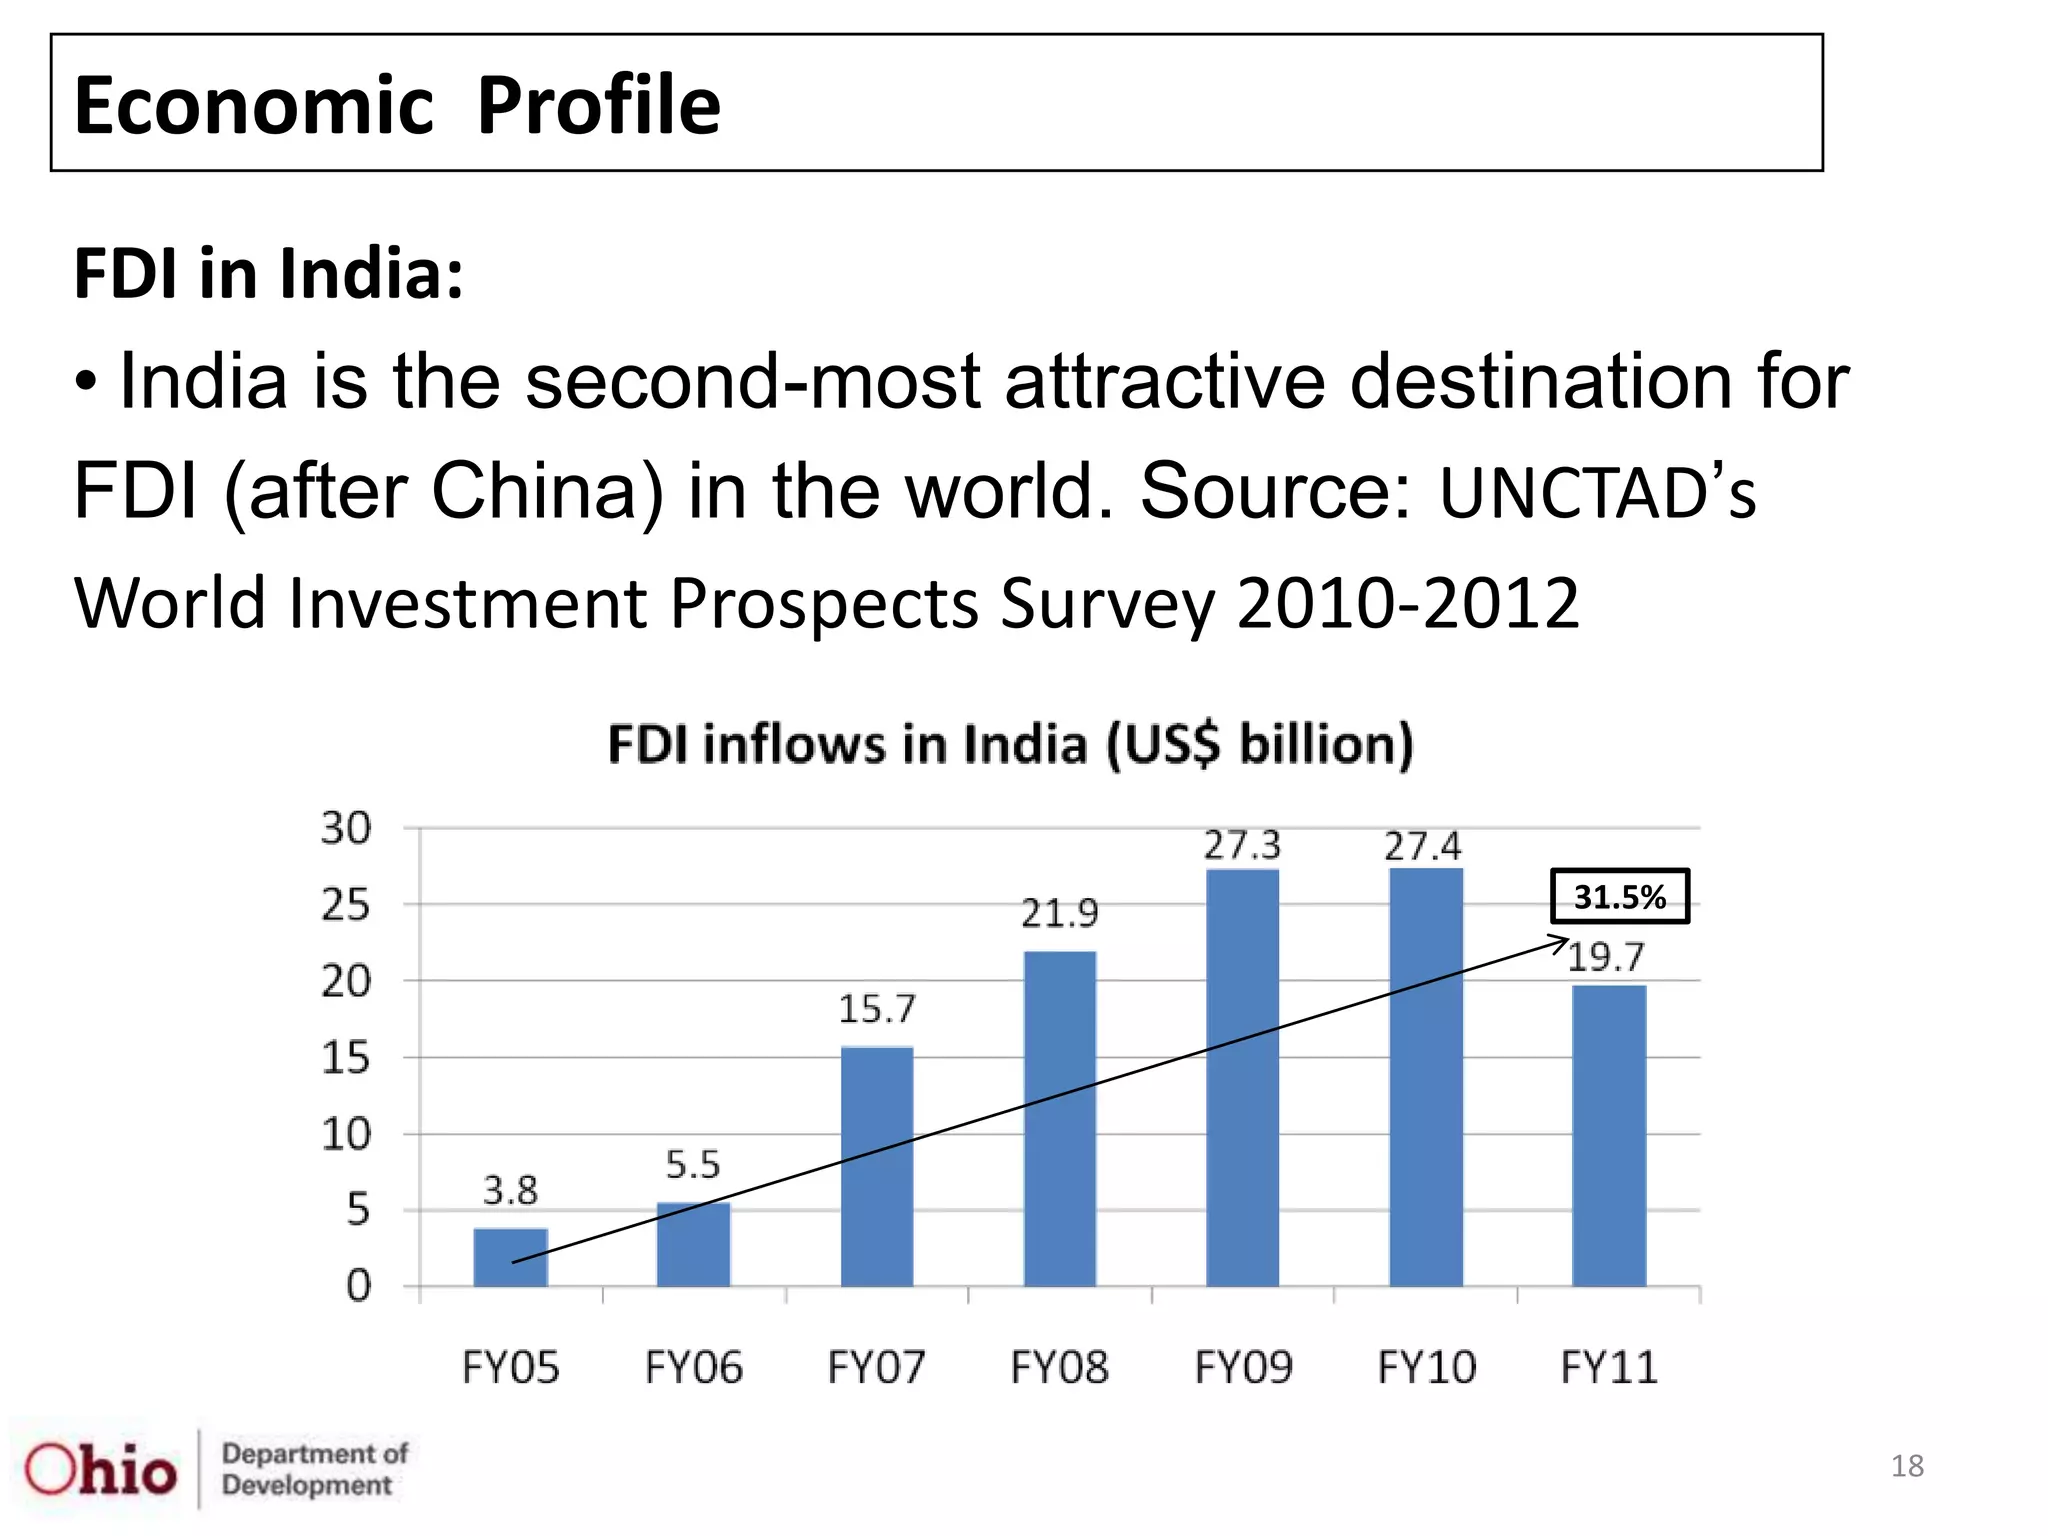
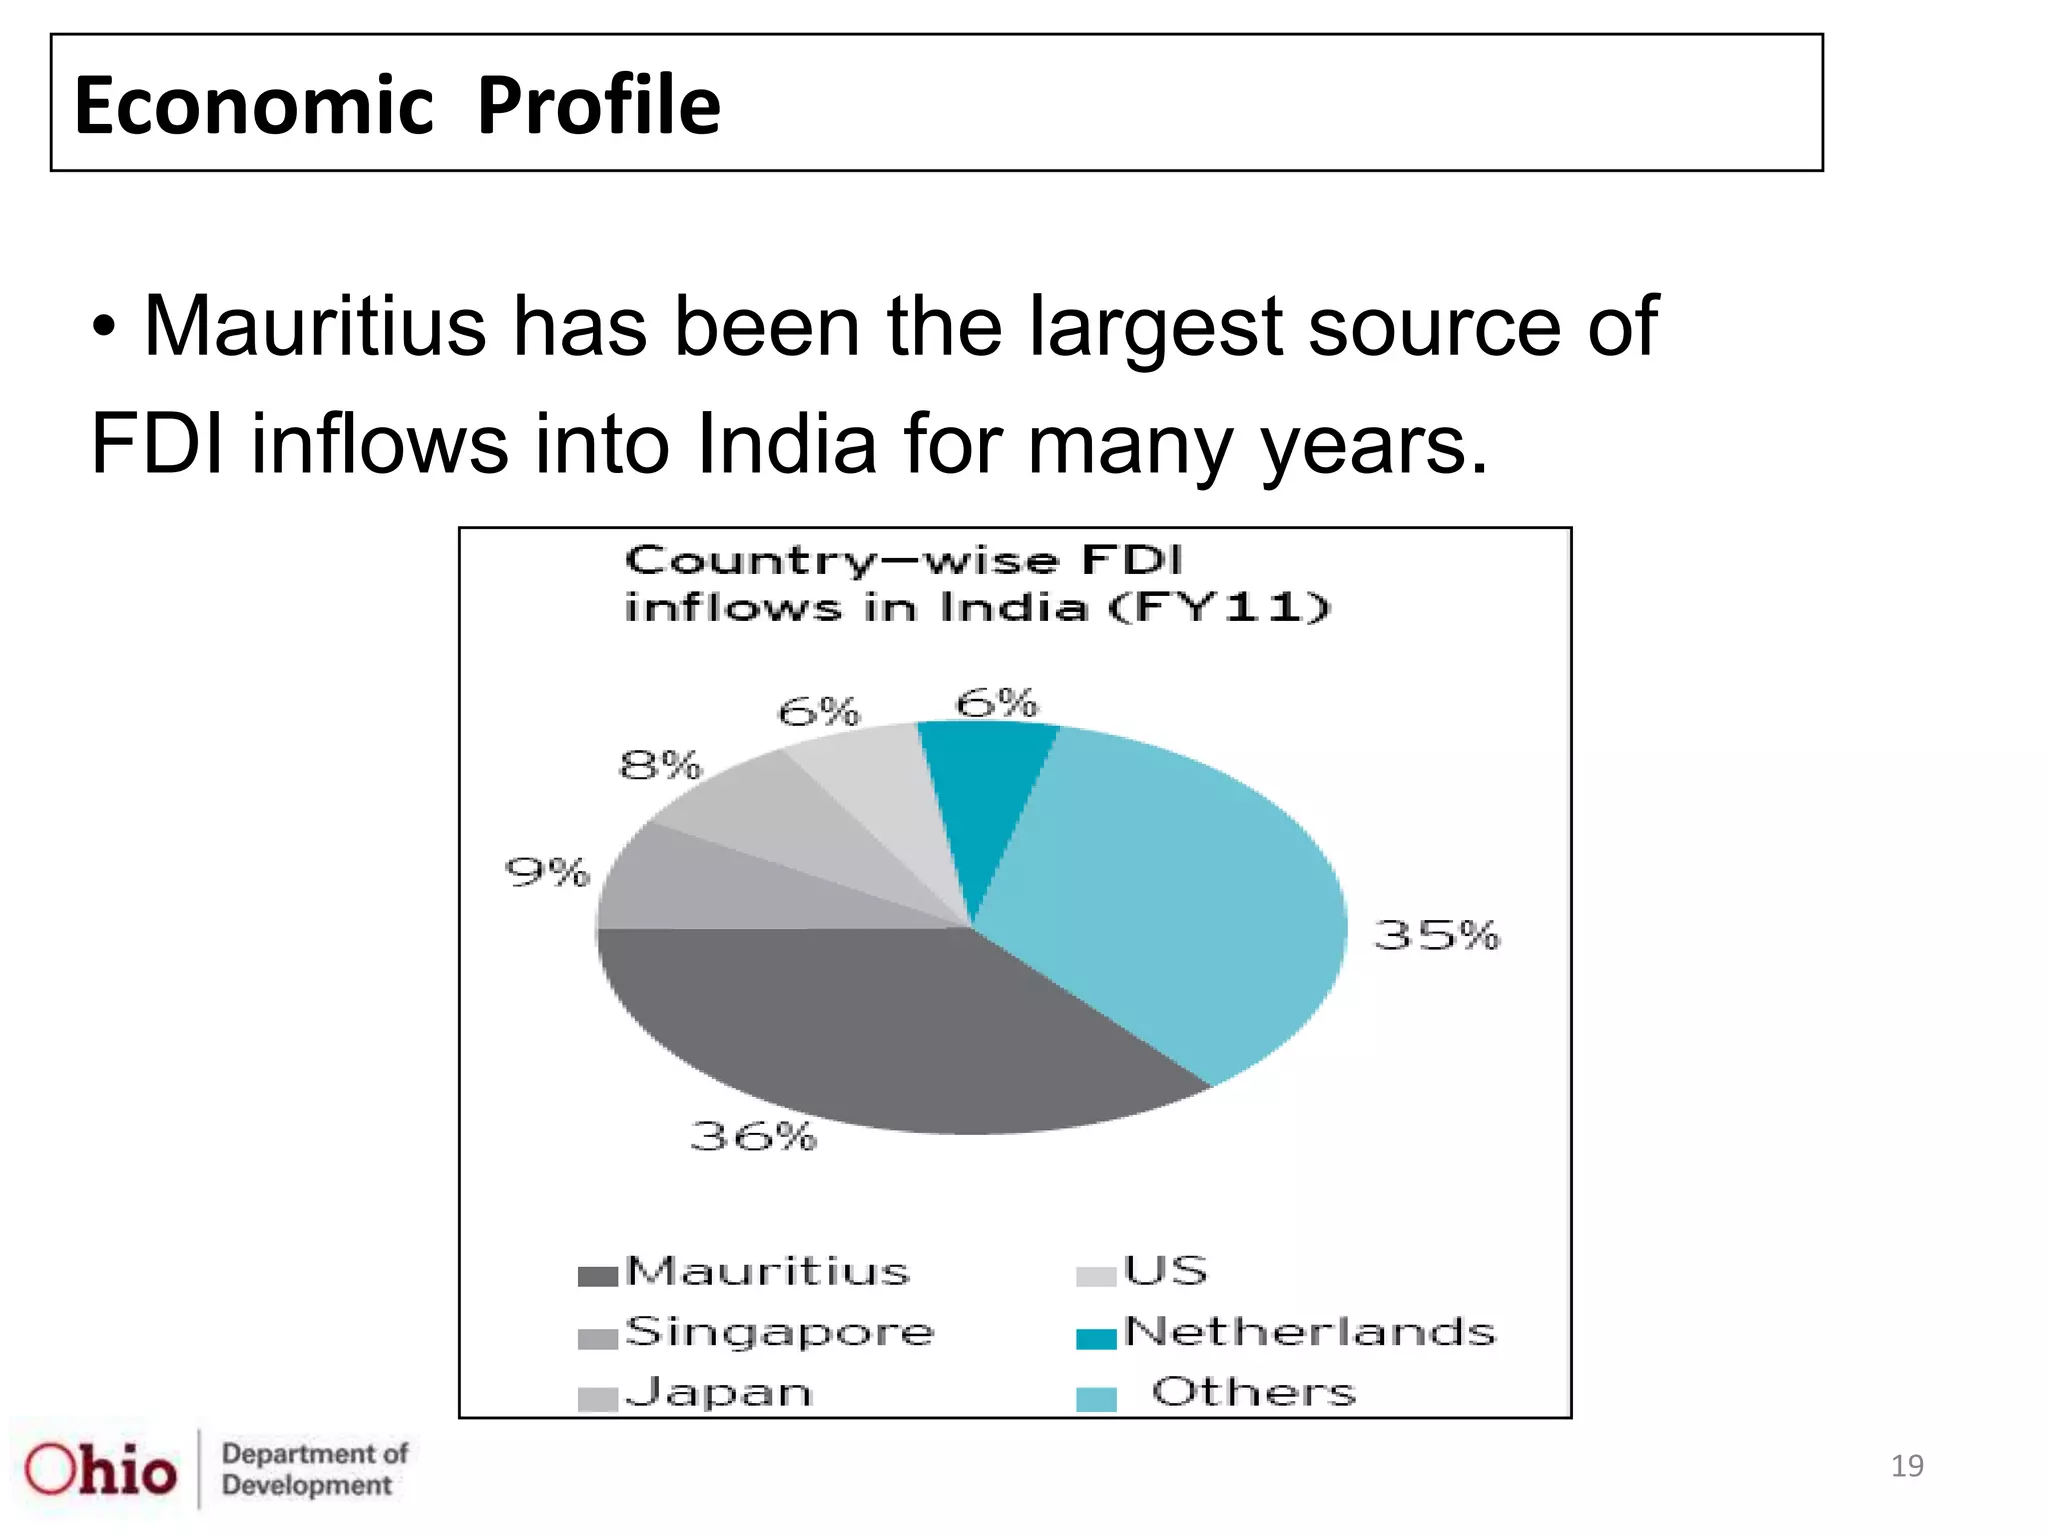
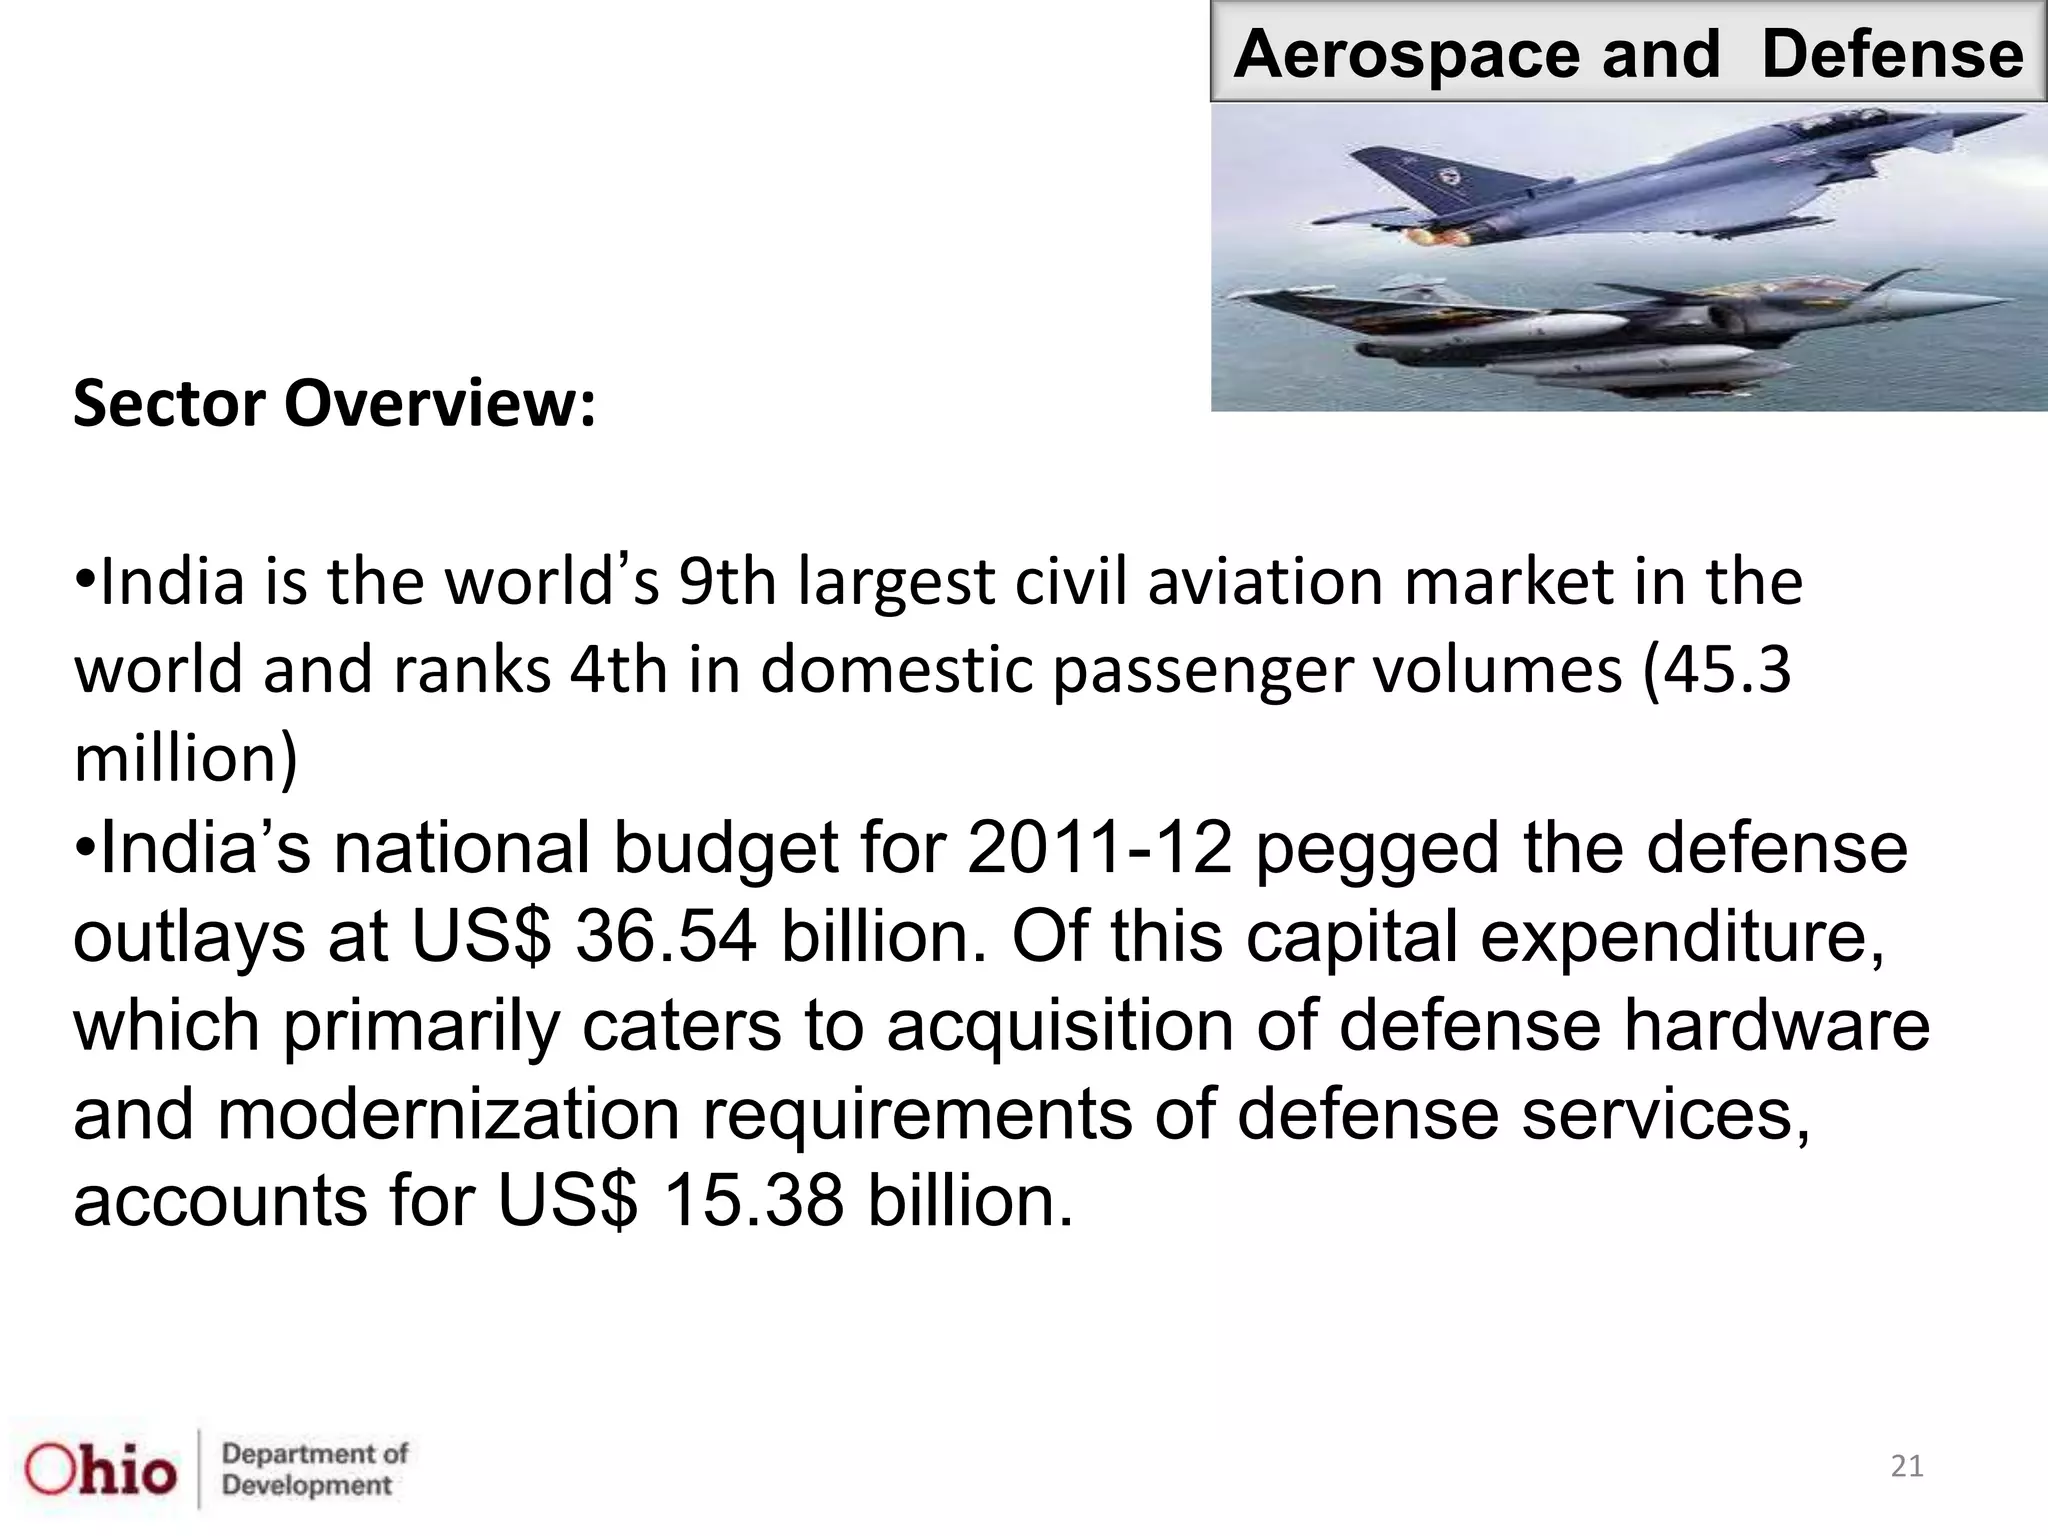
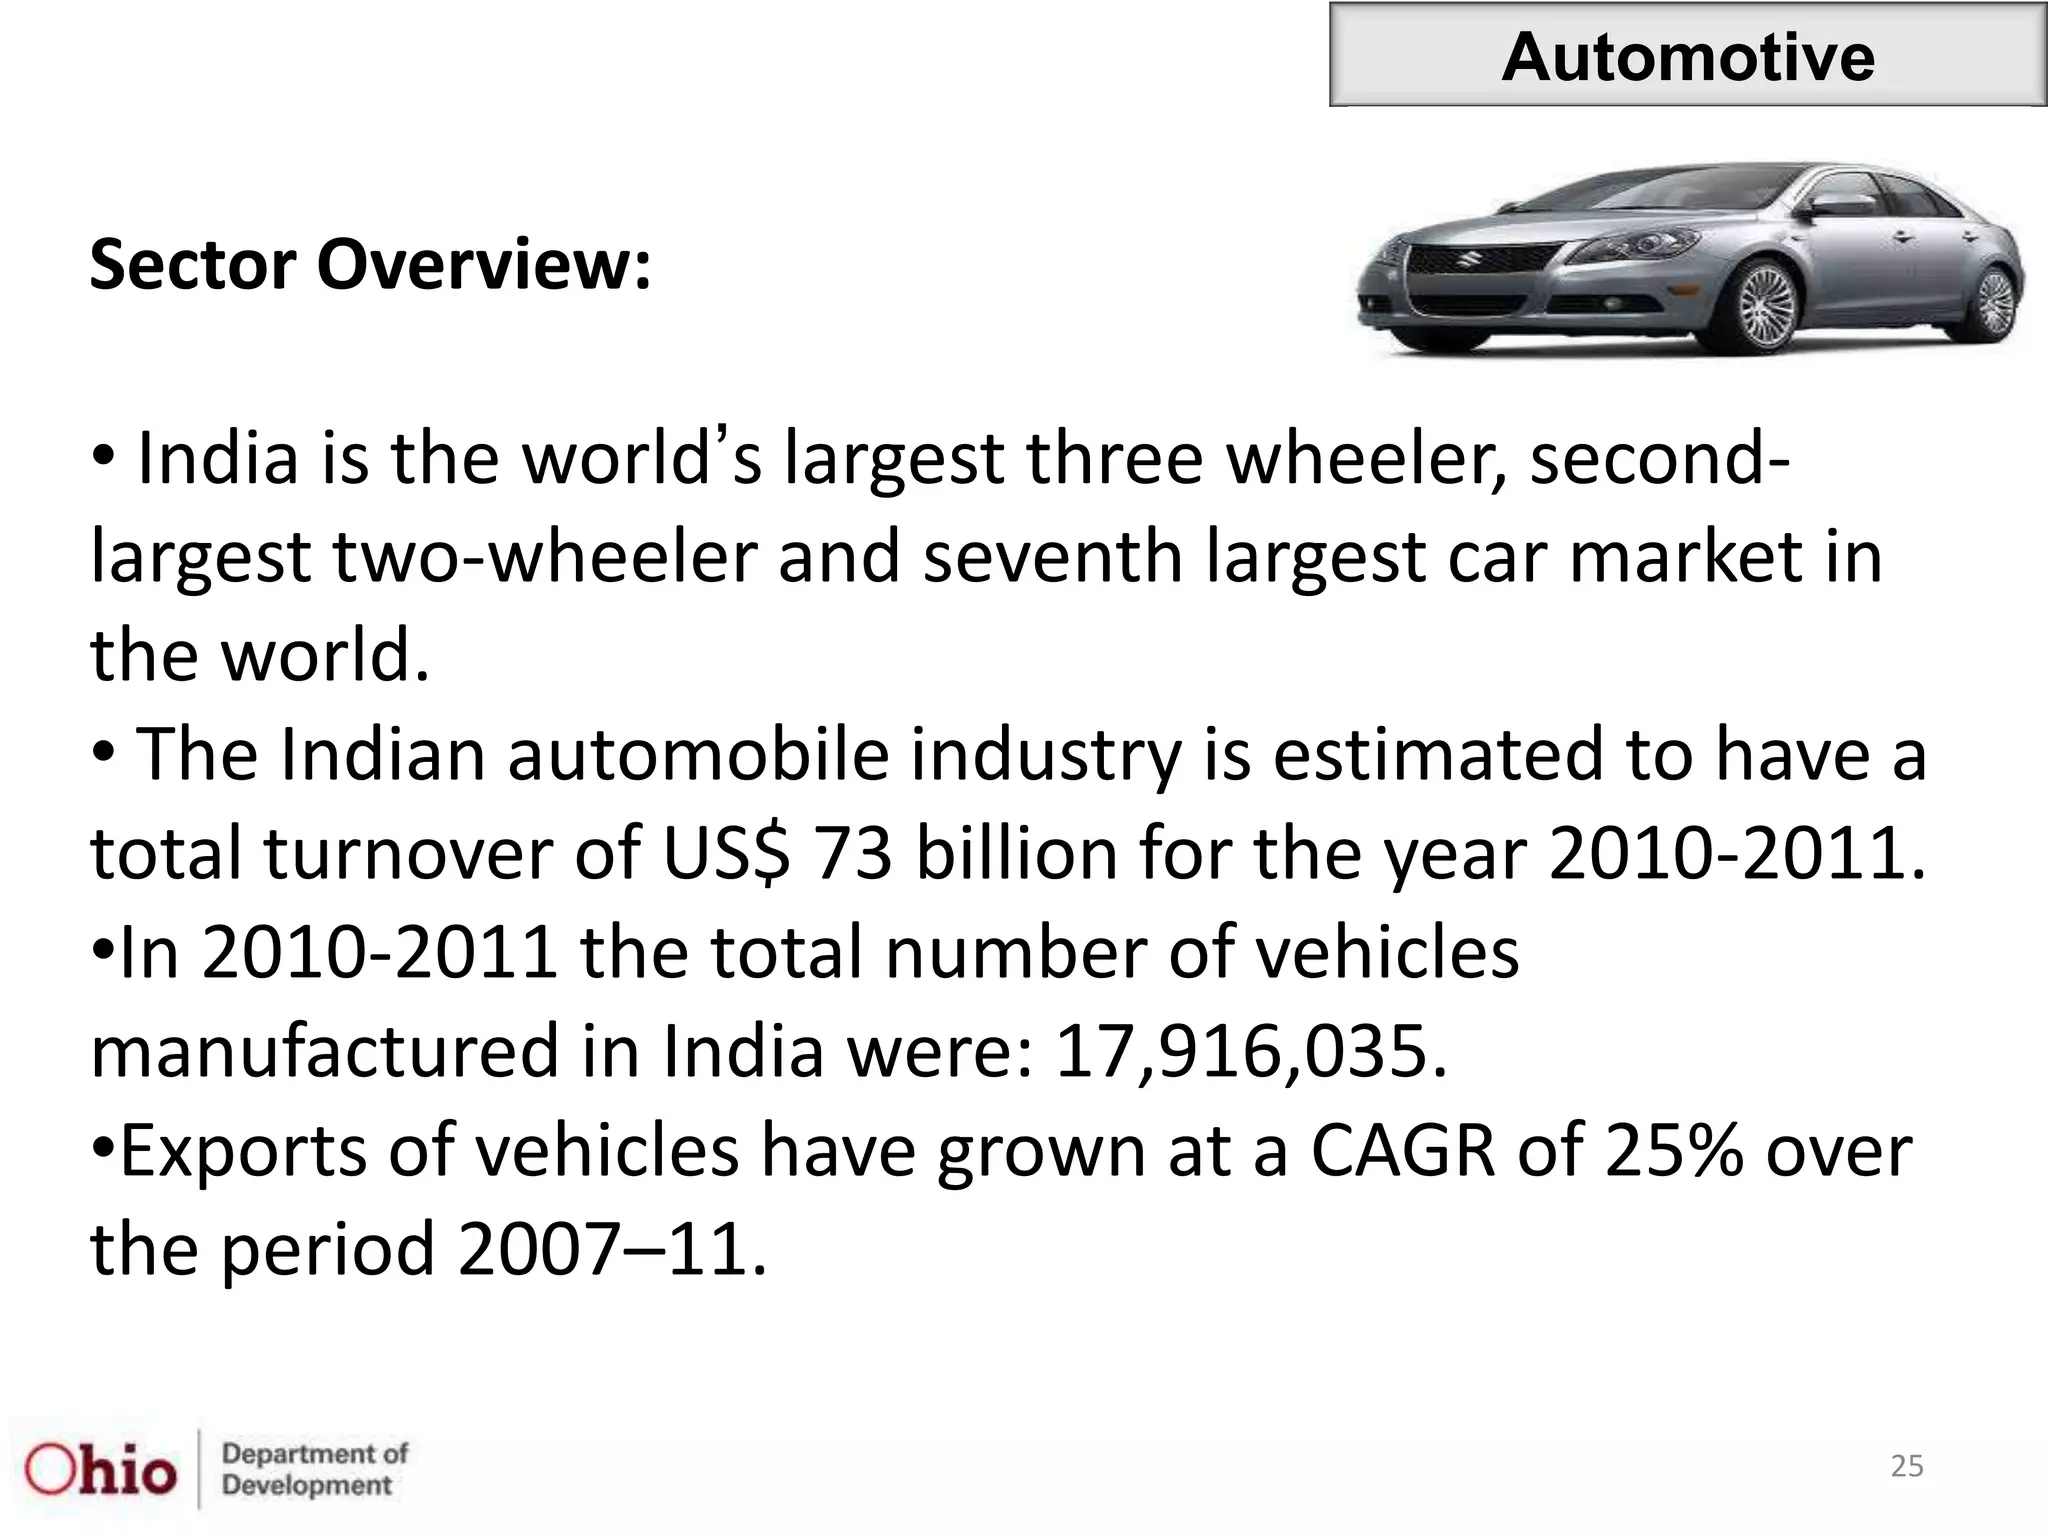
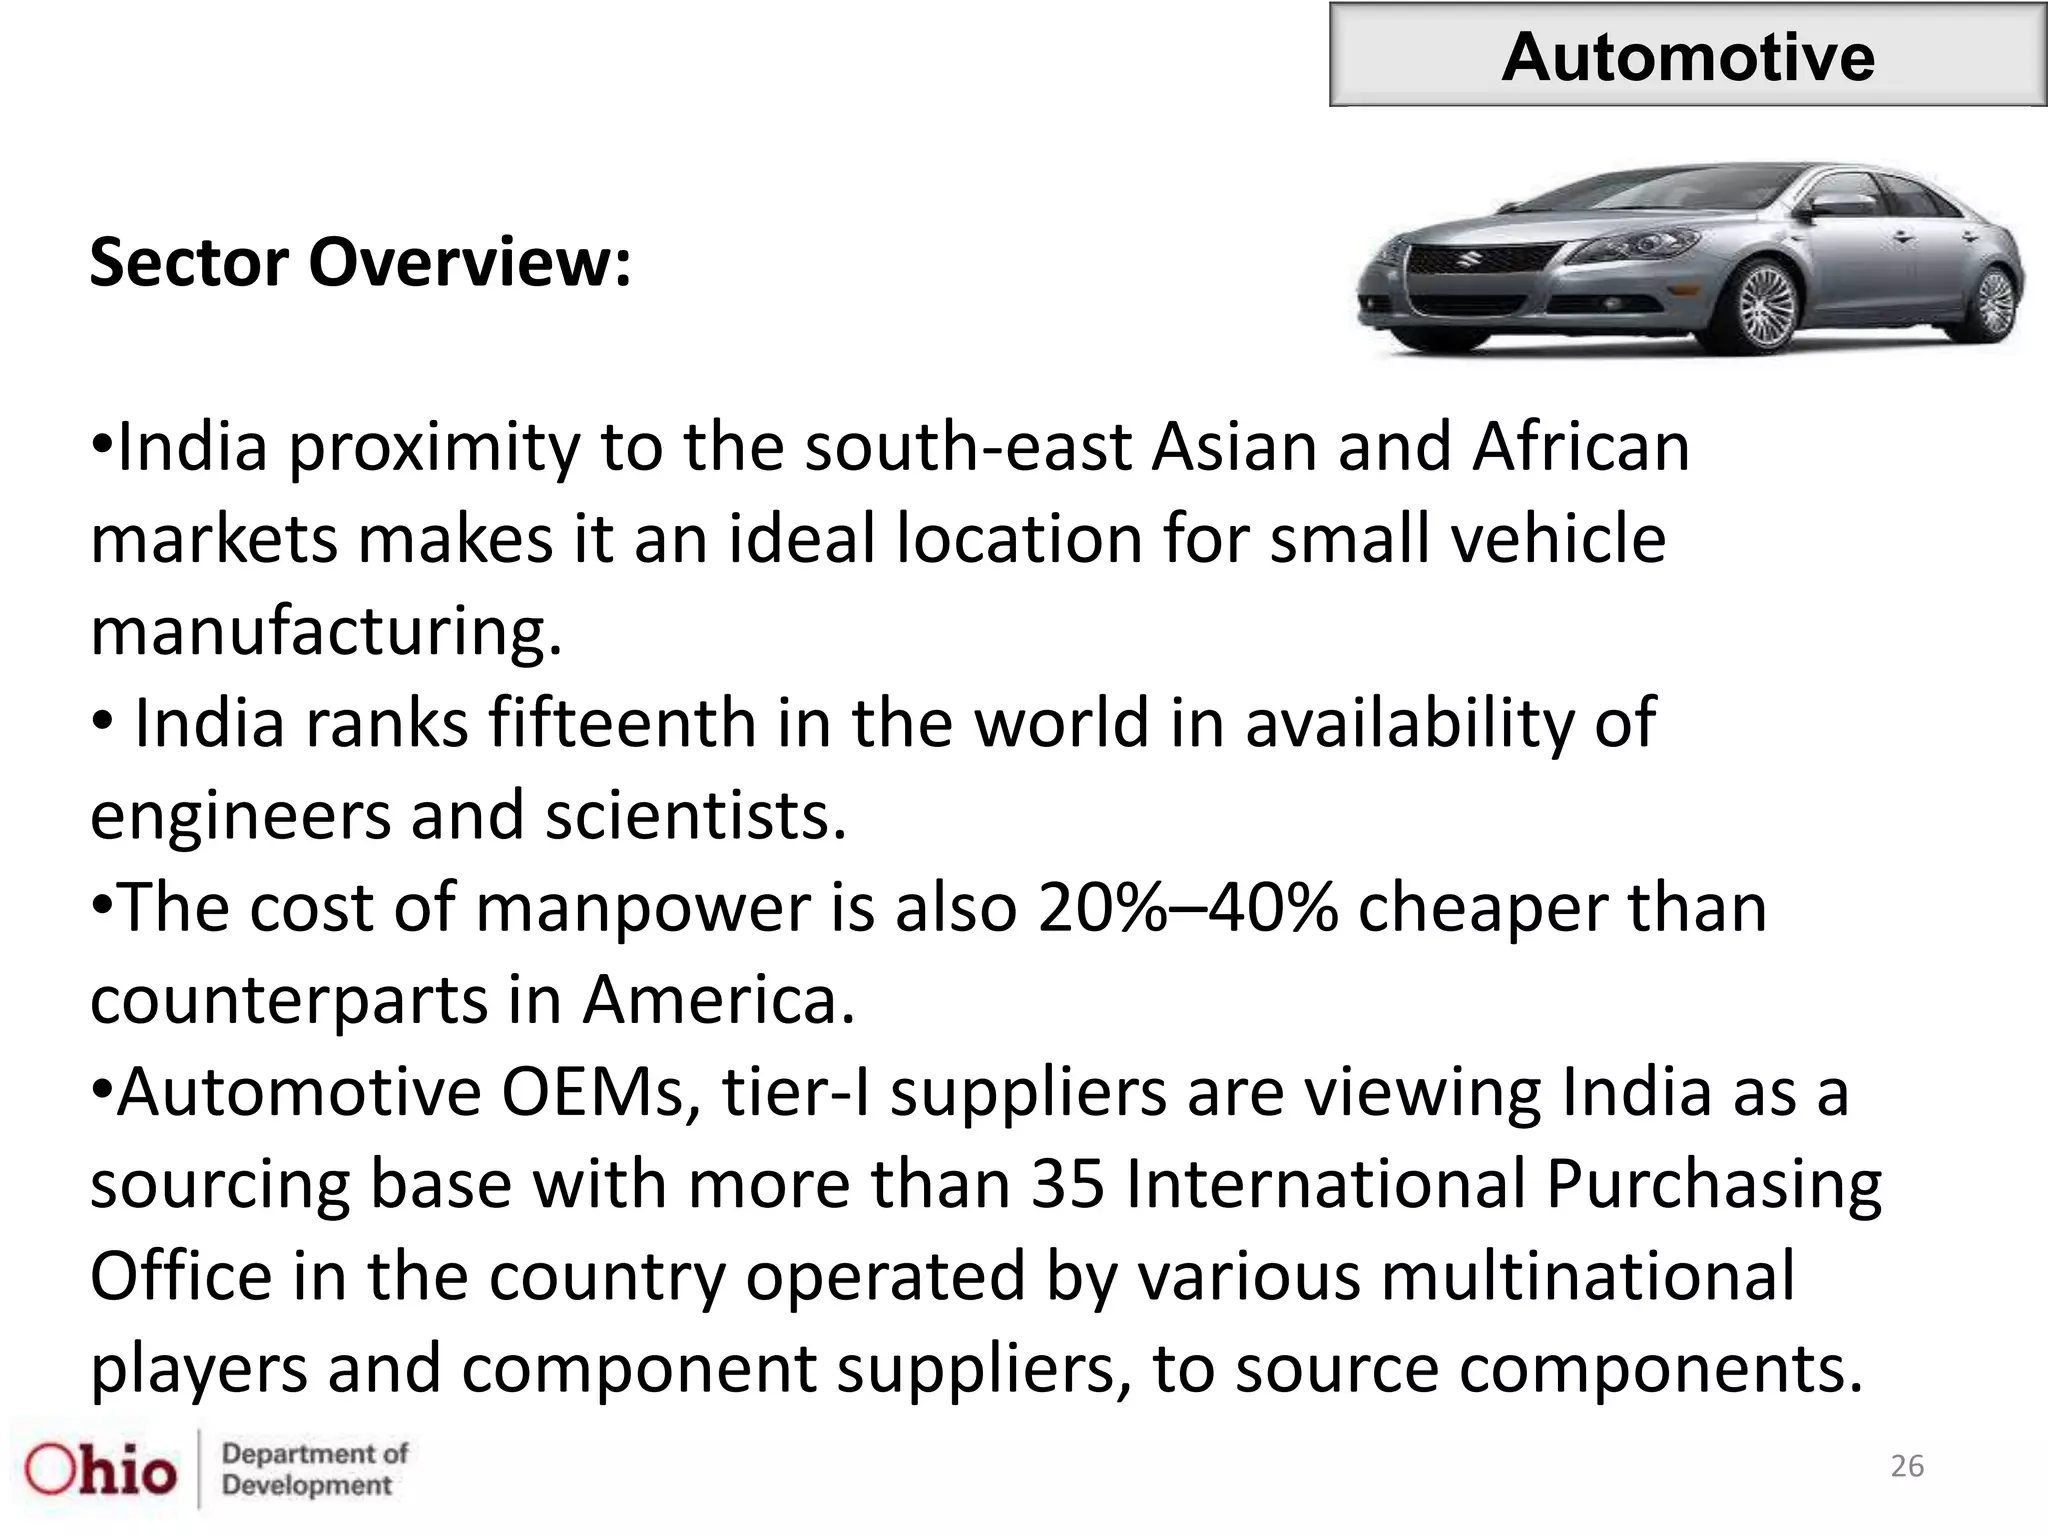
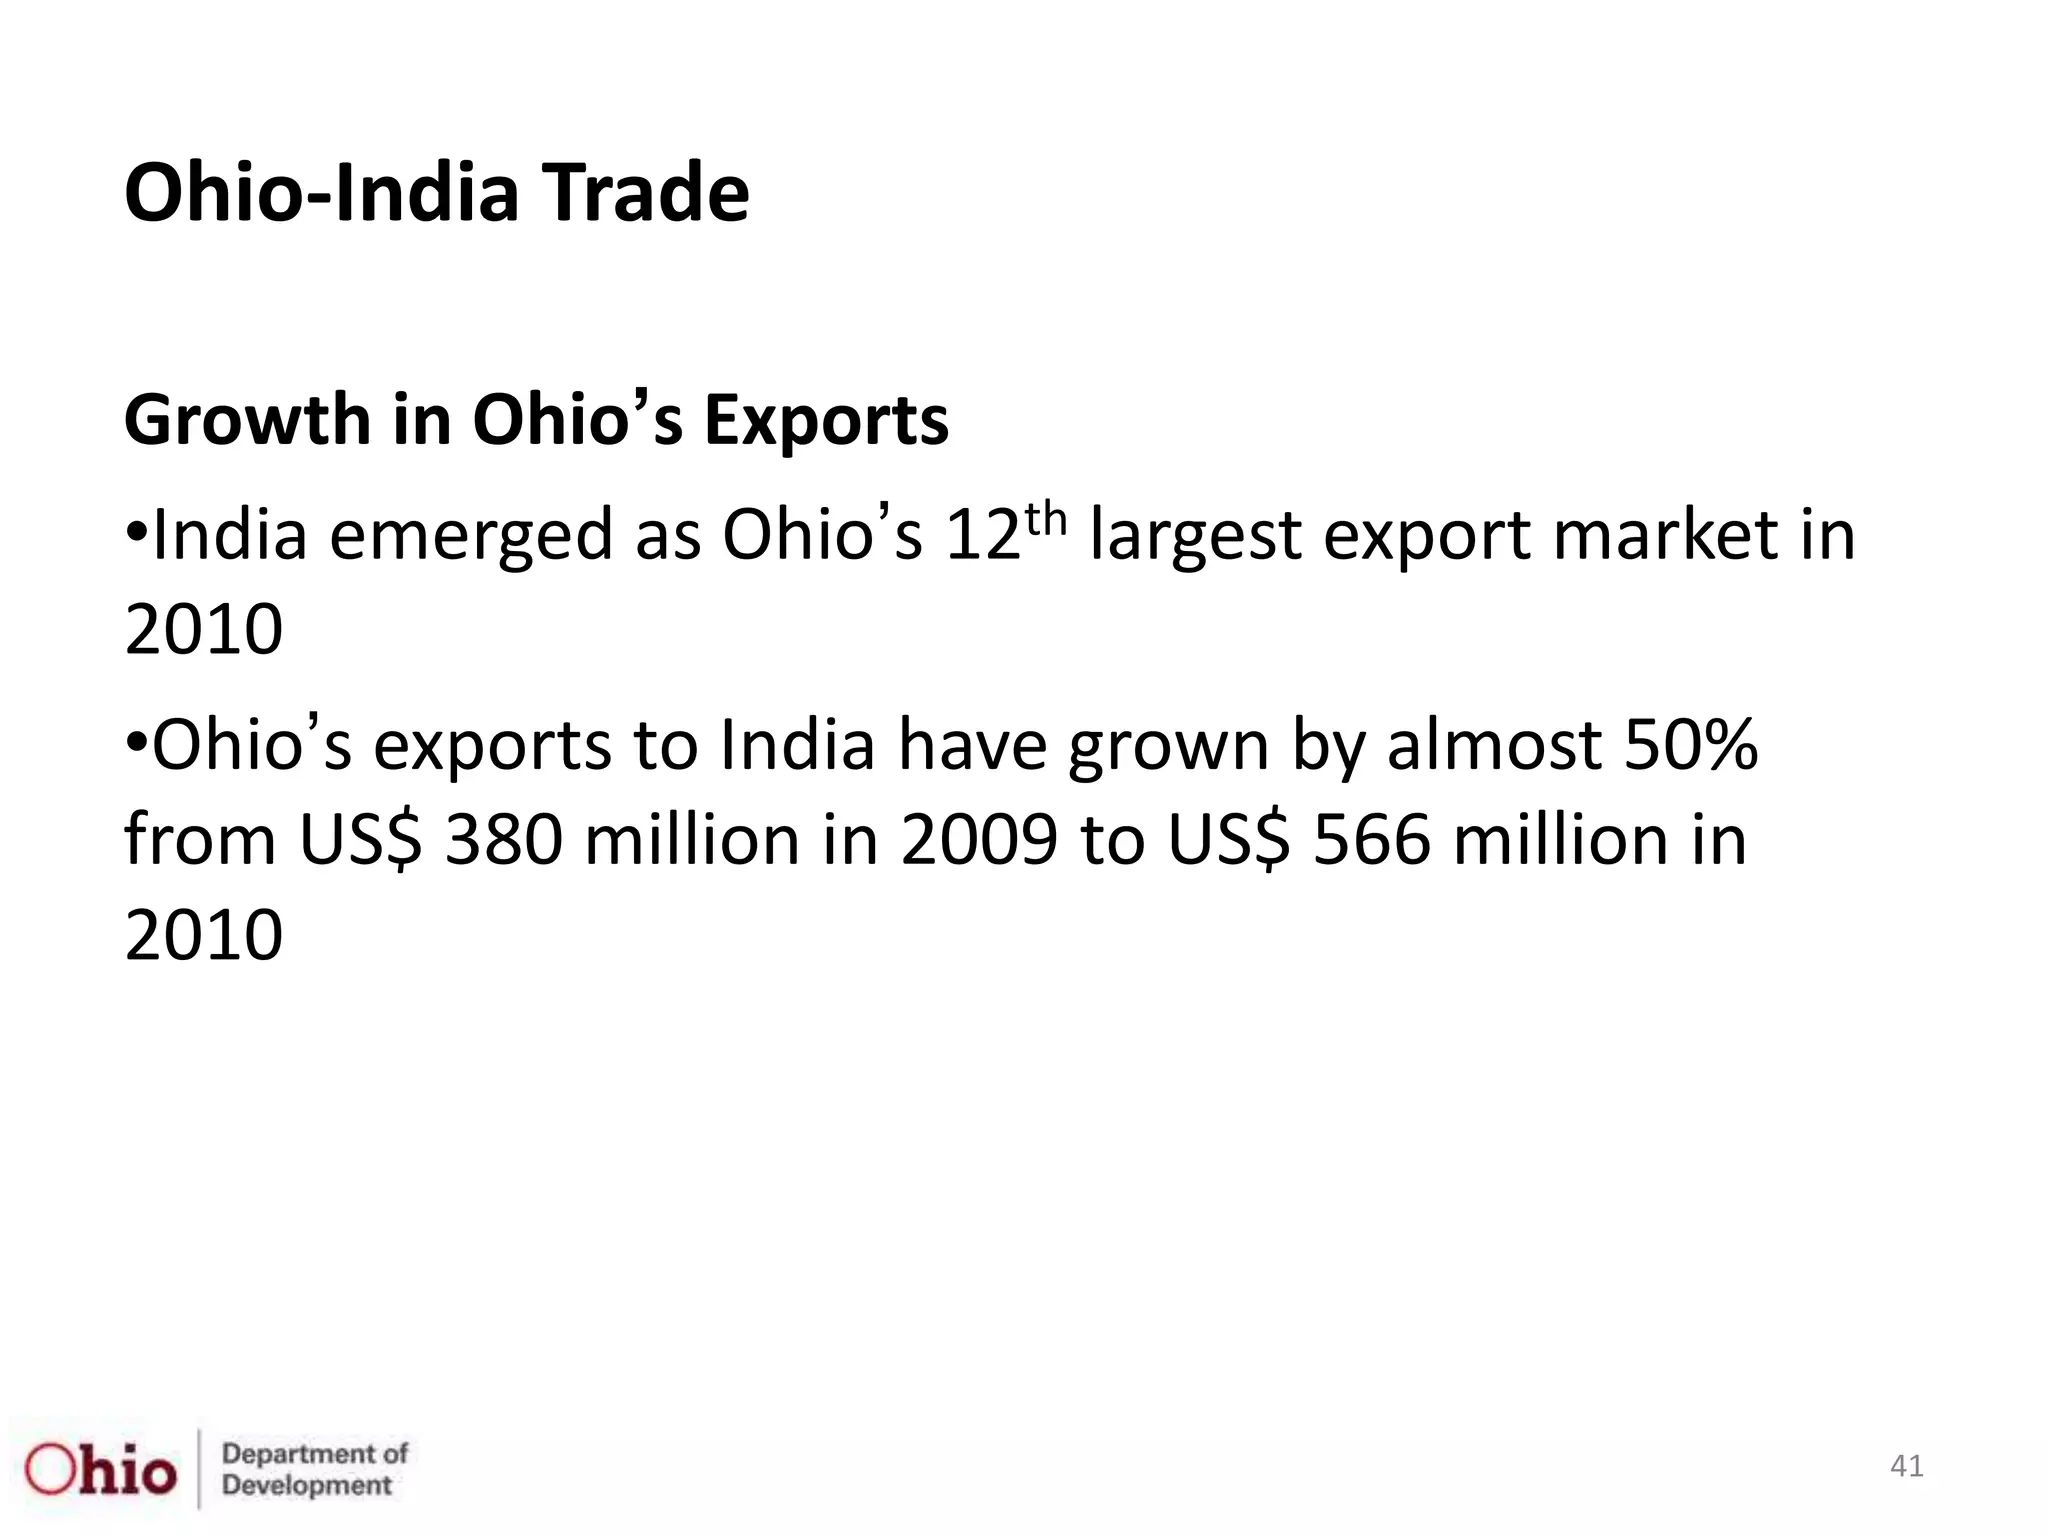
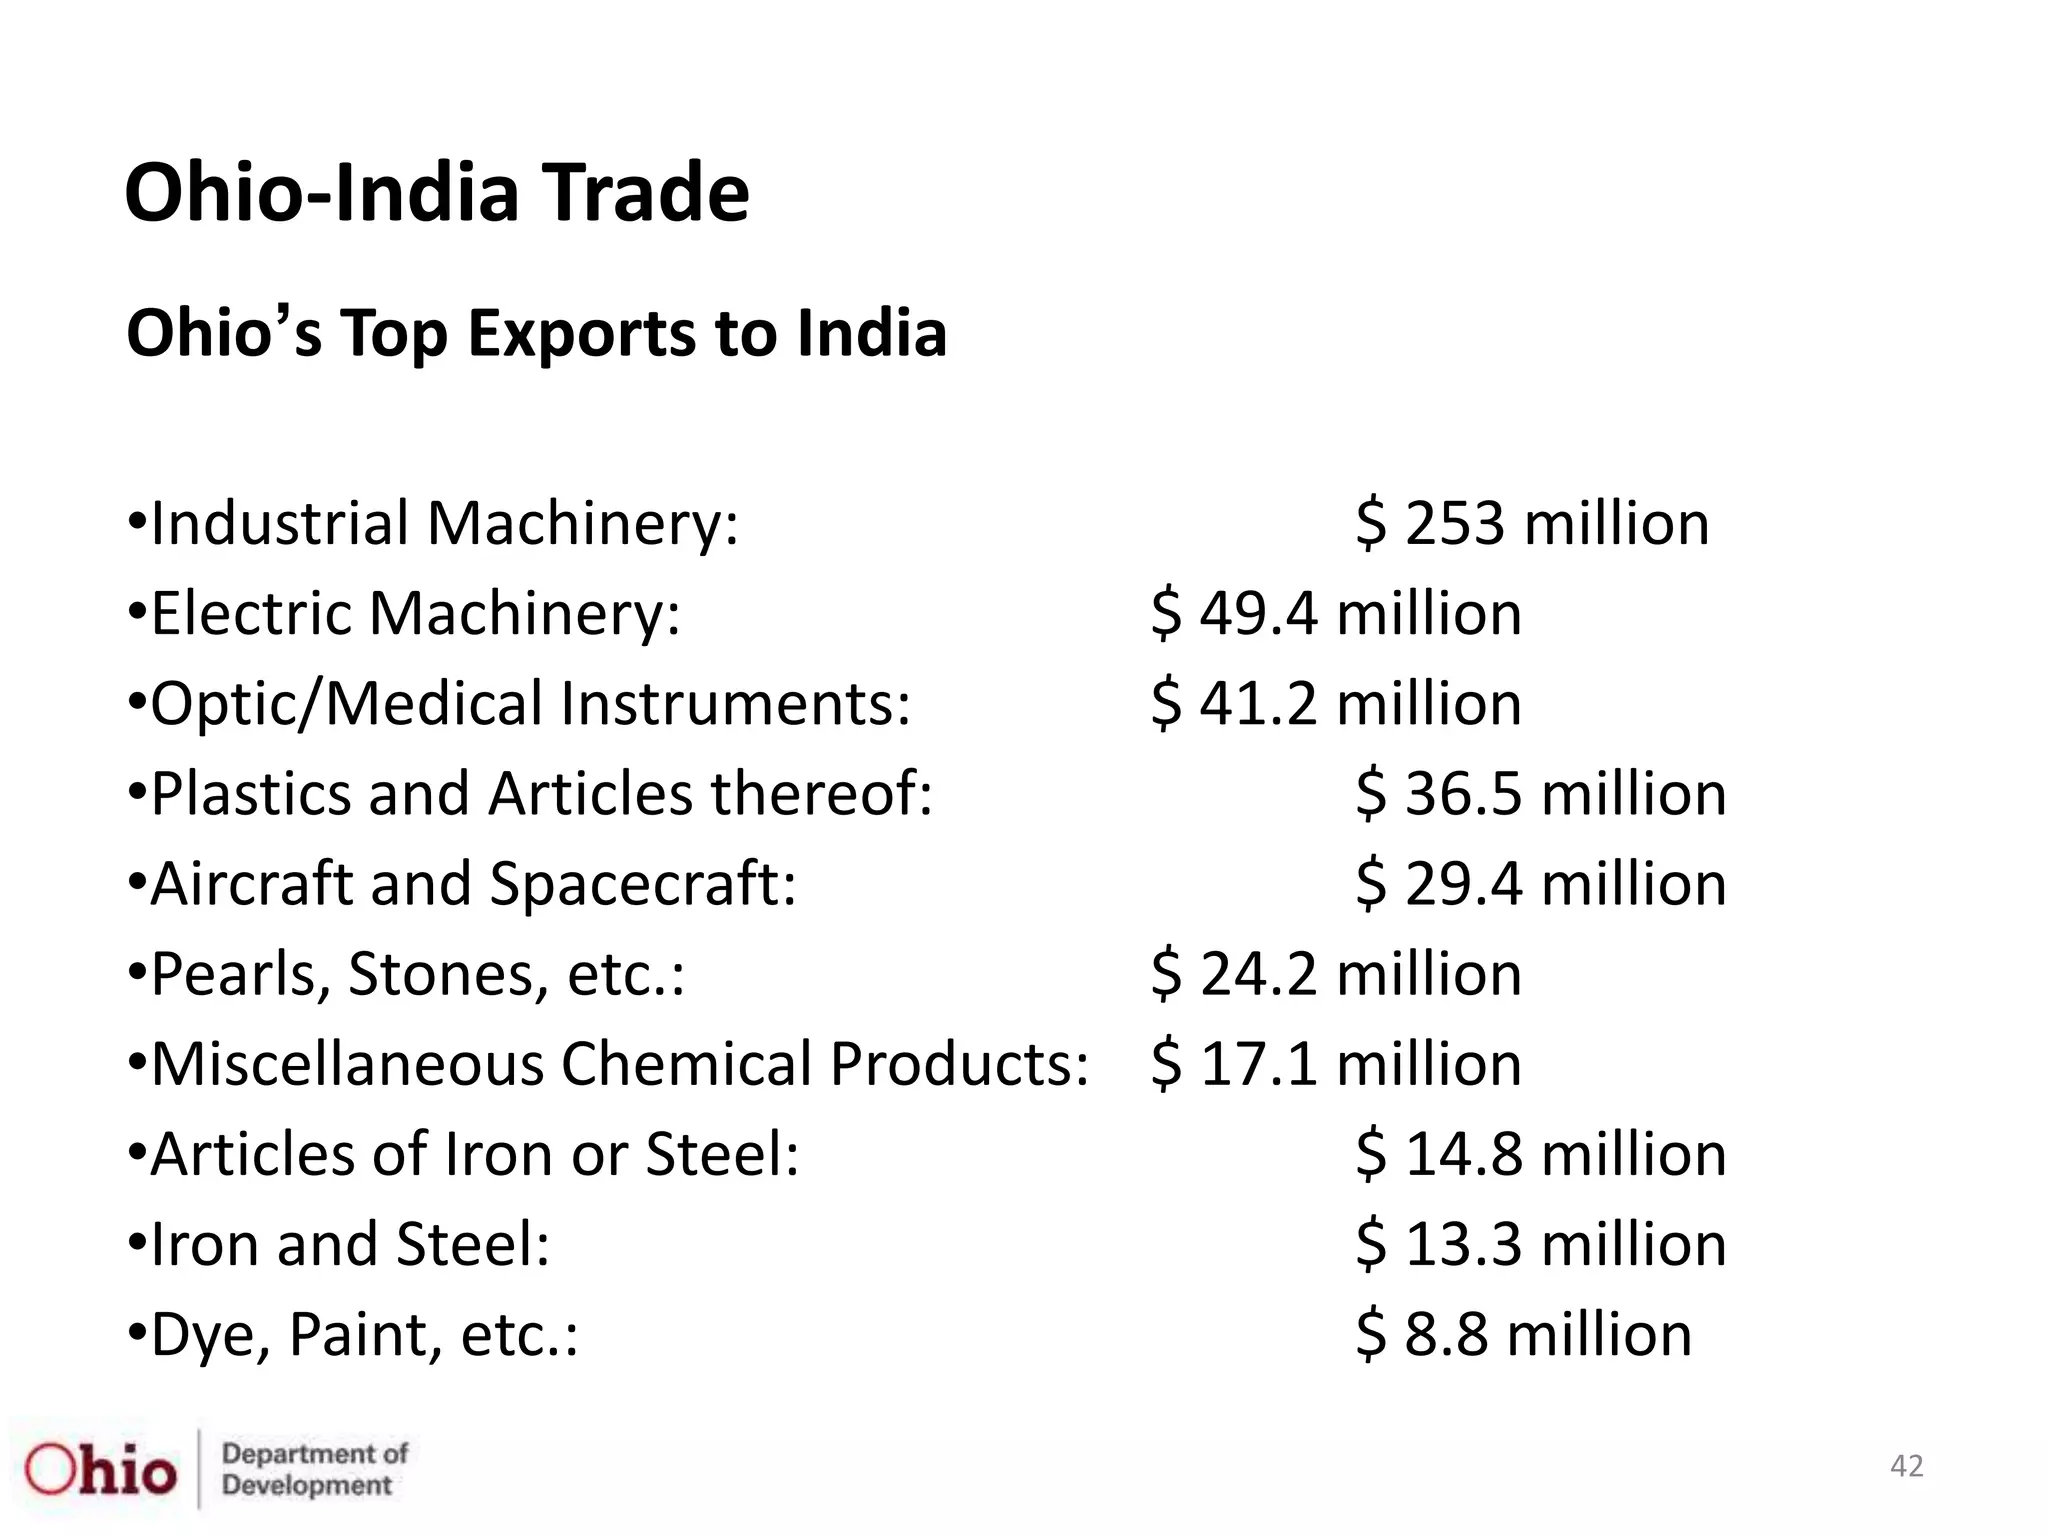
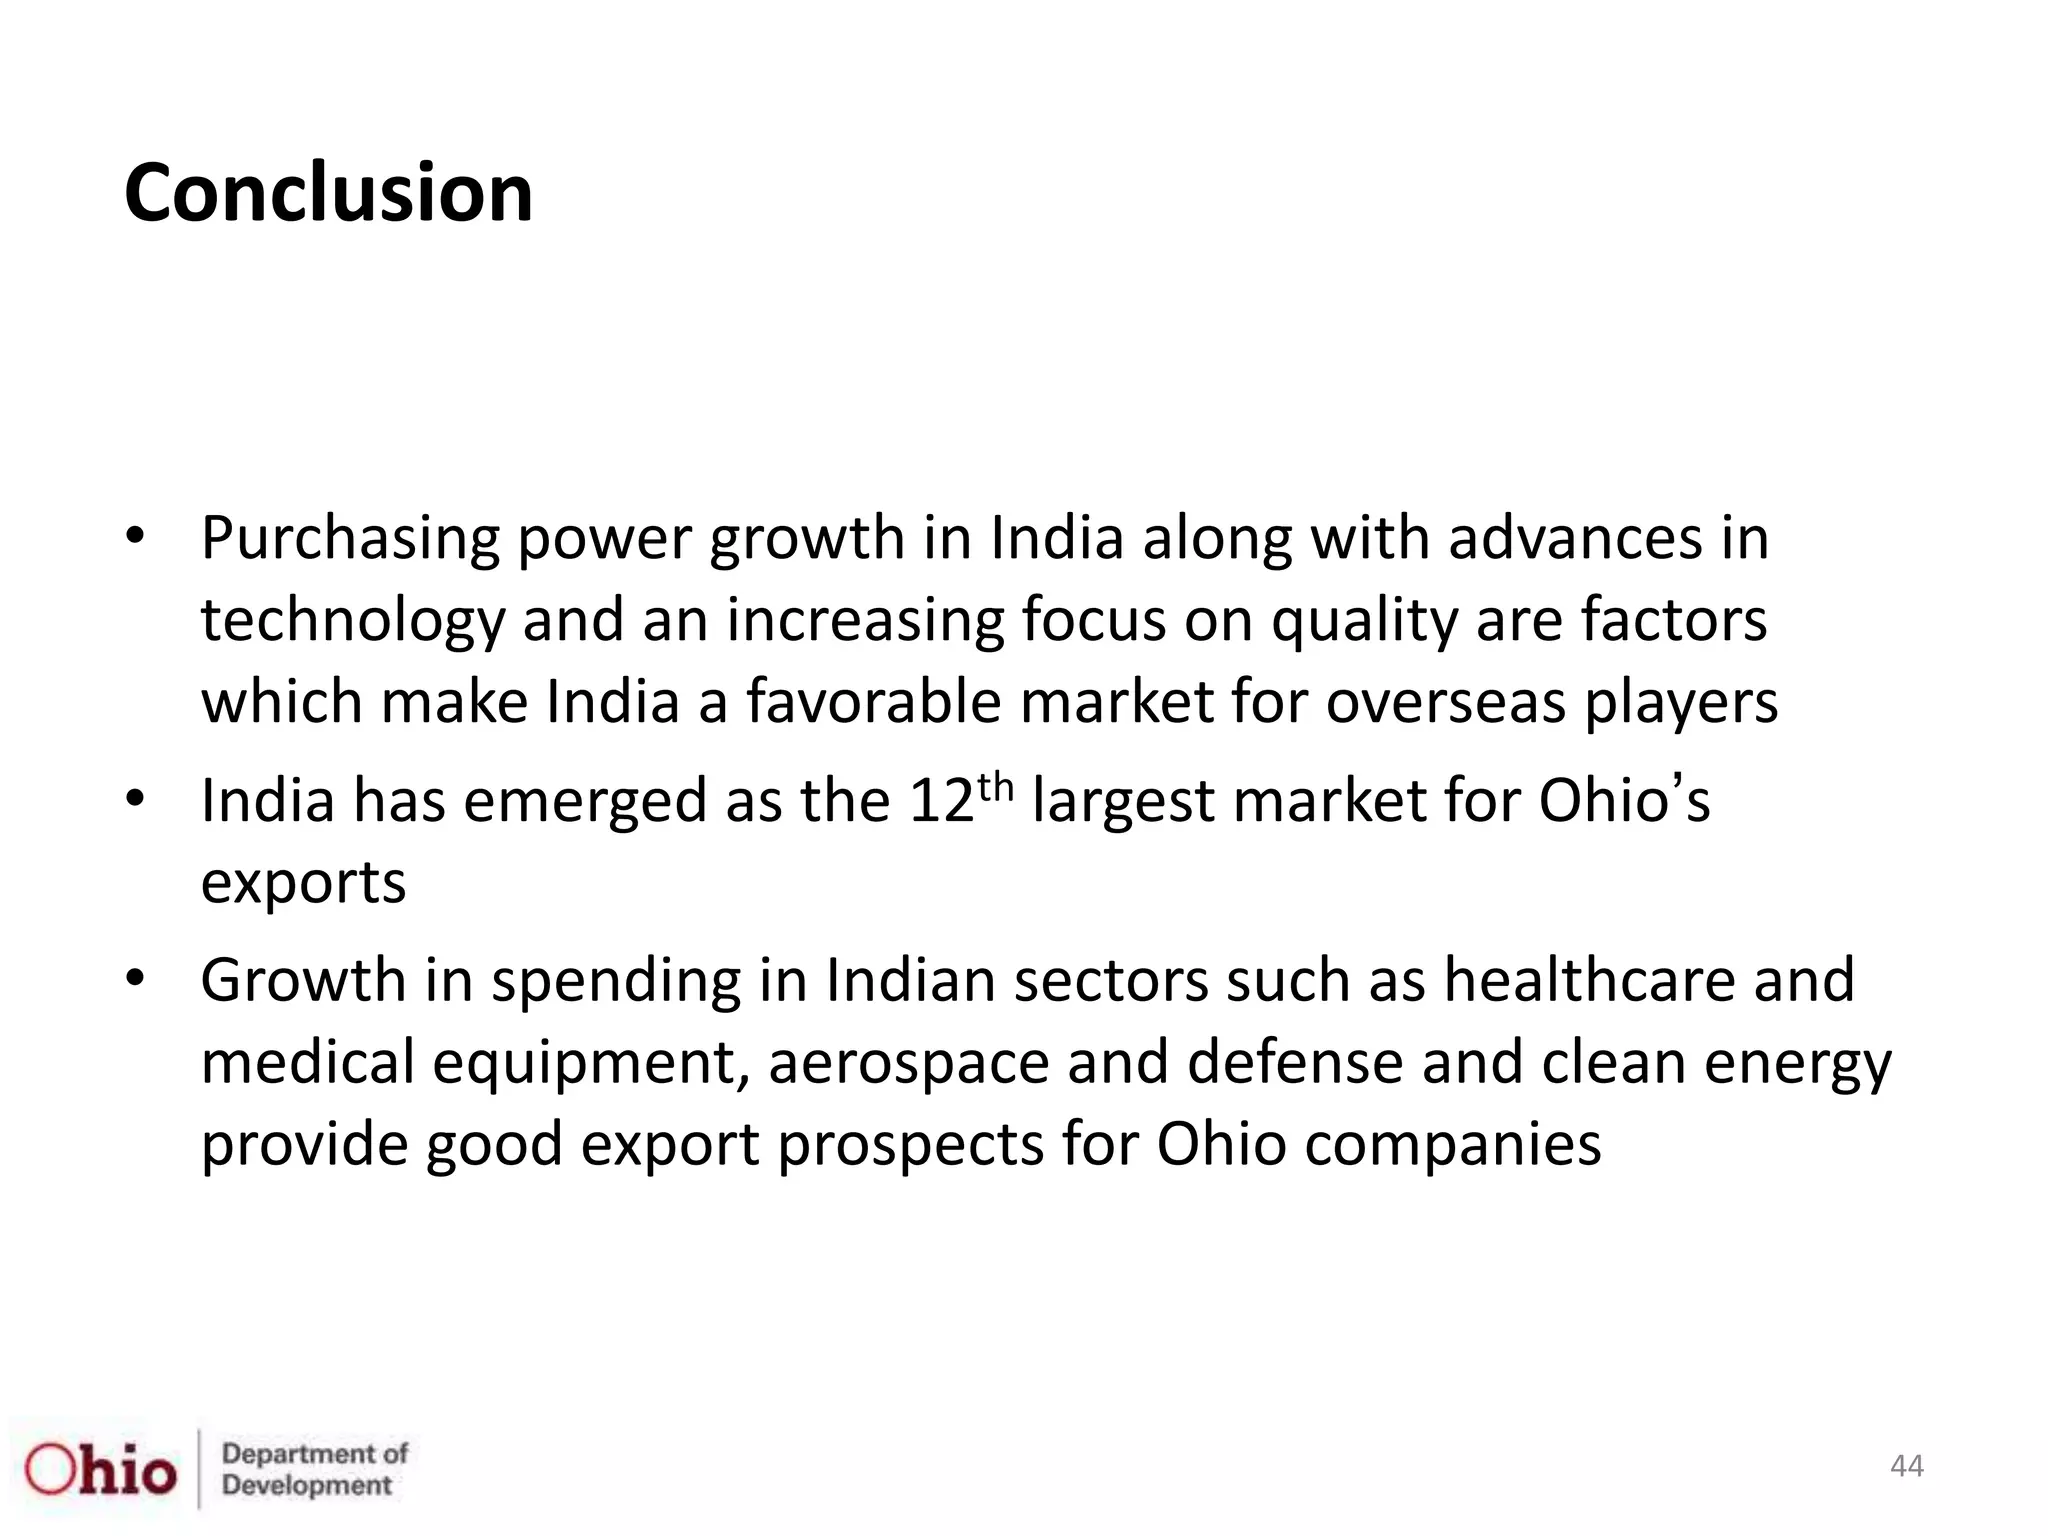
The document provides a comprehensive overview of doing business in India, including its geographical, demographic, political, and economic profiles. Key market sectors highlighted include aerospace and defense, automotive, health sciences, and power, each indicating significant growth and foreign investment opportunities. Additionally, it discusses the increasing trade relations between India and the United States, particularly focusing on Ohio's export growth to India.


