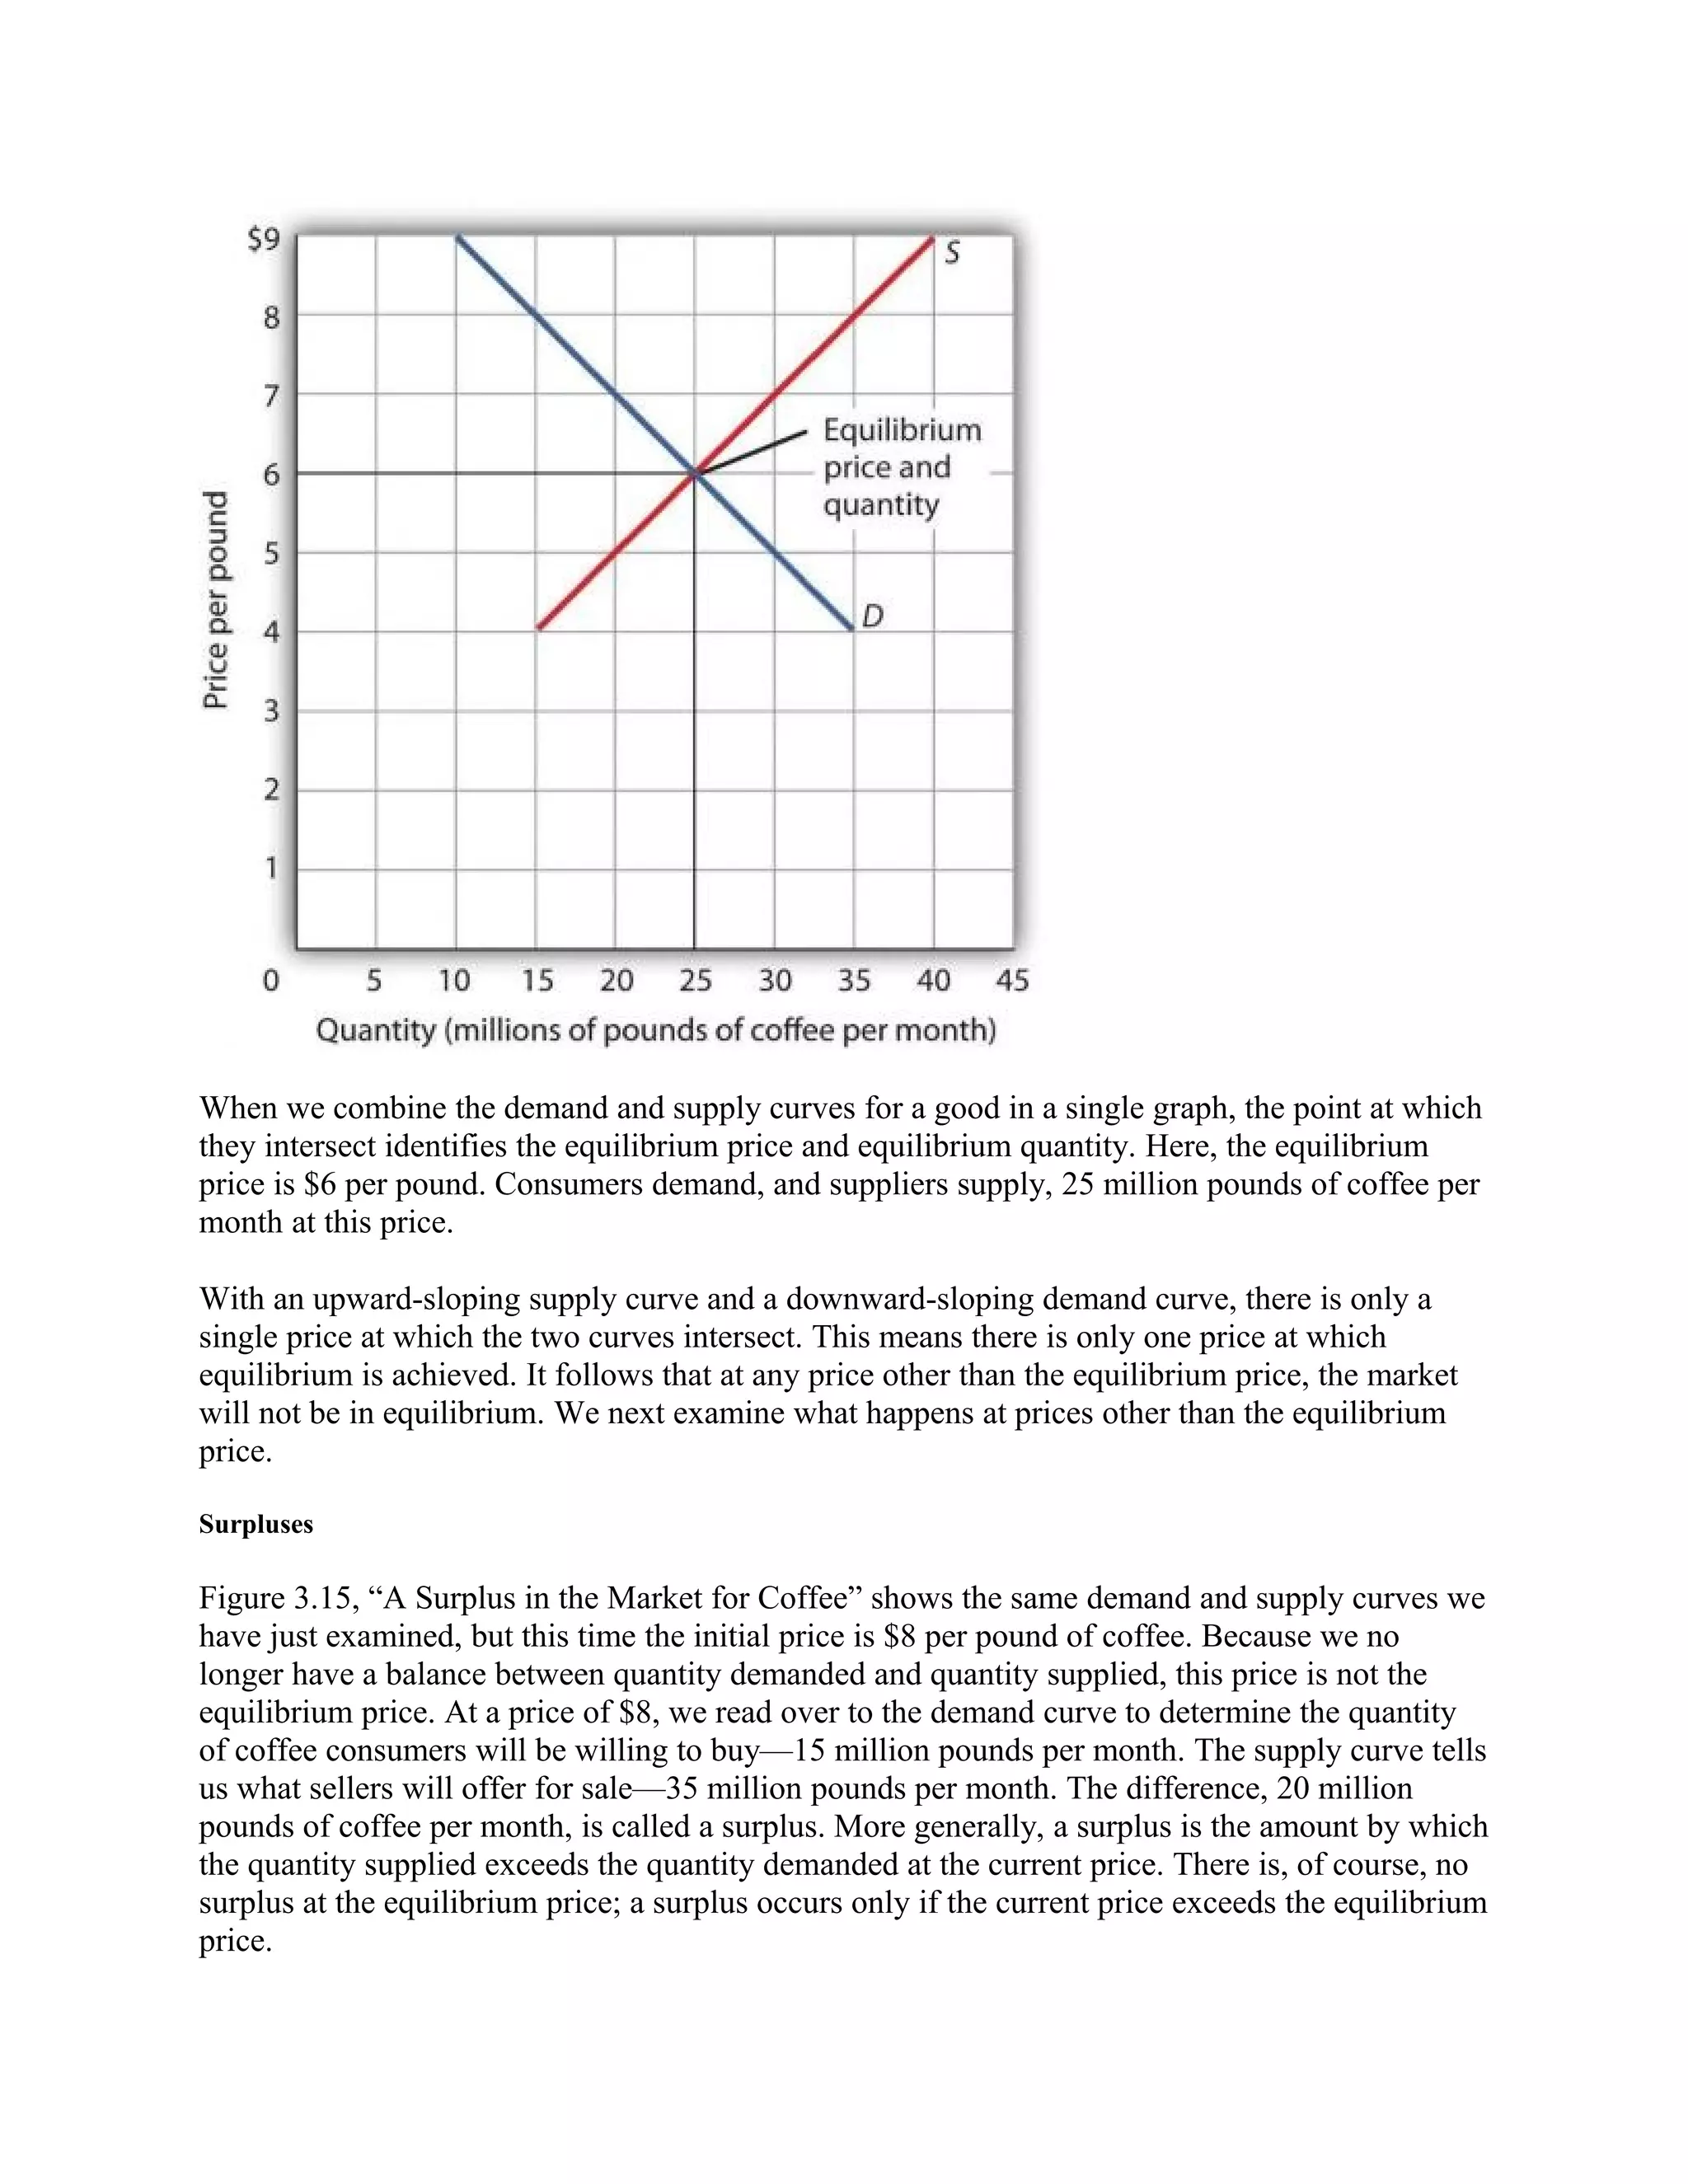
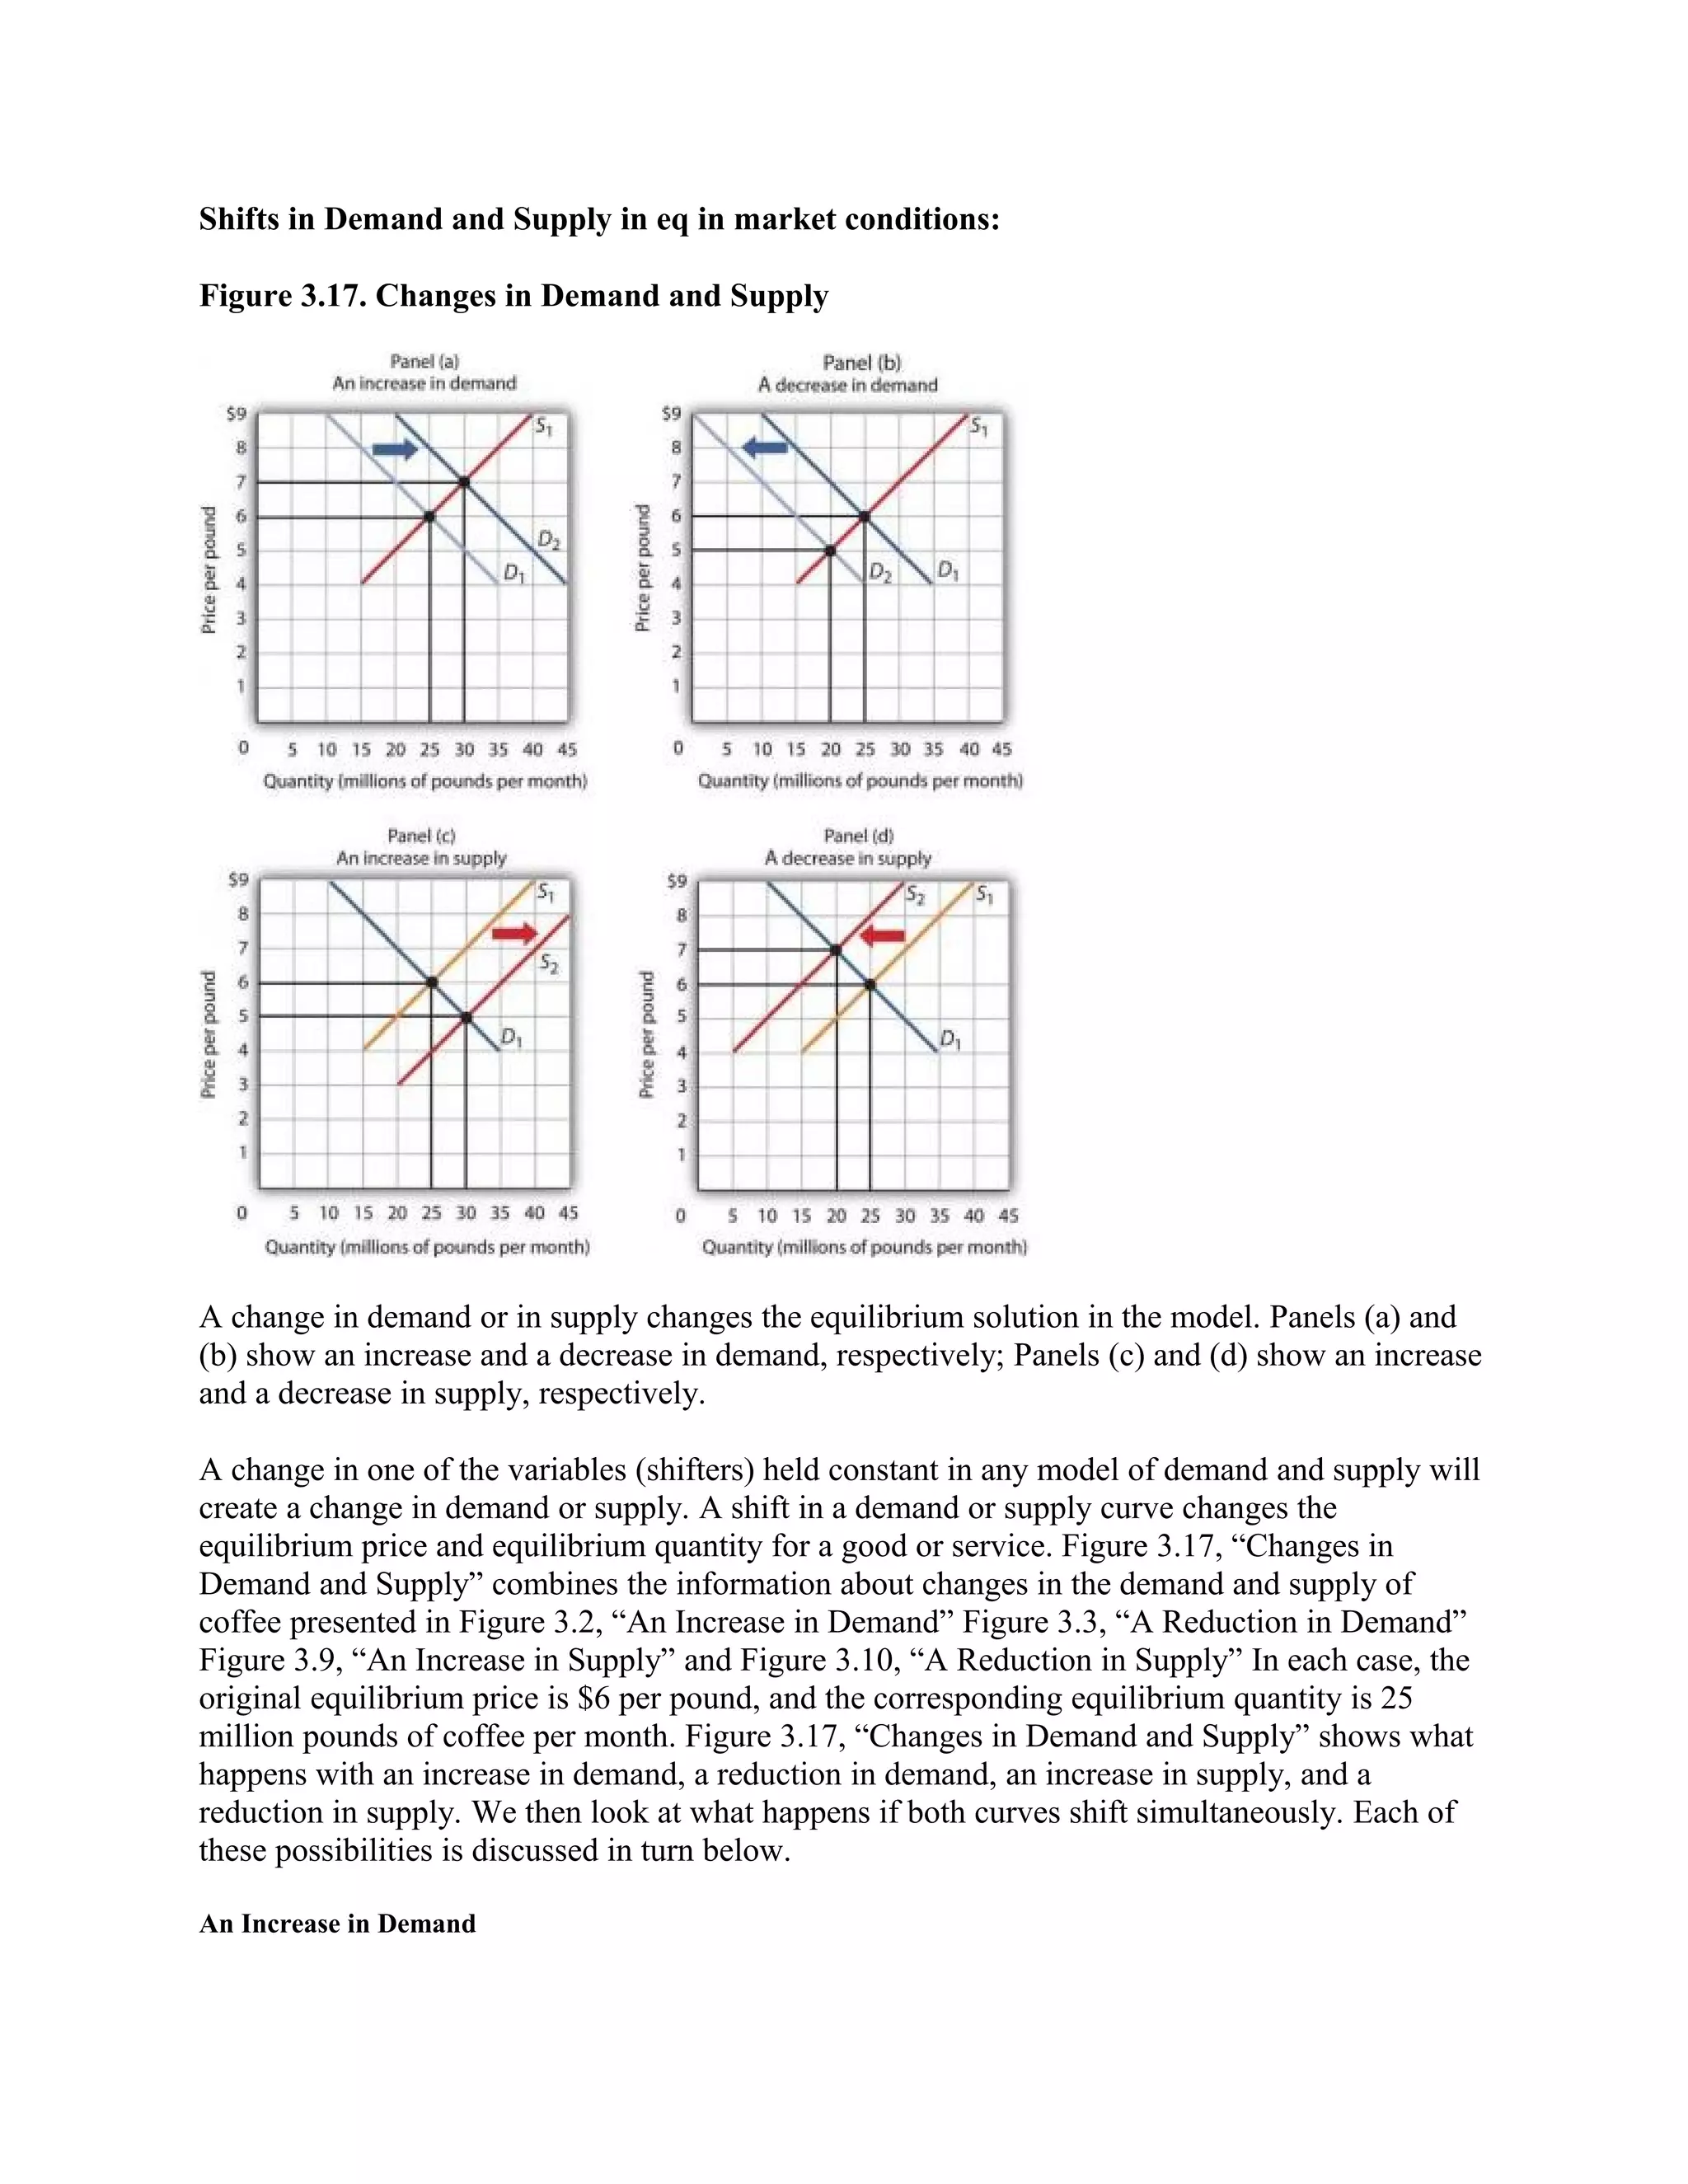
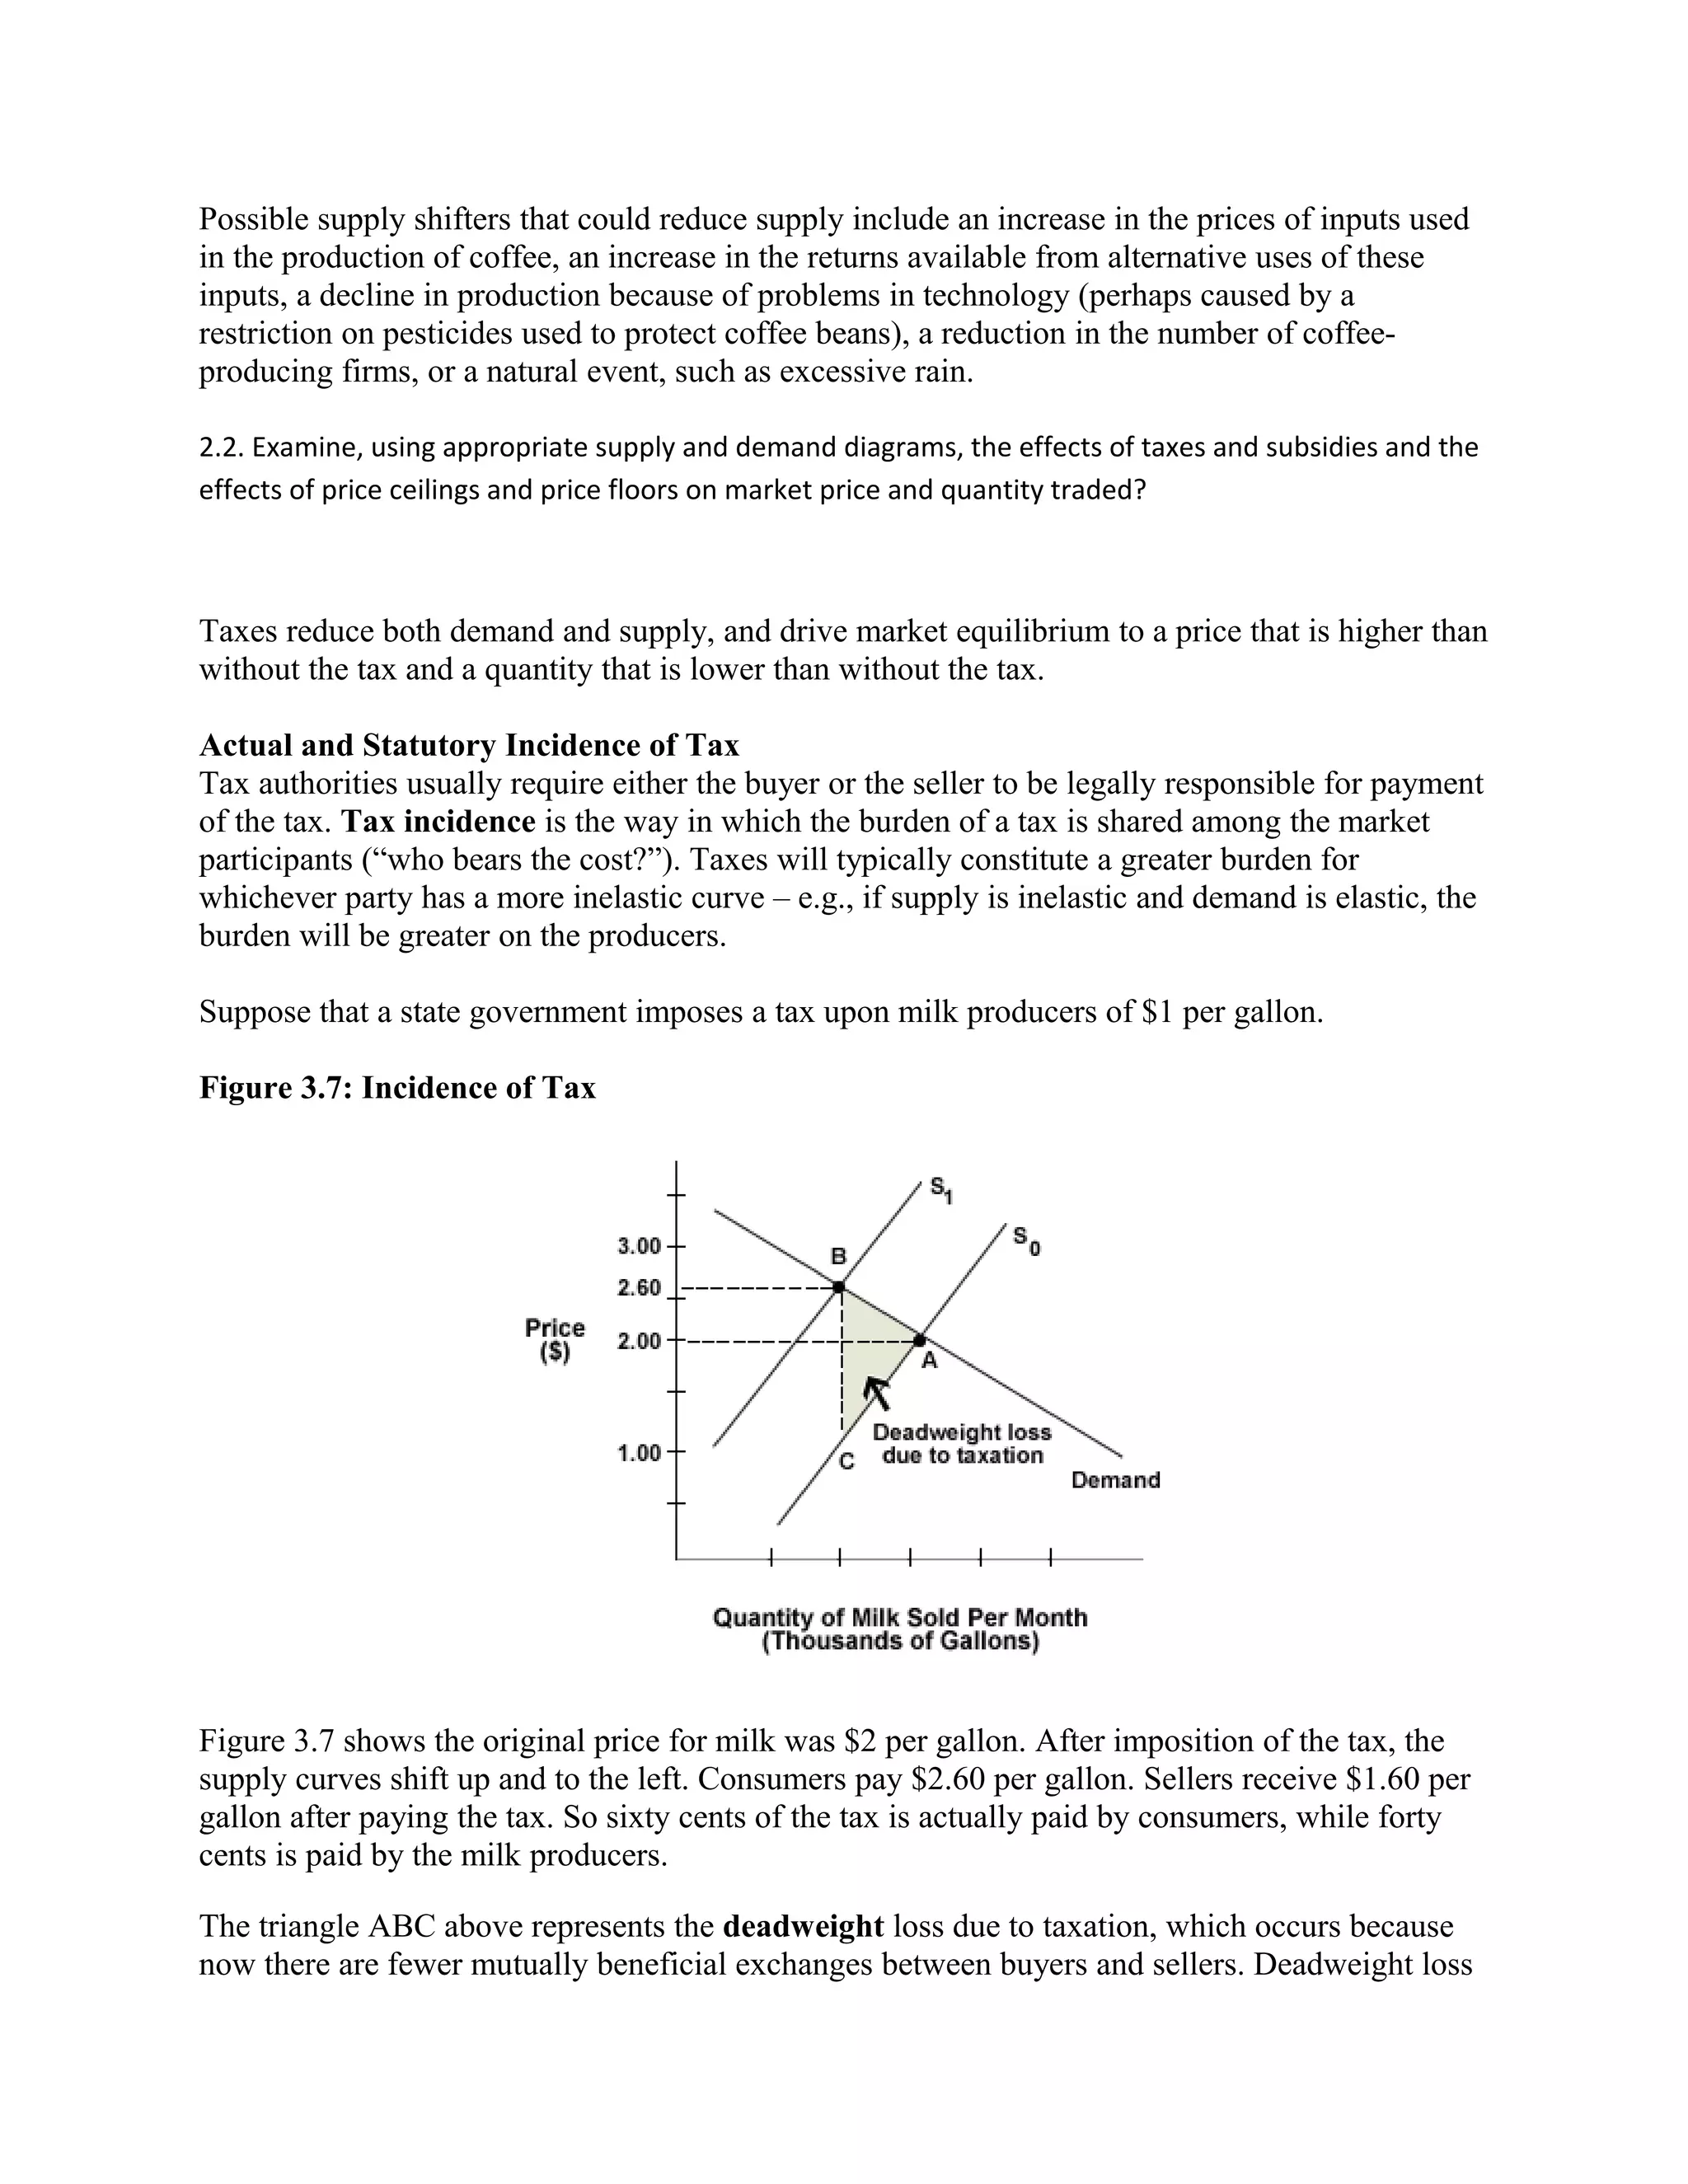
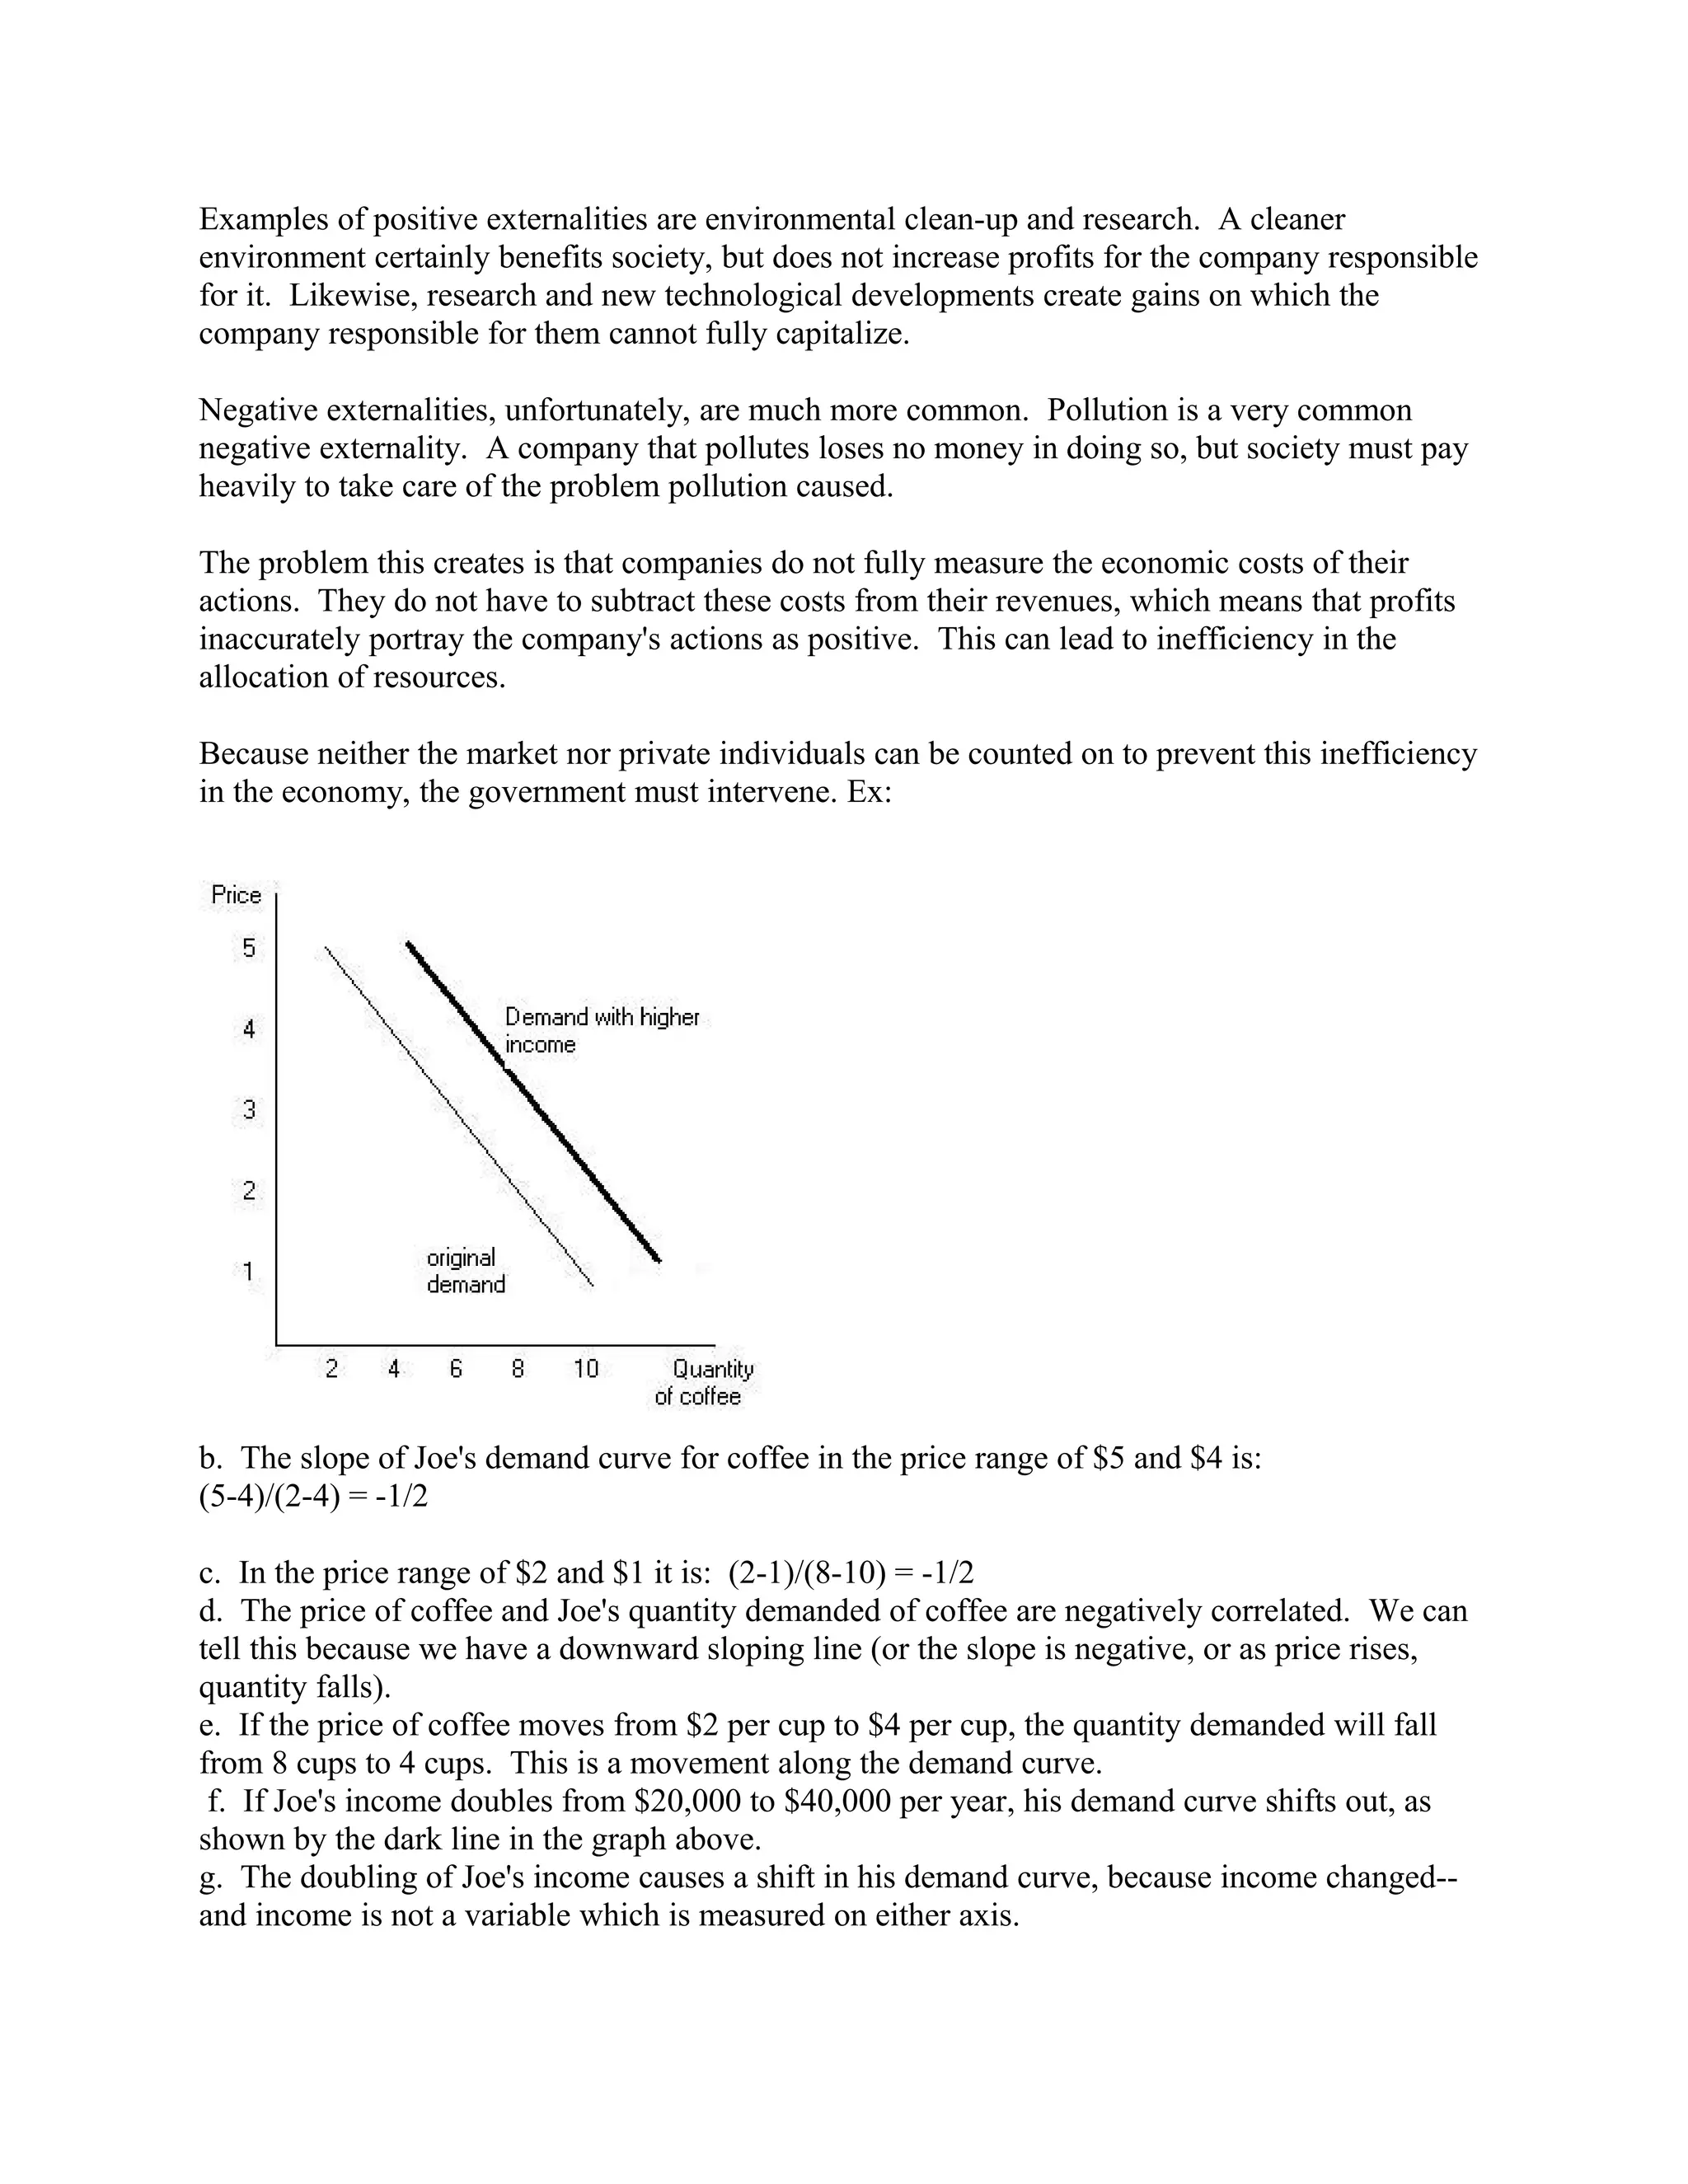
The document explains the concepts of equilibrium, surpluses, and shifts in supply and demand. It defines equilibrium as the price where quantity demanded equals quantity supplied. A surplus occurs when quantity supplied exceeds quantity demanded, resulting in a price above the equilibrium. The effects of changes in supply and demand are shown using diagrams: an increase in demand or supply shifts the curve right, raising the equilibrium price and quantity, while a decrease shifts it left, lowering price and quantity.
In economics, the theory of the second best concerns the situation when one or more optimality conditions cannot be satisfied.
The economists Richard Lipsey and Kelvin Lancaster showed in 1956, that if one optimality condition in an economic model cannot be satisfied, it is possible that the next-best solution involves changing other variables away from the values that would otherwise be optimal.
Politically, the theory implies that if it is infeasible to remove a particular market distortion, introducing a second (or more) market distortion may partially counteract the first, and lead to a more efficient outcome.
The financial theory of investment has been developed by James Duesenberry.
It is also known as the cost of capital theory of investment. The accelerator theories ignore the role of cost of capital in the investment decision by the firm.
They assume that the market rate of interest represents the cost of capital to the firm which does not change the amount of investment it makes. It means that unlimited funds are available to the firm at the market rate of interest. In other words, the supply of funds to the firm is very elastic. In reality, an unlimited supply of funds is not available to the firm in any time period at the market rate of interest.
As more and more funds are required by it for investment spending, the cost of funds (rate of interest) rises.
To finance investment spending, the firm may borrow in the market at whatever interest rate funds are available.
Neo classical general equilibrium theory which is based on Walrasian theory of general equilibrium 2*2*2 model and Marshallian graphical representation
What is history of Economic Thought
Why study History of Economic Thought
Three General Beliefs in the study of History of Economic Thought
History of Economic Thought Vs Economic Thought
Period /Timeline of History of Economic Thought
For full text article go to : https://www.educorporatebridge.com/economics/macro-vs-micro-economics/
This article on Macro vs Micro Economics attempts to analyze the differences between the two most important branches of Economics viz. Macro and Microeconomics and helps understand various economic issues and its effects on investors.
Chapter 5 Efficiency and Equity¡ Using prices in markets to a.docxchristinemaritza
Â
Chapter 5: Efficiency and Equity
¡ Using prices in markets to allocate scarce resources is one of many alternative methods of allocating scarce resources.
¡ Tools such as consumer surplus and producer surplus help evaluate efficiency.
¡ The outcomes from the various methods used to allocate scarce resources, especially markets, can be examined in terms of both their efficiency and fairness.
I.
Resource Allocation Methods
Resources are scarce, so they somehow must be allocated. Different methods of allocating resources include:
¡ Market price: The people who are willing and able to buy a resource get the resource.
¡ Command: a command system allocates resources by the order (command) of someone in authority. A command system works well in organizations with clear lines of authority but does not work well at allocating resources in the entire economy.
¡ Majority rule: resources are allocated in accordance with majority vote. Majority rule works well when the allocation decisions being made affect a large number of people and self-interest leads to bad decisions.
¡ Contest: resources are allocated to the winner. Contests work well when the efforts of the players are hard to measure, such as top managers being in a contest to be named CEO of a company.
¡ First-come, first-serve: resources are allocated to those who are first in line. This allocation method works well when the resource can serve just one user at a time in a sequence, as is the case with, say, a bank teller or an ATM.
¡ Lottery: resources are allocated to the people who pick the winning number, choose the lucky card, etc. Lotteries work best when there is no effective way to distinguish among potential users of a scarce resource.
¡ Personal characteristics: resources are allocated to people with the ârightâ characteristics.
¡ Force: resources are allocated to those who can forcibly take the resources.
II.
Benefit, Cost, and Surplus
Demand, Willingness to Pay, and Value
¡ The value of one more unit of a good or service is its marginal benefit. Marginal benefit is the maximum price that people are willing to pay for another unit of a good or service. And the willingness to pay for a good or service determines the demand for it. Consequently the demand curve for a good or service is also its marginal benefit curve.
¡ The market demand curve is the horizontal sum of the individual demand curves and is formed by adding the quantities demanded by all the individuals at each price.
¡ The demand curve in the figure shows that the maximum price a person is willing to pay for the 6 millionth gallon of milk per month is $3, so $3 is the marginal benefit of this gallon.
¡ MSB curve: In the absence of externalities, which will be discussed later, the market demand curve is also the economyâs marginal social benefit (MSB) curve. It reflects the number of dollarsâ worth of other goods and services willingly given up to obtain one more unit of a good.
¡ The figure shows that the ...
Running Header ECONOMICS PAPER 1Ngai Lam Oscar Wong.docxagnesdcarey33086
Â
Running Header: ECONOMICS PAPER
1
Ngai Lam Oscar Wong
Eco 102
Professor William Albanos
2/14/2013
Question 1)
A)Positive Vs Normative Economic Analysis Statements
Economics as an academic discipline quite commonly uses idea from media analysts, business consultants as well as advisers on government policy. It is therefore very imperative for an individual to understand instances when economists make objective, evidence-based statements concerning the world works as well as when they are making value judgments on policies issues (Beggs). In this case, economist usually uses positive and normative economic in analysis statements. Positive economic statement can be defined as objective, descriptive and factual statement that can be tested amended or rejected by referring to the available evidence and that deal with objective explanation and the testing and rejection of theories. On the other hand, negative economic statement can be referred to as statements that are subjective, prescriptive and value-based statements rather than objective statements. Positive economic statement is therefore objective and fact based, while normative economic statement is subjective and value based. Positive economic statements do not have to be correct, but they must be able to be tested and proved or disproved. Normative economic statements are opinion based, so they cannot be proved or disproved.
In summaries, a positive statement is a statement about what is and that contains no indication of approval or disapproval. It is the study of the causal relationships that exist in the economy. Positive economics deals with objective explanation and the testing and rejection of theories. It just states what the relationship is. There are no value judgments involved. The statement âif taxes on tobacco is doubled, there will be substantial reduction in tobacco consumptionâ is a positive economic statement. It just states what the situation is. âIf government subsidy to basic education is reduced, there will be higher drop-outs among children of poor familiesâ, is another positive economic statement.
On the other hand, a normative statement expresses a judgment about whether a situation is desirable or undesirable. Value judgments play an integral part in the ranking of possible objectives and the choices to be made among them. "The world would be a better place if the moon were made of green cheese" is a normative statement because it expresses a judgment about what ought to be ,buy most statements are not easily categorized as purely positive or purely normative. For example: Unemployment is more harmful than inflation. Notice that there is no way of disproving this statement. If you disagree with it, you have no sure way of convincing someone who believes the statement that he is wrong. Normative statements are subjective statements rather than objective statements â i.e. they carry value judgments. For example, price of second hand cars are falling. How.
Chapter 3 Demand and Supply in the text Principles of Microec.docxwalterl4
Â
Chapter 3: Demand and Supply in the text Principles of Microeconomics by OpenStax is available under
a Creative Commons Attribution 4.0 license. Š Feb 25, 2016 OpenStax.
http://cnx.org/contents/[email protected]
http://creativecommons.org/licenses/by/4.0/
3 | Demand and Supply
Figure 3.1 Farmerâs Market Organic vegetables and fruits that are grown and sold within a specific geographical
region should, in theory, cost less than conventional produce because the transportation costs are less. That is not,
however, usually the case. (Credit: modification of work by Natalie Maynor/Flickr Creative Commons)
Why Can We Not Get Enough of Organic?
Organic food is increasingly popular, not just in the United States, but worldwide. At one time, consumers had
to go to specialty stores or farmerâs markets to find organic produce. Now it is available in most grocery stores.
In short, organic is part of the mainstream.
Ever wonder why organic food costs more than conventional food? Why, say, does an organic Fuji apple cost
$1.99 a pound, while its conventional counterpart costs $1.49 a pound? The same price relationship is true for
just about every organic product on the market. If many organic foods are locally grown, would they not take
less time to get to market and therefore be cheaper? What are the forces that keep those prices from coming
down? Turns out those forces have a lot to do with this chapterâs topic: demand and supply.
Introduction to Demand and Supply
In this chapter, you will learn about:
⢠Demand, Supply, and Equilibrium in Markets for Goods and Services
⢠Shifts in Demand and Supply for Goods and Services
⢠Changes in Equilibrium Price and Quantity: The Four-Step Process
Chapter 3 | Demand and Supply 43
Download for free at http://cnx.org/contents/[email protected]
⢠Price Ceilings and Price Floors
An auction bidder pays thousands of dollars for a dress Whitney Houston wore. A collector spends a small fortune
for a few drawings by John Lennon. People usually react to purchases like these in two ways: their jaw drops because
they think these are high prices to pay for such goods or they think these are rare, desirable items and the amount paid
seems right.
Visit this website (http://openstaxcollege.org/l/celebauction) to read a list of bizarre items that have been
purchased for their ties to celebrities. These examples represent an interesting facet of demand and supply.
When economists talk about prices, they are less interested in making judgments than in gaining a practical
understanding of what determines prices and why prices change. Consider a price most of us contend with weekly:
that of a gallon of gas. Why was the average price of gasoline in the United States $3.71 per gallon in June 2014?
Why did the price for gasoline fall sharply to $2.07 per gallon by January 2015? To explain these price movements,
economists focus on the determinants of what gasoline buyers are willing to pay and what gasoline sellers ar.
Law of supply and demand in Economy and management.
In economics, the relationship between the quantity of a commodity that producers wish to sell at various prices and the quantity that consumers wish to buy. It is the main model of price determination used in economic theory. The price of a commodity is determined by the interaction of supply and demand in a market. The resulting price is referred to as the equilibrium price and represents an agreement between producers and consumers of the good. In equilibrium, the quantity of a good supplied by producers equals the quantity demanded by consumers.
I am Elena Y. I am a Microeconomics Exam Helper at liveexamhelper.com. I hold a PhD in Economics, from Queen's University of Canada. I have been helping students with their exams for the past 5 years. You can hire me to take your exam on Microeconomics.
Visit liveexamhelper.com or email info@liveexamhelper.com.
You can also call on +1 678 648 4277 for any assistance with Microeconomics Exams.
Macro Economics
For downloading this contact- bikashkumar.bk100@gmail.com
Prepared by Students of University of Rajshahi
Arif Hossain
Md.Abdul Aual
Risul Islam
Abul Kalam
MD Rasel Mollah
MD Rabiul Islam
BYD SWOT Analysis and In-Depth Insights 2024.pptxmikemetalprod
Â
Indepth analysis of the BYD 2024
BYD (Build Your Dreams) is a Chinese automaker and battery manufacturer that has snowballed over the past two decades to become a significant player in electric vehicles and global clean energy technology.
This SWOT analysis examines BYD's strengths, weaknesses, opportunities, and threats as it competes in the fast-changing automotive and energy storage industries.
Founded in 1995 and headquartered in Shenzhen, BYD started as a battery company before expanding into automobiles in the early 2000s.
Initially manufacturing gasoline-powered vehicles, BYD focused on plug-in hybrid and fully electric vehicles, leveraging its expertise in battery technology.
Today, BYD is the worldâs largest electric vehicle manufacturer, delivering over 1.2 million electric cars globally. The company also produces electric buses, trucks, forklifts, and rail transit.
On the energy side, BYD is a major supplier of rechargeable batteries for cell phones, laptops, electric vehicles, and energy storage systems.
how to sell pi coins at high rate quickly.DOT TECH
Â
Where can I sell my pi coins at a high rate.
Pi is not launched yet on any exchange. But one can easily sell his or her pi coins to investors who want to hold pi till mainnet launch.
This means crypto whales want to hold pi. And you can get a good rate for selling pi to them. I will leave the telegram contact of my personal pi vendor below.
A vendor is someone who buys from a miner and resell it to a holder or crypto whale.
Here is the telegram contact of my vendor:
@Pi_vendor_247
where can I find a legit pi merchant onlineDOT TECH
Â
Yes. This is very easy what you need is a recommendation from someone who has successfully traded pi coins before with a merchant.
Who is a pi merchant?
A pi merchant is someone who buys pi network coins and resell them to Investors looking forward to hold thousands of pi coins before the open mainnet.
I will leave the telegram contact of my personal pi merchant to trade with
@Pi_vendor_247
Lecture slide titled Fraud Risk Mitigation, Webinar Lecture Delivered at the Society for West African Internal Audit Practitioners (SWAIAP) on Wednesday, November 8, 2023.
how can I sell pi coins after successfully completing KYCDOT TECH
Â
Pi coins is not launched yet in any exchange đą this means it's not swappable, the current pi displaying on coin market cap is the iou version of pi. And you can learn all about that on my previous post.
RIGHT NOW THE ONLY WAYÂ you can sell pi coins is through verified pi merchants. A pi merchant is someone who buys pi coins and resell them to exchanges and crypto whales. Looking forward to hold massive quantities of pi coins before the mainnet launch.
This is because pi network is not doing any pre-sale or ico offerings, the only way to get my coins is from buying from miners. So a merchant facilitates the transactions between the miners and these exchanges holding pi.
I and my friends has sold more than 6000 pi coins successfully with this method. I will be happy to share the contact of my personal pi merchant. The one i trade with, if you have your own merchant you can trade with them. For those who are new.
Message: @Pi_vendor_247 on telegram.
I wouldn't advise you selling all percentage of the pi coins. Leave at least a before so its a win win during open mainnet. Have a nice day pioneers âĽď¸
#kyc #mainnet #picoins #pi #sellpi #piwallet
#pinetwork
Even tho Pi network is not listed on any exchange yet.
Buying/Selling or investing in pi network coins is highly possible through the help of vendors. You can buy from vendors[ buy directly from the pi network miners and resell it]. I will leave the telegram contact of my personal vendor.
@Pi_vendor_247
Seminar: Gender Board Diversity through Ownership NetworksGRAPE
Â
Seminar on gender diversity spillovers through ownership networks at FAME|GRAPE. Presenting novel research. Studies in economics and management using econometrics methods.
If you are looking for a pi coin investor. Then look no further because I have the right one he is a pi vendor (he buy and resell to whales in China). I met him on a crypto conference and ever since I and my friends have sold more than 10k pi coins to him And he bought all and still want more. I will drop his telegram handle below just send him a message.
@Pi_vendor_247
Yes of course, you can easily start mining pi network coin today and sell to legit pi vendors in the United States.
Here the telegram contact of my personal vendor.
@Pi_vendor_247
#pi network #pi coins #legit #passive income
#US
Turin Startup Ecosystem 2024 - Ricerca sulle Startup e il Sistema dell'Innov...Quotidiano Piemontese
Â
Turin Startup Ecosystem 2024
Una ricerca de il Club degli Investitori, in collaborazione con ToTeM Torino Tech Map e con il supporto della ESCP Business School e di Growth Capital
how can i use my minded pi coins I need some funds.DOT TECH
Â
If you are interested in selling your pi coins, i have a verified pi merchant, who buys pi coins and resell them to exchanges looking forward to hold till mainnet launch.
Because the core team has announced that pi network will not be doing any pre-sale. The only way exchanges like huobi, bitmart and hotbit can get pi is by buying from miners.
Now a merchant stands in between these exchanges and the miners. As a link to make transactions smooth. Because right now in the enclosed mainnet you can't sell pi coins your self. You need the help of a merchant,
i will leave the telegram contact of my personal pi merchant below. đ I and my friends has traded more than 3000pi coins with him successfully.
@Pi_vendor_247
what is the best method to sell pi coins in 2024DOT TECH
Â
The best way to sell your pi coins safely is trading with an exchange..but since pi is not launched in any exchange, and second option is through a VERIFIED pi merchant.
Who is a pi merchant?
A pi merchant is someone who buys pi coins from miners and pioneers and resell them to Investors looking forward to hold massive amounts before mainnet launch in 2026.
I will leave the telegram contact of my personal pi merchant to trade pi coins with.
@Pi_vendor_247
Falcon stands out as a top-tier P2P Invoice Discounting platform in India, bridging esteemed blue-chip companies and eager investors. Our goal is to transform the investment landscape in India by establishing a comprehensive destination for borrowers and investors with diverse profiles and needs, all while minimizing risk. What sets Falcon apart is the elimination of intermediaries such as commercial banks and depository institutions, allowing investors to enjoy higher yields.
Explain the difference between microeconomics and macroeconomics
1. 1.1. Explain the difference between microeconomics and macroeconomics?
Economics is a subject who talks about distribute, people and consumption .Our want is endless.
But we do not have enough resources .We have to use our limited resources in an efficient way.
That is called efficient situation. Economics traditionally deals with 2 branches:
1) Microeconomics.
2) Macroeconomics
There are some difference between Microeconomics and Macroeconomics:
Microeconomics:
⢠âMicroâ comes from the word âmicrorâ which means small.
⢠It talks about individual from person
⢠It is concerned with the behavior of individual markets and households.
⢠The study of microeconomics mainly deals with demand, supply, elatisity, cost and others.
⢠Microeconomics deals with the activities of individual units within the economy: firms,
industries, consumers, workers, etc. Because resources are scarce, people have to make
choices. Society has to choose by some means or other what goods and services to
produce, how to produce them and for whom to produce them. Microeconomics studies
these choices.
Macroeconomics:
⢠âMacroâ comes from the word âMacrorâwhich means big.
⢠It views the performance of the economy as a whole.
⢠The study of macroeconomics talks about monetary & fiscal policy, Gdp,gnp and NNp of a
country as a whole.
⢠Macroeconomics deals with aggregates such as the overall levels of unemployment,
output, growth and prices in the economy.
2. 1.2. Explain the problems of scarcity and opportunity cost and how these concepts are related, using
numerical examples and/or a production possibility frontier
The central economic problem is scarcity. There is a limited supply of factors of production
(labor, land and capital), but it is impossible to provide everybody with everything they want.
Potential demands exceed potential supplies. This is called the problems of scarcity. Countries
cannot have unlimited amounts of all goods. They are limited by the resources and the
technologies available to them.
Life is full of choices because, of the scarcity of resources. The cost of the forgone alternative is
the opportunity cost of the decision. On the other hand, opportunity cost represents a cost of a
decision which is the value of the good or service forgone.
The scarcity problems and the concept of opportunity cost can be illustrated using the production
possibility frontier.
Production possibility frontier: ppf shows the maximum amount of production that can be
obtained by an economy, given its technological knowledge and quantity of inputs available. The
ppf represents the menu of goods and services available to the society. It shows the tradeoff
between car and truck.
Alternative production possibilities:
Possibilities Car(5) Truck(10)
A 20 0
B 10 5
C 0 10
This data is showing us output which represents One possible combination of output When we
use all our resources. In possibilities A, B, C we can produce 20,10,0 cars and 0, 5, 10.So, car
production is reducing and truck production is increasing. So, this data is showing us Maximum
resources.
F
Y
20
A
15
10
5
3. 1 2 3 4 5 6 7 8 9 10 c x
Production possibility frontier shows us that the vertical line of y represents car and horizontal x
shows number of truck. When the car number is 20 it shows the trade off ratio where ppf shows
the tradeoff between car and truck where we can produce anything. . B point is tangent in ppf
where it shows the efficient situation between car and truck at B point. C point repents the ppf
curve. Where, we can produce anything.
At F point, Points outside the ppf are unattainable. Points inside it are inefficient since resources
are not being fully employed. All of this line is called efficient line. Because some resources is
left. We can produce anything .That is called production possibility frontier.
1.3. Compare, using real world examples, the relative merits of alternative economic arrangements for
overcoming the problem of scarcity in society?
Different societies are organized through the relative alternative economic systems and economic
studies the various mechanisms that a society can use to allocate its scarce resources. We generally
distinguish 2 fundamentally different ways of organizing an economy. But there are 3 ways to
improve our economy:
1) Market economy
2) Command economy
3) Mixed economy
1) Market economy: A market economy is one in which inviduals and private firms make the
major decisions about production and consumption. I market economy; people select what
should be done. It is also similar to democracy. It also talks about the laissez-faire economy
where the go keeps its hands off economic decisions.
2) Command economy: A command economic system is one in which the gov makes all the
important decisions about production and distribution. Ex: during 12th
century Soviet Union
had command economy.
3) Mixed economy: A mixed economy is one in which the element of gov control are
intermingled with market elements in organizing production and consumption ex: in our
present situation, we have mixed economy.
4. Therefore all societies have different combinations of command and market but all
societies arte mixed economics. So, these are the real examples of the relative alternative
economic arrangements of overcoming scarcity resources.
2.1. Explain, in words and with diagrams, the concept of equilibrium in a supply and demand model
and illustrate the effects on equilibrium price and quantity of changes in market conditions.
The Determination of Price and Quantity
The logic of the model of demand and supply is simple. The demand curve shows the quantities
of a particular good or service that buyers will b e willing and able to purchase at each price
during a specified period. The supply curve shows the quantities that sellers will offer for sale at
each price during that same period. By putting the two curves together, we should be able to find
a price at which the quantity buyers are willing and able to purchase equals the quantity sellers
will offer for sale.
Figure 3.14, âThe Determination of Equilibrium Price and Quantityâ combines the demand and
supply data introduced in Figure 3.1, âA Demand Schedule and a Demand Curveâ and
Figure 3.8, âA Supply Schedule and a Supply Curveâ Notice that the two curves intersect at a
price of $6 per poundâat this price the quantities demanded and supplied are equal. Buyers want
to purchase, and sellers are willing to offer for sale, 25 million pounds of coffee per month. The
market for coffee is in equilibrium. Unless the demand or supply curve shifts, there will be no
tendency for price to change. The equilibrium price in any market is the price at which quantity
demanded equals quantity supplied. The equilibrium price in the market for coffee is thus $6 per
pound. The equilibrium quantity is the quantity demanded and supplied at the equilibrium price.
Figure 3.14. The Determination of Equilibrium Price and Quantity
5. When we combine the demand and supply curves for a good in a single graph, the point at which
they intersect identifies the equilibrium price and equilibrium quantity. Here, the equilibrium
price is $6 per pound. Consumers demand, and suppliers supply, 25 million pounds of coffee per
month at this price.
With an upward-sloping supply curve and a downward-sloping demand curve, there is only a
single price at which the two curves intersect. This means there is only one price at which
equilibrium is achieved. It follows that at any price other than the equilibrium price, the market
will not be in equilibrium. We next examine what happens at prices other than the equilibrium
price.
Surpluses
Figure 3.15, âA Surplus in the Market for Coffeeâ shows the same demand and supply curves we
have just examined, but this time the initial price is $8 per pound of coffee. Because we no
longer have a balance between quantity demanded and quantity supplied, this price is not the
equilibrium price. At a price of $8, we read over to the demand curve to determine the quantity
of coffee consumers will be willing to buyâ15 million pounds per month. The supply curve tells
us what sellers will offer for saleâ35 million pounds per month. The difference, 20 million
pounds of coffee per month, is called a surplus. More generally, a surplus is the amount by which
the quantity supplied exceeds the quantity demanded at the current price. There is, of course, no
surplus at the equilibrium price; a surplus occurs only if the current price exceeds the equilibrium
price.
6. Shifts in Demand and Supply in eq in market conditions:
Figure 3.17. Changes in Demand and Supply
A change in demand or in supply changes the equilibrium solution in the model. Panels (a) and
(b) show an increase and a decrease in demand, respectively; Panels (c) and (d) show an increase
and a decrease in supply, respectively.
A change in one of the variables (shifters) held constant in any model of demand and supply will
create a change in demand or supply. A shift in a demand or supply curve changes the
equilibrium price and equilibrium quantity for a good or service. Figure 3.17, âChanges in
Demand and Supplyâ combines the information about changes in the demand and supply of
coffee presented in Figure 3.2, âAn Increase in Demandâ Figure 3.3, âA Reduction in Demandâ
Figure 3.9, âAn Increase in Supplyâ and Figure 3.10, âA Reduction in Supplyâ In each case, the
original equilibrium price is $6 per pound, and the corresponding equilibrium quantity is 25
million pounds of coffee per month. Figure 3.17, âChanges in Demand and Supplyâ shows what
happens with an increase in demand, a reduction in demand, an increase in supply, and a
reduction in supply. We then look at what happens if both curves shift simultaneously. Each of
these possibilities is discussed in turn below.
An Increase in Demand
7. An increase in demand for coffee shifts the demand curve to the right, as shown in Panel (a) of
Figure 3.17, âChanges in Demand and Supplyâ. The equilibrium price rises to $7 per pound. As
the price rises to the new equilibrium level, the quantity supplied increases to 30 million pounds
of coffee per month. Notice that the supply curve does not shift; rather, there is a movement
along the supply curve.
Demand shifters that could cause an increase in demand include a shift in preferences that leads
to greater coffee consumption; a lower price for a complement to coffee, such as doughnuts; a
higher price for a substitute for coffee, such as tea; an increase in income; and an increase in
population. A change in buyer expectations, perhaps due to predictions of bad weather lowering
expected yields on coffee plants and increasing future coffee prices, could also increase current
demand.
A Decrease in Demand
Panel (b) of Figure 3.17, âChanges in Demand and Supplyâ shows that a decrease in demand
shifts the demand curve to the left. The equilibrium price falls to $5 per pound. As the price falls
to the new equilibrium level, the quantity supplied decreases to 20 million pounds of coffee per
month.
Demand shifters that could reduce the demand for coffee include a shift in preferences that
makes people want to consume less coffee; an increase in the price of a complement, such as
doughnuts; a reduction in the price of a substitute, such as tea; a reduction in income; a reduction
in population; and a change in buyer expectations that leads people to expect lower prices for
coffee in the future.
An Increase in Supply
An increase in the supply of coffee shifts the supply curve to the right, as shown in Panel (c) of
Figure 3.17, âChanges in Demand and Supplyâ. The equilibrium price falls to $5 per pound. As
the price falls to the new equilibrium level, the quantity of coffee demanded increases to 30
million pounds of coffee per month. Notice that the demand curve does not shift; rather, there is
movement along the demand curve.
Possible supply shifters that could increase supply include a reduction in the price of an input
such as labor, a decline in the returns available from alternative uses of the inputs that produce
coffee, an improvement in the technology of coffee production, good weather, and an increase in
the number of coffee-producing firms.
A Decrease in Supply
Panel (d) of Figure 3.17, âChanges in Demand and Supplyâ shows that a decrease in supply
shifts the supply curve to the left. The equilibrium price rises to $7 per pound. As the price rises
to the new equilibrium level, the quantity demanded decreases to 20 million pounds of coffee per
month.
8. Possible supply shifters that could reduce supply include an increase in the prices of inputs used
in the production of coffee, an increase in the returns available from alternative uses of these
inputs, a decline in production because of problems in technology (perhaps caused by a
restriction on pesticides used to protect coffee beans), a reduction in the number of coffee-
producing firms, or a natural event, such as excessive rain.
2.2. Examine, using appropriate supply and demand diagrams, the effects of taxes and subsidies and the
effects of price ceilings and price floors on market price and quantity traded?
Taxes reduce both demand and supply, and drive market equilibrium to a price that is higher than
without the tax and a quantity that is lower than without the tax.
Actual and Statutory Incidence of Tax
Tax authorities usually require either the buyer or the seller to be legally responsible for payment
of the tax. Tax incidence is the way in which the burden of a tax is shared among the market
participants (âwho bears the cost?â). Taxes will typically constitute a greater burden for
whichever party has a more inelastic curve â e.g., if supply is inelastic and demand is elastic, the
burden will be greater on the producers.
Suppose that a state government imposes a tax upon milk producers of $1 per gallon.
Figure 3.7: Incidence of Tax
Figure 3.7 shows the original price for milk was $2 per gallon. After imposition of the tax, the
supply curves shift up and to the left. Consumers pay $2.60 per gallon. Sellers receive $1.60 per
gallon after paying the tax. So sixty cents of the tax is actually paid by consumers, while forty
cents is paid by the milk producers.
The triangle ABC above represents the deadweight loss due to taxation, which occurs because
now there are fewer mutually beneficial exchanges between buyers and sellers. Deadweight loss
9. stems from foregone economic activity and is a loss that does not lead to an offsetting gain for
other market participants; it is a permanent decrease to consumer and/or producer surplus.
Elasticity of Supply and Demand and the Incidence of Tax
If buyers have many alternatives to a good with a new tax, they will tend to respond to a rise in
price by buying other things and will, therefore, not accept a much higher price. If sellers easily
can switch to producing other goods, or if they will respond to even a small reduction in
payments by going out of business, then they will not accept a much lower price. The incidence
of the tax will tend to fall on the side of the market that has the least attractive alternatives and,
therefore, has a lower elasticity.
Cigarettes are one example where buyers have relatively few options; we would therefore expect
the primary burden of cigarette taxes to fall upon the buyers.
A subsidy shifts either the demand or supply curve to the right, depending upon whether the
buyer or seller receives the subsidy. If it is the buyer receiving the subsidy, the demand curve
shifts right, leading to an increase in the quantity demanded and the equilibrium price. If the
seller receives the subsidy, the supply curve shifts right and the quantity demanded will increase,
while the equilibrium price decreases.
A quota limits the amounts of a good that can be produced. If the quota is greater than what
would be produced under normal market conditions, then it will have no effect. If the amount is
less, than the market equilibrium that is achieved will be at a higher price than what would occur
without the quota, as consumers will be willing to pay more.
Making a good or service illegally impacts demand, supply and market equilibrium by imposing
a cost (prosecution and punishment) on the buyer or seller (or both) of the good/service.
Quantities of illegal goods will always be less than if they were legal, but the impact on price is
determined by whether the buyer or seller (or both) is punished. If the only the buyer is
penalized, the equilibrium price will be lower; the risk of punishment is regarded by buyers as a
cost, and reduces the price they will pay to the seller. If the seller is penalized, the equilibrium
price will be higher as the cost of punishment is factored into the sellerâs cost. Prices will remain
relatively unchanged if the risk and cost of punishment is shared equally.
2.3. Identify examples of positive and negative externalities and, using supply and demand analysis,
demonstrate the effects of these externalities on the market equilibrium?
Economics studies two forms of externalities. An externality is something that, while it does not
monetarily affect the producer of a good, does influence the standard of living of society as a
whole.
A positive externality is something that benefits society, but in such a way that the producer
cannot fully profit from the gains made. A negative externality is something that costs the
producer nothing, but is costly to society in general.
10. Examples of positive externalities are environmental clean-up and research. A cleaner
environment certainly benefits society, but does not increase profits for the company responsible
for it. Likewise, research and new technological developments create gains on which the
company responsible for them cannot fully capitalize.
Negative externalities, unfortunately, are much more common. Pollution is a very common
negative externality. A company that pollutes loses no money in doing so, but society must pay
heavily to take care of the problem pollution caused.
The problem this creates is that companies do not fully measure the economic costs of their
actions. They do not have to subtract these costs from their revenues, which means that profits
inaccurately portray the company's actions as positive. This can lead to inefficiency in the
allocation of resources.
Because neither the market nor private individuals can be counted on to prevent this inefficiency
in the economy, the government must intervene. Ex:
b. The slope of Joe's demand curve for coffee in the price range of $5 and $4 is:
(5-4)/(2-4) = -1/2
c. In the price range of $2 and $1 it is: (2-1)/(8-10) = -1/2
d. The price of coffee and Joe's quantity demanded of coffee are negatively correlated. We can
tell this because we have a downward sloping line (or the slope is negative, or as price rises,
quantity falls).
e. If the price of coffee moves from $2 per cup to $4 per cup, the quantity demanded will fall
from 8 cups to 4 cups. This is a movement along the demand curve.
f. If Joe's income doubles from $20,000 to $40,000 per year, his demand curve shifts out, as
shown by the dark line in the graph above.
g. The doubling of Joe's income causes a shift in his demand curve, because income changed--
and income is not a variable which is measured on either axis.
11. 3.1. Define, measure and interpret: price elasticity of demand; price elasticity of supply; income
elasticity of demand and cross price elasticity of demand?
Price elasticity of demand : A measure of the responsiveness of the quantity demanded of a good to
a change in its price. It is calculated as:
Measure:
Price elasticity of demand (PED or Ed) is a measure used in economics to show the
responsiveness, or elasticity, of the quantity demanded of a good or service to a change in its
price. More precisely, it gives the percentage change in quantity demanded in response to a one
percent change in price (holding constant all the other determinants of demand, such as income).
It was devised by Alfred Marshall.
Price elasticityâs are almost always negative, although analysts tend to ignore the sign even
though this can lead to ambiguity. Only goods which do not conform to the law of demand, such
as Veblen and Giffen goods, have a positive PED. In general, the demand for a good is said to be
inelastic (or relatively inelastic) when the PED is less than one (in absolute value): that is,
changes in price have a relatively small effect on the quantity of the good demanded. The
demand for a good is said to be elastic (or relatively elastic) when its PED is greater than one (in
absolute value): that is, changes in price have a relatively large effect on the quantity of a good
demanded.
Revenue is maximized when price is set so that the PED is exactly one. The PED of a good can
also be used to predict the incidence (or "burden") of a tax on that good. Various research
methods are used to determine price elasticity, including test markets, analysis of historical sales
data and conjoint analysis.
Interpret the Price Elasticity of Demand
The demand for a good is to a price change. The higher the price elasticity, the more sensitive
consumers are to price changes. Very high price elasticity suggests that when the price of a good goes
up, consumers will buy a great deal less of it and when the price of that good goes down, consumers will
buy a great deal more. Very low price elasticity implies just the opposite, that changes in price have little
influence on demand.
⢠If PEod> 1 then Demand is Price Elastic (Demand is sensitive to price changes)
⢠If PEod = 1 then Demand is Unit Elastic
12. ⢠If PEod < 1 then Demand is Price Inelastic (Demand is not sensitive to price changes)
analyzing price elasticity, so PEod is always negative..
Price elasticity of supply: Price elasticity of supply (PES or Es) is a measure used in
economics to show the responsiveness, or elasticity, of the quantity supplied of a good or service
to a change in its price.
When the coefficient is less than one, the good can be described as inelastic; when the
coefficient is greater than one, the supply can be described as elastic. An elasticity of zero
indicates that quantity supplied does not respond to a price change: it is "fixed" in supply. Such
goods often have no labor component or are not produced, limiting the short run prospects of
expansion. If the coefficient is exactly one, the good is said to be unitary elastic.
The quantity of goods supplied can, in the short term, be different from the amount produced, as
manufacturers will have stocks which they can build up or run down.
Interpret the Price Elasticity of Supply
The price elasticity of supply is used to see how sensitive the supply of a good is to a price change. The
higher the price elasticity, the more sensitive producers and sellers are to price changes. A very high
price elasticity suggests that when the price of a good goes up, sellers will supply a great deal less of the
good and when the price of that good goes down, sellers will supply a great deal more. A very low price
elasticity implies just the opposite, that changes in price have little influence on supply.
⢠If PEoS > 1 then Supply is Price Elastic (Supply is sensitive to price changes)
⢠If PEoS = 1 then Supply is Unit Elastic
⢠If PEoS < 1 then Supply is Price Inelastic (Supply is not sensitive to price changes)
analyzing price elasticity, so pEod is always positive.
Income elasticity of demand: In economics, income elasticity of demand measures the
responsiveness of the demand for a good to a change in the income of the people demanding the
good, ceteris paribus. It is calculated as the ratio of the percentage change in demand to the
percentage change in income. For example, if, in response to a 10% increase in income, the
demand for a good increased by 20%, the income elasticity of demand would be 20%/10% = 2.
he Income Elasticity of Demand measures the rate of response of quantity demand due to a raise
(or lowering) in a consumers income. The formula for the Income Elasticity of Demand (IEoD)
is given by:
IEoD = (% Change in Quantity Demanded)/(% Change in Income)
13. Interpret the Income Elasticity of Demand
Income elasticity of demand is used to see how sensitive the demand for a good is to an income change.
The higher the income elasticity, the more sensitive demand for a good is to income changes. A very
high income elasticity suggests that when a consumer's income goes up, consumers will buy a great deal
more of that good. A very low price elasticity implies just the opposite, that changes in a consumer's
income has little influence on demand.
⢠If IEoD > 1 then the good is a Luxury Good and Income Elastic
⢠If IEoD < 1 and IEOD > 0 then the good is a Normal Good and Income Inelastic
⢠If IEoD < 0 then the good is an Inferior Good and Negative Income Inelastic
In our case, we calculated the income elasticity of demand to be 0.8 so our good is income
inelastic and a normal good and thus demand is not very sensitive to income changes.
Cross -price elasticity of demand:
Cross -price elasticity of demand measures the responsiveness of the demand for a good to a
change in the price of another good. It is measured as the percentage change in demand for the
first good that occurs in response to a percentage change in price of the second good. For
example, if, in response to a 10% increase in the price of fuel, the demand of new cars that are
fuel inefficient decreased by 20%, the cross elasticity of demand would be: . A
negative cross elasticity denotes two products that are complements, while a positive cross
elasticity denotes two substitute products. These two key relationships go against one's
intuition, but the reason behind them is fairly simple: assume products A and B are
complements, meaning that an increase in the demand for A is caused by an increase in the
quantity demanded for B. Therefore, if the price of product B decreases, then the demand curve
for product A shifts to the right, increasing A's demand, resulting in a negative value for the
cross elasticity of demand. The exact opposite reasoning holds for substitutes.
Interpret the Cross-Price Elasticity of Demand
The cross-price elasticity of demand is used to see how sensitive the demand for a good is to a price
change of another good. A high positive cross-price elasticity tells us that if the price of one good goes
up, the demand for the other good goes up as well. A negative tells us just the opposite, that an increase
in the price of one good causes a drop in the demand for the other good. A small value (either negative
or positive) tells us that there is little relation between the two goods.
⢠If CPEoD > 0 then the two goods are substitutes
⢠If CPEoD =0 then the two goods are independent (no relationship between the two goods
⢠If CPEoD < 0 then the two goods are complements.
3.2. Explain, using diagrams and different concepts of demand elasticities, what is meant by each of the
following; normal goods; inferior goods; complements and substitutes.
14. Normal goods: in economics, normal goods are any goods for which demand increases when
income increases and falls when income decreases but price remains constant, i.e. with a positive
income elasticity of demand. The term does not necessarily refer to the quality of the good, but
an abnormal good would clearly not be in demand, except for possibly lower socioeconomic
groups.
Examples include Holidays, Cars, diamonds, branded fashions, hi-tech products etc.
Depending on the indifference curves, the amount of a good bought can increase, decrease, or
stay the same when income increases. In the diagram below, good Y is a normal good since the
amount purchased increases from Y1 to Y2 as the budget constraint shifts from BC1 to the
higher income BC2. Good X is an inferior good since the amount bought decreases from X1 to
X2 as income increases.
Inferior goods: an inferior good is a good that decreases in demand when consumer income rises,
unlike normal goods, for which the opposite is observed. This would be the opposite of a
superior good, one that is often associated with wealth and the wealthy, whereas an inferior good
is often associated with lower socio-economic groups.
Inferiority, in this sense, is an observable fact relating to affordability rather than a statement
about the quality of the good. As a rule, these goods are affordable and adequately fulfill their
purpose, but as more costly substitutes that offer more pleasure (or at least variety) become
available, the use of the inferior goods diminishes.
Depending on consumer or market indifference curves, the amount of a good bought can
increase, decrease, or stay the same when income increases.
Ex: Inexpensive foods like hamburger, frozen dinners, and canned goods are additional examples
of inferior goods.
15. Depending on the indifference curves, the amount of a good bought can increase, decrease, or
stay the same when income increases. In the diagram below, good Y is a normal good since the
amount purchased increases from Y1 to Y2 as the budget constraint shifts from BC1 to the
higher income BC2. Good X is an inferior good since the amount bought decreases from X1 to
X2 as income increases.
Compliment goods:
A complementary good is a good with a negative cross elasticity of demand, in contrast to a
substitute good. This means a good's demand is increased when the price of another
good is decreased. The demand for a good is decreased when the price of another good
is increased..
Ex: DVD players and DVDs, Computer hardware and computer software
A
16. B
Complementary goods exhibit a negative cross elasticity of demand: as the price of good Y rises, the
demand for good X falls. If goods A and B are complements, an increase in the price of A will
result in a leftward movement along the demand curve of A and cause the demand curve for B
to shift in; less of each good will be demanded. A decrease in price of A will result in a rightward
movement along the demand curve of A and cause the demand curve B to shift outward; more
of each good will be demanded
Substitute goods:
A substitute good, in contrast to a complementary good, is a good with a positive cross elasticity of
demand. This means a good's demand is increased when the price of another good is increased. The
demand for a good is decreased when the price of another good is decreased. Ex: margarine, butter.
17. If goods A and B are substitutes, an increase in the price of A will result in a leftward movement along
the demand curve of A and cause the demand curve for B to shift out. A decrease in the price of A will
result in a rightward movement along the demand curve of A and cause the demand curve for B to shift
in.
3.2. Examine the use of the concepts of elasticity by firms to analyze and evaluate market changes?
Marketers should never rest on their marketing decisions. They must continually use market
research and their own judgment to determine whether marketing decisions need to be adjusted.
When it comes to adjusting price, the marketer must understand what effect a change in price is
likely to have on target market demand for a product.
Understanding how price changes impact the market requires the marketer have a firm
understanding of the concept economists call elasticity of demand, which relates to how purchase
quantity changes as prices change. Elasticity is evaluated under the assumption that no other
changes are being made (i.e., âall things being equalâ) and only price is adjusted. The logic is to
see how price by itself will affect overall demand. Obviously, the chance of nothing else
changing in the market but the price of one product is often unrealistic. For example, competitors
may react to the marketerâs price change by changing the price on their product. Despite this,
elasticity analysis does serve as a useful tool for estimating market reaction.
Elasticity deals with three types of demand scenarios:
⢠Elastic Demand â Products are considered to exist in a market that exhibits elastic
demand when a certain percentage change in price results in a larger and opposite
percentage change in demand. For example, if the price of a product increases (decreases)
by 10%, the demand for the product is likely to decline (rise) by greater than 10%.
⢠Inelastic Demand â Products are considered to exist in an inelastic market when a certain
percentage change in price results in a smaller and opposite percentage change in
demand. For example, if the price of a product increases (decreases) by 10%, the demand
for the product is likely to decline (rise) by less than 10%.
⢠Unitary Demand â This demand occurs when a percentage change in price results in an
equal and opposite percentage change in demand. For example, if the price of a product
increases (decreases) by 10%, the demand for the product is likely to decline (rise) by
10%.
For marketers the important issue with elasticity of demand is to understand how it impacts
company revenue. In general the following scenarios apply to making price changes for a given
type of market demand:
⢠For elastic markets â increasing price lowers total revenue while decreasing price
increases total revenue.
18. ⢠For inelastic markets â increasing price raises total revenue while decreasing price lowers
total revenue.
⢠For unitary markets â there is no change in revenue when price is changed.