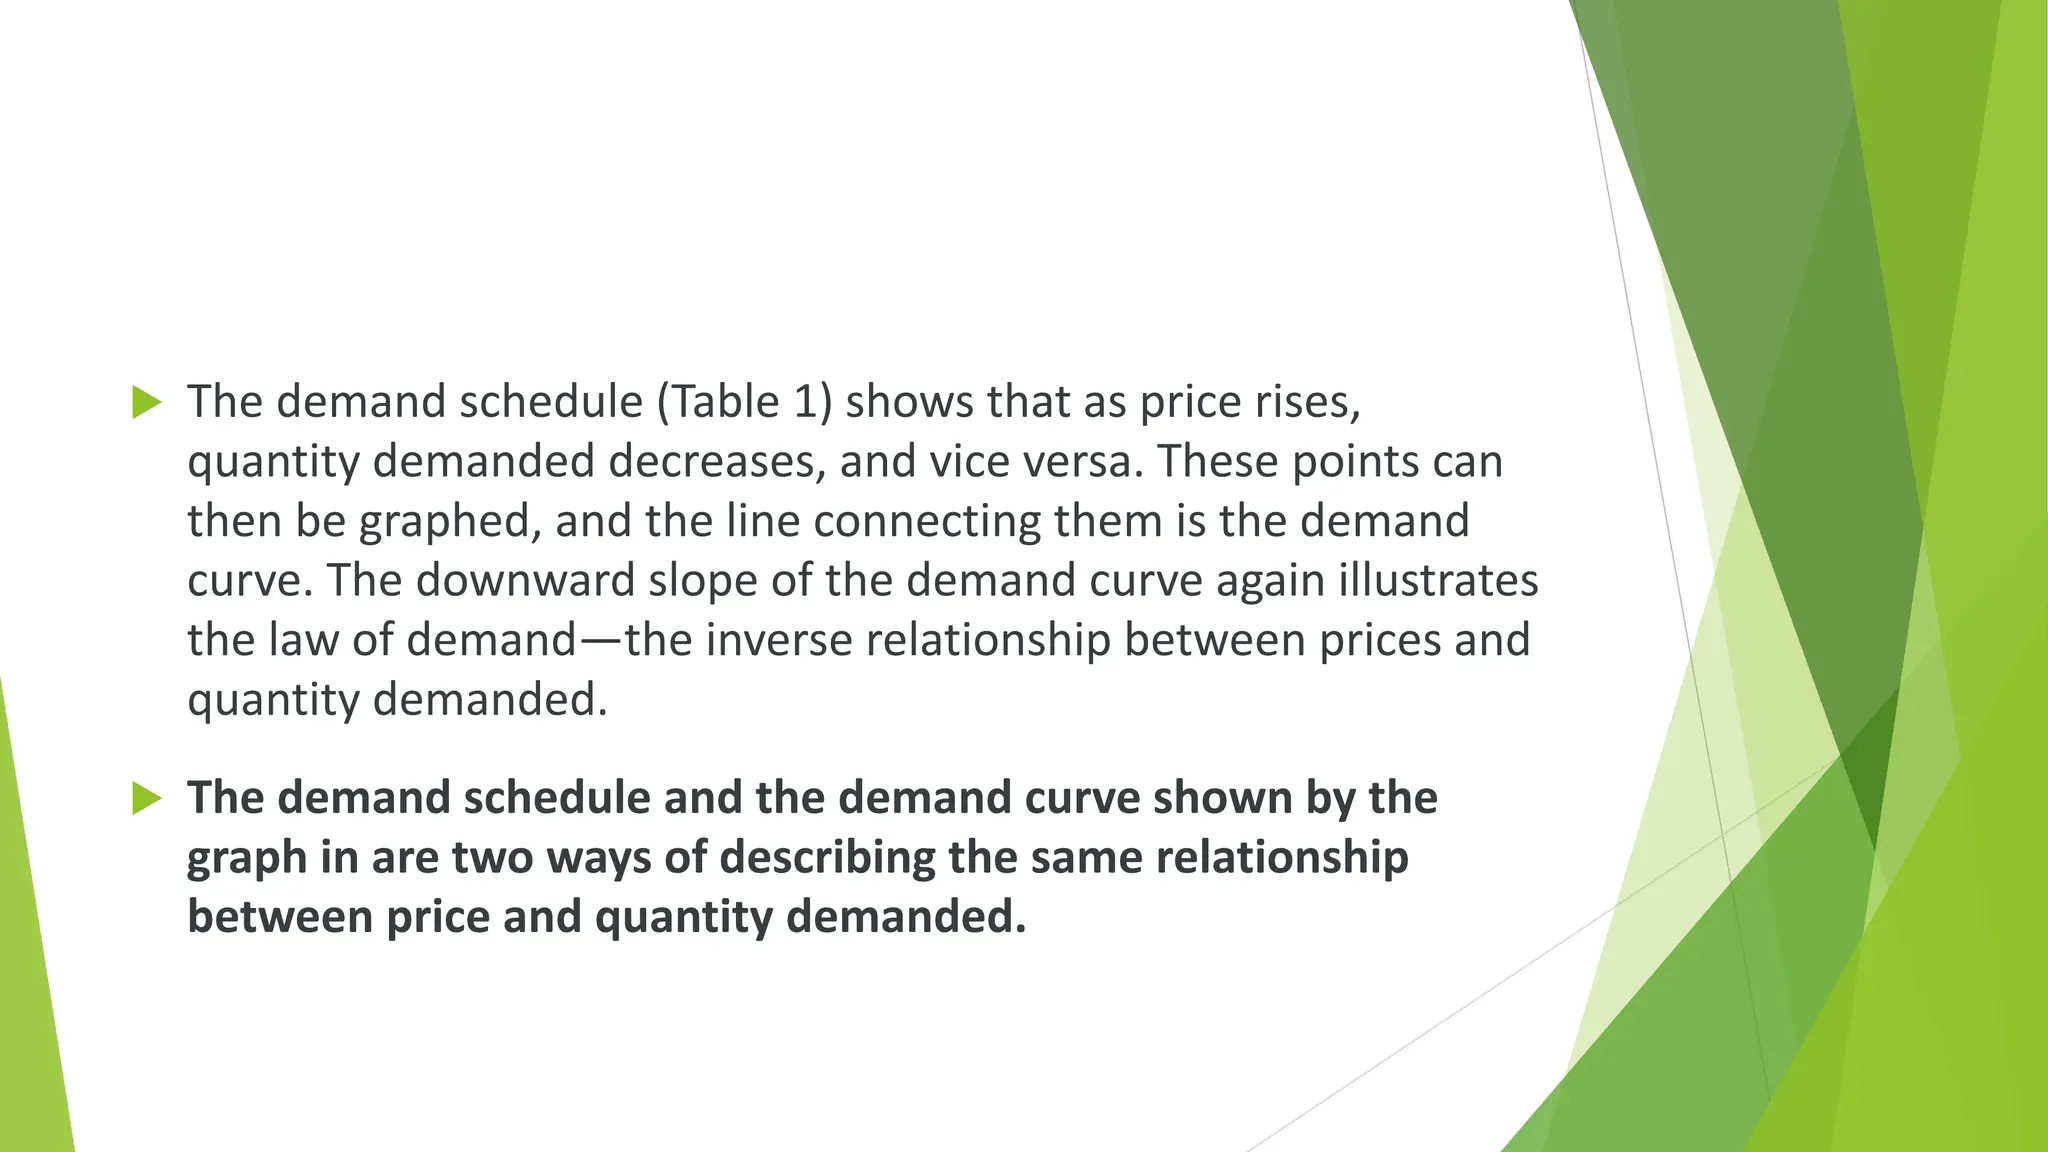
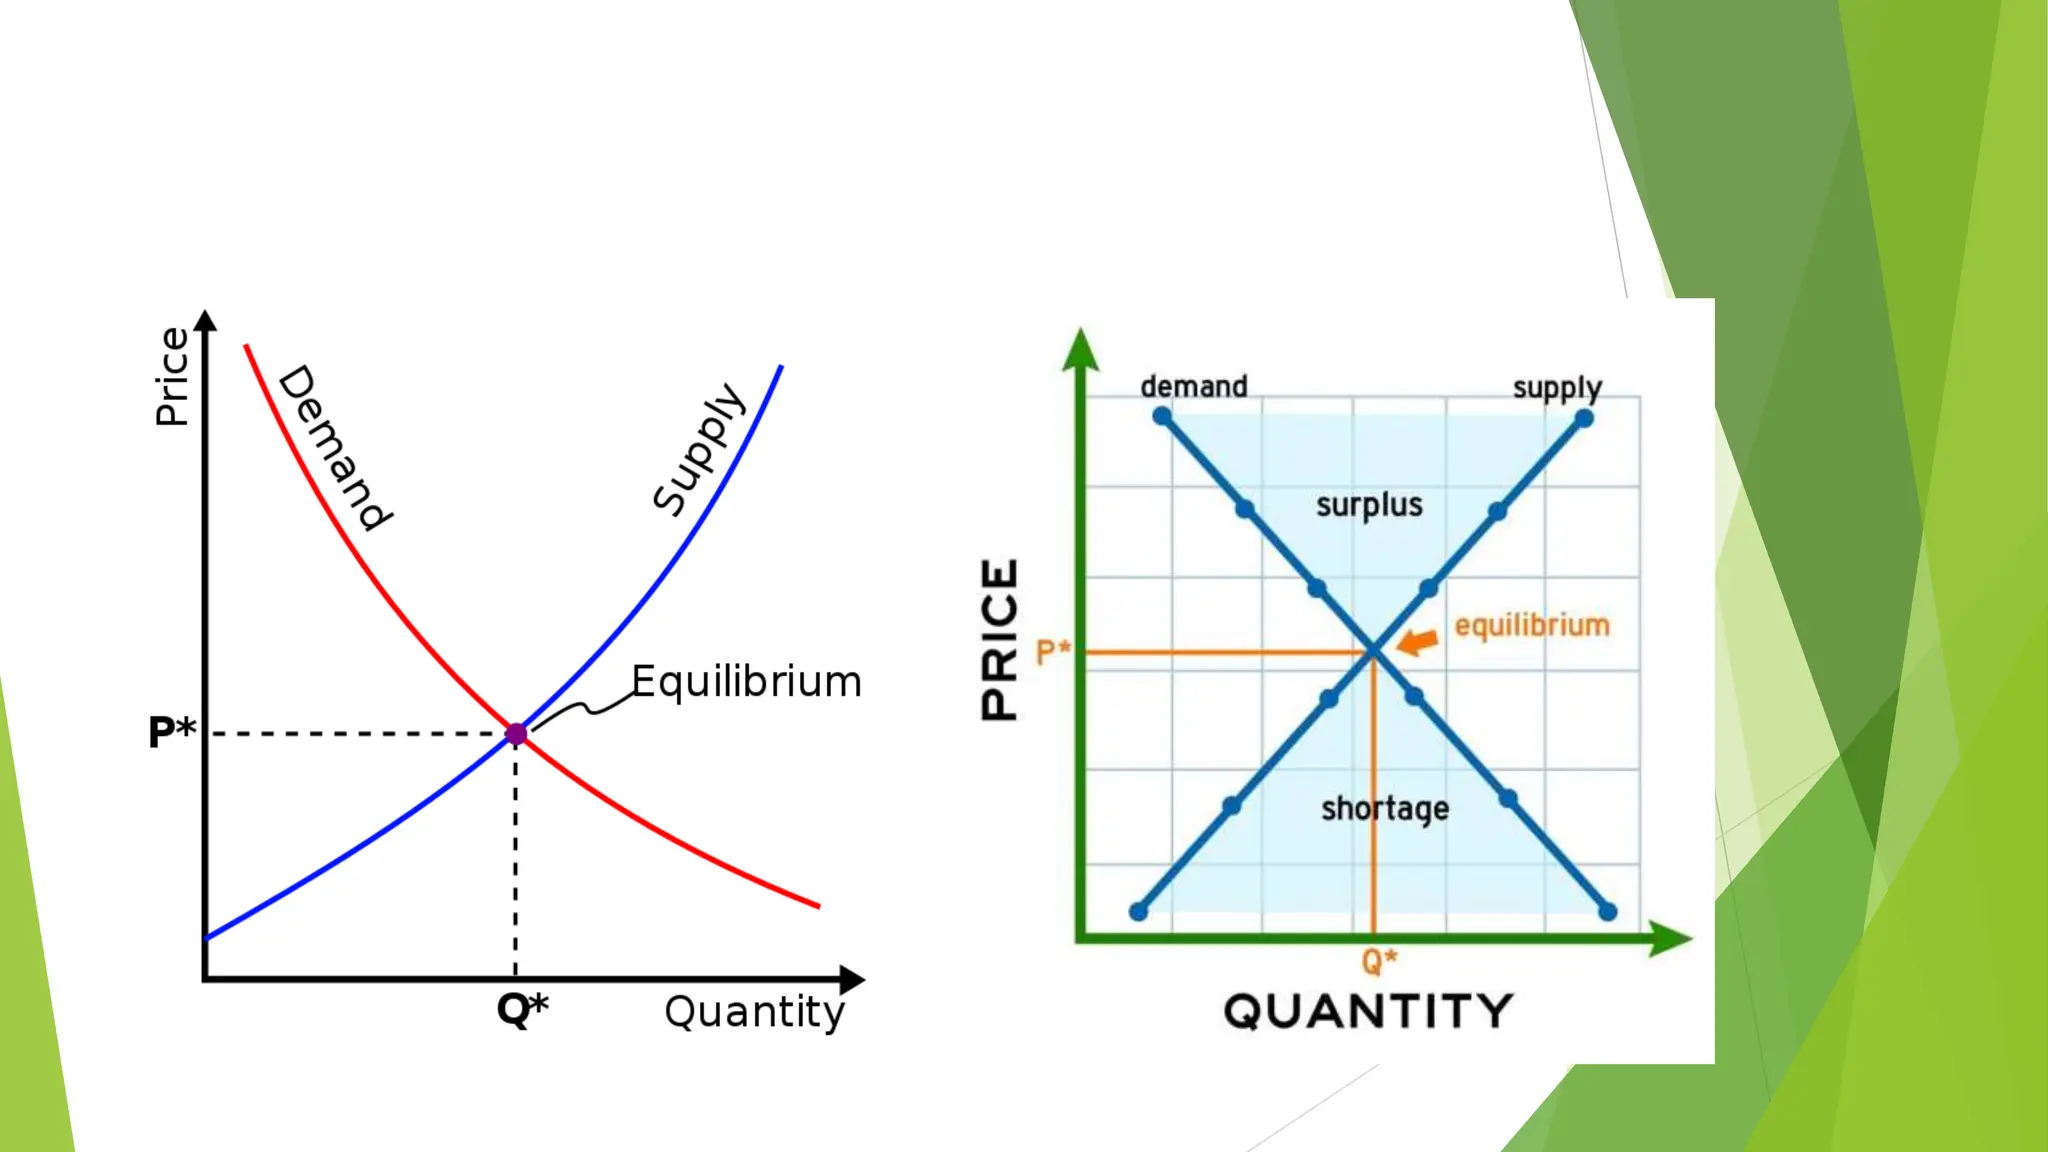
SlideShare a Scribd company logo
1 of 45
BASIC
ECONOMICS
By Precious Chanaiwa
Course Content
 Study unit 1: What is economics
 Study unit 2: Industry and commerce
 Study unit 3: Productivity and pay
 Study unit 4: Time and risk
 Study unit 5: National income
 Study unit 6: International trade
Assessment
 Test 10%
 Assignment 40%
 Examination 50%
WHAT IS
ECONOMICS?
Objectives
By the end of this lesson, students should be able to:
 Allocation of scarce resources
 How Prices Allocate Resources
 Supply and Demand
 What happens with artificial prices?
 Myths about Prices
Introduction
 Economics is the study of how humans make decisions in the face of scarcity.
 Economics is the social science that studies the choices that individuals, businesses,
governments and entire societies make as they cope with scarcity and the incentives
that influence and reconcile those choices.
 The subject divides into two main parts:
 Microeconomics-is the study of the choices that individuals and businesses make, the
way these choices interact in markets and the influence of governments.
 Macroeconomics- is the study of the performance of the national economy and the
global economy. E.g. unemployment , unemployment etc.
Allocation of Scarce Resources
 A fundamental fact dominates our lives: we want
more than we can get. Our inability to get everything
we want is called scarcity.
 Scarcity means that human wants for goods, services
and resources exceed what is available. Scarcity is
universal. It confronts all living things.
 Resources, such as labour, tools, land, and raw
materials are necessary to produce the goods and
services we want but they exist in limited supply.
 Time is the ultimate scarce resource, as we have only twenty-four hours in a
day to complete what we have to.
 Every society, at every level, must make choices about how to use its resources.
Families must decide whether to spend their money on a new car or a fancy vacation.
Towns must choose whether to put more of the budget into police and fire protection
or into the school system. Nations must decide whether to devote more funds to
national defense or to protecting the environment. In most cases, there just isn’t
enough money in the budget to do everything.
 Because we cant get everything we want, we must make choices. Incentives
reconciles choices.
 An incentive is a reward that encourages or a penalty that discourages an
action.
Supply and Demand
 A market is any arrangement that enables buyers and sellers to get
information and do business with each other.
 A market has two sides: buyers and sellers.
 Markets vary in the intensity of competition that buyers and sellers face. For
this discussion we are going to focus on competitive markets-a market that
has many buyers and many sellers, so no single buyer or seller can influence
the price.
Demand for goods and services
 Economists use the term demand to refer to the amount of some good
or service consumers are willing and able to purchase at each price.
 Demand is based on needs and wants—a consumer may be able to
differentiate between a need and a want, but from an economist’s
perspective, they are the same thing. Demand is also based on ability
to pay. If you can’t pay for it, you have no effective demand.
 The quantity demanded of a good or service is the amount that
consumers plan to buy during a given time period at a particular price.
 The quantity demanded may exceed the amount of goods available,
so the quantity bought is less than the quantity demanded.
 Many factors influence buying plans and one of them is price.
 If we observe the relationship between the quantity demanded of a good and
its price, making a ceteris paribus assumption-that is we keep all other
influences on buying plans the same.
 The LAW OF DEMAND states:
“Other things remaining the same, the higher the price of a good, the smaller the
quantity demanded; and the lower the price of a good, the greater is the quantity
demanded.”
Demand Curve and Demand Schedule
 Demand can be illustrated by the demand curve and the demand schedule.
 The quantity demanded refers to a point on a demand curve-the quantity
demanded at a particular price.
 A demand curve shows the relationship between the quantity demanded of
a good and its price when all other influences on consumers planned
purchases remain the same.
 The demand schedule lists the quantity demanded at each price when all
other factors remain constant.
 We can graph the demand schedule as a demand curve with quantity
demanded on the x axis and the price on the y axis.
 Table 1: The demand schedule
Price
per
drink
Quantity
demanded(millions of
energy drinks per week)
A P5 9
B P10 6
C P15 4
D P20 3
E P25 2
The demand curve
 The demand schedule (Table 1) shows that as price rises,
quantity demanded decreases, and vice versa. These points can
then be graphed, and the line connecting them is the demand
curve. The downward slope of the demand curve again illustrates
the law of demand—the inverse relationship between prices and
quantity demanded.
 The demand schedule and the demand curve shown by the
graph in are two ways of describing the same relationship
between price and quantity demanded.
What Factors Affect Demand?
 Six main factors affect demand, and these are
1. Prices of related goods-a substitute is a good that can be used in place of
another good. Eg a bus ride is a substitute for a train ride. If the price for bus
ride rises, people use less of the bus rides and use more train rides hence the
demand for train rides will increase.
 Demand also depend on the price of complements. A complement is a good
that is used in conjunction with another good. For example, if the price of an
hour at the gym falls, people buy more gym time and more energy drinks.
2. Expected future prices- if the expected future price of a good rises and if the
good can be stored, the opportunity cost of obtaining the good for future use is
lower today than it will be when the price has increased. So people retime their
purchases. They buy more of the good now before the price increases, so the
demand for the good today increases.
3. Income-consumers income influences demand. When income increases,
consumers buy more of most goods; and when income decreases, consumers buy
less of most goods.
 A normal good is one for which demand increases as income increases. An
inferior good is one for which demand decreases as income increases.
 For example, as income increases, the demand for air travel(a normal good)
increases and the demand for long distance bus trips(an inferior good)
decreases.
4.Expected future income or credit-when expected income increases or credit
becomes easier to get, demand for the good might increase now.
5. Population- demand also depend on the size and the age structure of the
population. The larger the population, the greater is the demand for all goods
and services; the smaller the population, the smaller is the demand for all goods
and services.
 Also the larger the proportion of the population in a given age group, the
greater is the demand for the goods and services used by that age group.
6. Preferences-preferences are an individual’s attitudes towards goods and
services. Preferences depend on the weather, information and fashion.
A change in the quantity demanded
versus a change in Demand
Movement along the demand curve
 If the price of the good changes but no other influence on buying plans
changes, the effect is a movement along the demand curve.
 A fall in the price of a good increases the quantity demanded of it and a rise
in the price of a good decreases the quantity demanded of it. These are all
movements along the demand curve.
A shift of the demand curve
 If the price of a good remains constant and some factor that affects the
demand changes, there is a change in the demand for that good.
 A change in the demand will shift the demand curve, either a rightward shift
of the demand curve( increase in demand at each price) or leftwards shift of
the demand curve( decrease in demand at each price).
Ceteris Paribus Assumption
 A demand curve or a supply curve (which we’ll cover later in this module) is a
relationship between two, and only two, variables: price on the vertical axis and
quantity on the horizontal axis.
 The assumption behind a demand curve or a supply curve is that no relevant economic
factors, other than the product’s price, are changing.
 Economists call this assumption ceteris paribus, a Latin phrase meaning “other things
being equal.” Any given demand or supply curve is based on the ceteris
paribus assumption that all else is held equal.
SUPPLY OF GOODS AND SERVICES
 When economists talk about supply, they mean the amount of some good or service a
producer is willing to supply at each price. Price is what the producer receives for
selling one unit of a good or service.
 The quantity supplied of a good or service is the amount that producers plan to sell
during a given time period at a particular price.
 The law of supply states:
“Other things remaining the same, the higher the price of a good, the greater
the is the quantity supplied; and the lower the price of a good, the smaller the
quantity supplied.”
Supply curve and supply schedule
 The term supply refers to the relationship between the quantity supplied and
the price of a good.
 Supply is illustrated by the supply curve and the supply schedule.
 The quantity supplied refers to a point on a supply curve-the quantity
supplied at a particular price.
 A supply curve shows the relationship between the quantity supplied of a
good and its price when other factors are constant. The supply curve is a
graph of a supply schedule.
 A supply schedule lists the quantities supplied at each price when all other
influences on producers planned sales remain the same
 To make a supply curve, we graph the quantity supplied on the x axis and the
price of the y axis.
Price per
drink
Quantity
supplied(millions of
energy drinks per
week)
A P5 0
B P10 3
C P15 4
D P20 5
E P25 6
The supply curve
 The shape of supply curves will vary somewhat according to the product: steeper,
flatter, straighter, or curved. Nearly all supply curves, however, share a basic
similarity: they slope up from left to right and illustrate the law of supply
What Factors Affect Supply?
 There are 6 main factors that bring changes in supply and are:
 Prices of factors of production- if the price of a factor of production rises,
the lowest price a producer is willing to accept rises, so supply decreases.
 Prices of related goods produced- the prices of related goods and services
that firms produce influence supply. For example, if the price of soft drinks
rises, the supply of energy drinks decreases. Energy drinks and soft drinks are
substitutes in production-ie can be produced using the same resources.
 Expected future prices- if the expected future price of a good rises, the
return from selling it in the future is higher than it is today. So supply
decreases today and increases in the future
 Number of suppliers-the larger the number of firms that produce a good, the
greater is the supply of the good.
 Technology- this is the way that factors of production are used to produce a
good. A technology change occurs when a new method is discovered that
lowers the cost of producing a good.
 The state of nature-this includes all natural forces that influence production
including the state of the weather. Good weather can increase the supply of
many crops and bad weather can decrease it.
A change in the quantity supplied versus
a change in supply
 A movement along the supply curve shows a change in the quantity supplied.
 A shift of the supply curve shows a change in supply.
Market equilibrium
 When the price of a good rises, the quantity demanded decreases and the
quantity supplied increases.
 Equilibrium is a situation in which opposing forces, balance each other.
 Equilibrium in a market occurs when the price balances the plans of buyers
and sellers.
 The equilibrium price is the price at which the quantity demanded equals
the quantity supplied.
 The equilibrium quantity is the quantity bought and sold at the equilibrium
price.
 A market moves towards its equilibrium because:
-Price regulates buying and selling plans
-Price adjusts when plans don’t match
 The price of a good regulates the quantities demanded and supplied.
 If the price is too high, the quantity supplied exceed the quantity demanded.
 If the price is too low, the quantity demanded exceeds the quantity supplied.
 There is only one price at which the quantity demanded equals the quantity
supplied.
 A shortage forces the price up.
 A surplus forces the price down.
Price
Quantity
demanded
Quantity
supplied
Shortage or
surplus
P5 9 0 -9
P10 6 3 -3
P15 4 4 0
P20 3 5 +2
P25 2 6 +4
What happens with Artificial Prices
 Artificial prices are prices of goods when the price has been
affected by a market manipulation and is thus higher or lower
than it would have been if it reflected the forces of supply and
demand.
 Market manipulation is a type of market abuse where there is a
deliberate attempt to interfere with the free and fair operation
of the market; the most blatant of cases involve creating false or
misleading appearances with respect to the price of, or market
for, a product, security or commodity.
Examples of Artificial pricing
 Pools -Agreements, often written, among a group of traders to
delegate authority to a single manager to trade in a specific stock for a
specific period of time and then to share in the resulting profits or
losses.
 Churning-When a trader places both buy and sell orders at about the
same price. The increase in activity is intended to attract additional
investors, and increase the price.
 Stock bashing-This scheme is usually orchestrated by savvy online
message board posters (a.k.a. "Bashers") who make up false and/or
misleading information about the target company in an attempt to get
shares for a cheaper price.
 Runs-When a group of traders create activity or rumours in order to
drive the price of a security up. An example is the Guinness share-
trading fraud of the 1980s.
 Ramping (the market)- Actions designed to artificially raise the market
price of listed securities and give the impression of voluminous trading
in order to make a quick profit.
 Wash trade-In a wash trade the manipulator sells and repurchases the
same or substantially the same security for the purpose of generating
activity and increasing the price. This is more involved than churning
because the orders are actually fulfilled.
 Price-fixing-A very simple type of fraud where the principles who
publish a price or indicator conspire to set it falsely and benefit
their own interests. The Libor scandal for example, involved
bankers setting the Libor rate to benefit their trader's portfolios
or to make certain entities appear more creditworthy than they
were.
 High closing (finance)-High closing is an attempt to manipulate
the price of a security at the end of trading day to ensure that it
closes higher than it should. This is usually achieved by putting in
manipulative trades close to closing
Myths about prices
Myth #1: We need to accept market or competitor pricing
 Businesses must accept the equilibrium price, where the demand curve
crosses the supply curve. While this is a convenient excuse for marketing
managers to abdicate responsibility for pricing by finding an equilibrium point
in the industry, this theory doesn’t correctly reflect how the real market
works. Prices in any market span across a range, rather than fixing on only one
point. Product differentiation through brand, quality, etc can all affect where
your business lies on this range.
TRUTH: No matter the density of your industry, product and brand
differentiation can take you well above the market standard. Hell, even basic
things like psychological pricing can set you a part and justify price increases.
 Myth #2: The only way to increase volume of sales is by
decreasing price
 It may sound too good to be true, but it is indeed possible to raise prices and increase volume at
the same time. Price isn’t the only factor that attracts consumers. Focusing on giving consumers
a reason to pay a higher price for your product or service is crucial, whether that be greater
quality or friendlier service. A powerful tool is market segmentation. Most products have a
target audience, whether it’s the wealthy, the bargain hunters, the amateur software user or the
rock star computer programmer. Creating different classes for your product depending on quality
or number of services can expand the number of consumers you cater to, thus increasing buyers.
Additionally, sometimes lowering your price can actually deter people from buying your product.
Think about it. If I came up to you and said I’d sell you an Apple MacBook Air for $100, you
wouldn’t buy it, because you’d definitely question the quality.
TRUTH: Volume is created by customer segmentation, charging different sets of customers
different prices, and thus increasing volume and revenue.
 Myth #3: We need to charge lower than everyone else
 This is quite possibly the biggest misconception. A race to the bottom is one of the worst ways to compete, because
you end up underpricing and losing out on your customer segment who begin to question your quality or revenue while
your customer segment continues to buy.
 Lower prices equals lower revenue rates, which means the number of sales must increase to cover the loss. Obvious,
yes, but it needed to be stated.
 Additionally, a smaller price tag doesn’t mean automatically consumers will flock towards your product. For example, if
BMW suddenly sold its cars for $35,000 instead of whatever ridiculous number they’re priced at now, would that
necessarily increase its revenues?
 Possibly in the short term, but in the long term they would begin to compete with cars made by Honda and Toyota who
already have the market cornered. BMW would also lose out on the consumers that put luxury value in the premium
pricing of their cars.
TRUTH: Underpricing is rarely the solution to any pricing woes. You end up dropping into a different segment of
customer and lose out on cash from your current customers.
 Myth #4: Pricing isn’t important
 Pricing is the most important aspect of your business. Period. We explained why in this pricing post, but
to reiterate: a 1% improvement in pricing results in an average increase of 11.1% in operating profit.
 No other business lever has that impact, not cost optimization, volume increases, or anything. The
answer is pricing. Of course, business owners are pretty busy people. Especially with small businesses
that require constant diligence, which pushes pricing to the side, because an optimized strategy does
take some time and effort.
 Yet, advertising, brand awareness, and the like all sum up to your price, so you should make sure you
have the right one. Stop guessing, and start taking it seriously today.
TRUTH: Pricing is, bar none, the lever in your business that has the highest impact on the most
important cell on your end of month spreadsheet - your revenue. You need to take it seriously.
 Myth #5: Price optimization is difficult
 In fact, calculating fairly accurate upper and lower bounds for your pricing is very
possible to do from just looking at current sales, your loss rate, and speaking with a
few customers (which you should be doing already).
 When you want to optimize even further, value based pricing brings a much higher
confidence interval, taking research of consumer’s wilingess to pay and calculating
price bands. Those math models may not be fun, but they get results and there are
plenty of resources out there.
TRUTH: Optimizing your pricing isn’t difficult, it just takes some initiative.
Myth#6: Price optimization will cost a fortune
 As we explained previously, you don’t need to hire anyone or buy any software to get
things moving on your pricing strategy
 For small businesses, it is often difficult to conduct this type of research on their own,
due to resource limitations. Not to worry, because there are pricing companies that
specialize in aiding these smaller groups. They are usually characterized by less
expensive services and quicker results. Remember though, you can get things moving
by simply dedicating a small amount of time per week where you prioritize pricing
research and optimization. Trust us, a little work can go a long way.
TRUTH: Pricing doesn’t have to be an expensive endeavor. There are a lot of cheaper
alternatives to expensive consultants, and you can even get the ball moving by simply
dedicating a small amount of time to pricing each week.

More Related Content

Similar to UNIT 1 - WHAT IS ECONOMICS LESSON...pptx

Economics
EconomicsEconomics
EconomicsmhALZz
 
Economics basics
Economics basicsEconomics basics
Economics basicskofolina
 
Economics bhawani nandanprasad
Economics   bhawani nandanprasadEconomics   bhawani nandanprasad
Economics bhawani nandanprasadBhawani N Prasad
 
Information Systems for Decision-MakingAssignment 1 The CEO’s.docx
Information Systems for Decision-MakingAssignment 1 The CEO’s.docxInformation Systems for Decision-MakingAssignment 1 The CEO’s.docx
Information Systems for Decision-MakingAssignment 1 The CEO’s.docxjaggernaoma
 
Law of supply and demand
Law of supply and demandLaw of supply and demand
Law of supply and demandMuhammad Ilyas
 
CA NOTES ON THEORY OF DEMAND AND SUPPLY IN BUSINESS ECONOMICS
CA NOTES ON THEORY OF DEMAND AND SUPPLY IN BUSINESS ECONOMICSCA NOTES ON THEORY OF DEMAND AND SUPPLY IN BUSINESS ECONOMICS
CA NOTES ON THEORY OF DEMAND AND SUPPLY IN BUSINESS ECONOMICSKanoon Ke Rakhwale India
 
Eco 1.report
Eco 1.reportEco 1.report
Eco 1.reportGigantz
 
2. The nature of Demand.pptx
2. The nature of Demand.pptx2. The nature of Demand.pptx
2. The nature of Demand.pptxHenokMolla3
 
L of demand converted
L of demand convertedL of demand converted
L of demand convertedDiptiSingh55
 
Microeconomics 365 Week 1
Microeconomics 365 Week 1Microeconomics 365 Week 1
Microeconomics 365 Week 1Stacey Troup
 
Law of supply and demand
Law of supply and demandLaw of supply and demand
Law of supply and demandNzar Braim
 
Introduction The economics discipline has gained immense popularity in.pdf
Introduction The economics discipline has gained immense popularity in.pdfIntroduction The economics discipline has gained immense popularity in.pdf
Introduction The economics discipline has gained immense popularity in.pdfbkbk37
 

Similar to UNIT 1 - WHAT IS ECONOMICS LESSON...pptx (18)

Economics
EconomicsEconomics
Economics
 
Economics basics
Economics basicsEconomics basics
Economics basics
 
Raj sourav
Raj souravRaj sourav
Raj sourav
 
Raj sourav
Raj souravRaj sourav
Raj sourav
 
Economics bhawani nandanprasad
Economics   bhawani nandanprasadEconomics   bhawani nandanprasad
Economics bhawani nandanprasad
 
Demand
DemandDemand
Demand
 
Information Systems for Decision-MakingAssignment 1 The CEO’s.docx
Information Systems for Decision-MakingAssignment 1 The CEO’s.docxInformation Systems for Decision-MakingAssignment 1 The CEO’s.docx
Information Systems for Decision-MakingAssignment 1 The CEO’s.docx
 
Law of demand
Law of demand Law of demand
Law of demand
 
Law of supply and demand
Law of supply and demandLaw of supply and demand
Law of supply and demand
 
Demand
DemandDemand
Demand
 
CA NOTES ON THEORY OF DEMAND AND SUPPLY IN BUSINESS ECONOMICS
CA NOTES ON THEORY OF DEMAND AND SUPPLY IN BUSINESS ECONOMICSCA NOTES ON THEORY OF DEMAND AND SUPPLY IN BUSINESS ECONOMICS
CA NOTES ON THEORY OF DEMAND AND SUPPLY IN BUSINESS ECONOMICS
 
Demand theory
Demand theoryDemand theory
Demand theory
 
Eco 1.report
Eco 1.reportEco 1.report
Eco 1.report
 
2. The nature of Demand.pptx
2. The nature of Demand.pptx2. The nature of Demand.pptx
2. The nature of Demand.pptx
 
L of demand converted
L of demand convertedL of demand converted
L of demand converted
 
Microeconomics 365 Week 1
Microeconomics 365 Week 1Microeconomics 365 Week 1
Microeconomics 365 Week 1
 
Law of supply and demand
Law of supply and demandLaw of supply and demand
Law of supply and demand
 
Introduction The economics discipline has gained immense popularity in.pdf
Introduction The economics discipline has gained immense popularity in.pdfIntroduction The economics discipline has gained immense popularity in.pdf
Introduction The economics discipline has gained immense popularity in.pdf
 

More from PreciousChanaiwa

oralpressiecriteriafull IB FILM STUDIES.pdf
oralpressiecriteriafull IB FILM STUDIES.pdforalpressiecriteriafull IB FILM STUDIES.pdf
oralpressiecriteriafull IB FILM STUDIES.pdfPreciousChanaiwa
 
FIM LANGUAGE PPT IB FILM STUDIES LESSON.pptx
FIM LANGUAGE PPT IB FILM STUDIES LESSON.pptxFIM LANGUAGE PPT IB FILM STUDIES LESSON.pptx
FIM LANGUAGE PPT IB FILM STUDIES LESSON.pptxPreciousChanaiwa
 
CINEMATOGRAPHY IB FIM STUDIES LESSON.pptx
CINEMATOGRAPHY IB FIM STUDIES LESSON.pptxCINEMATOGRAPHY IB FIM STUDIES LESSON.pptx
CINEMATOGRAPHY IB FIM STUDIES LESSON.pptxPreciousChanaiwa
 
FILM LANGUAGE MISE-EN-SCENE LESSON P.pptx
FILM LANGUAGE MISE-EN-SCENE LESSON P.pptxFILM LANGUAGE MISE-EN-SCENE LESSON P.pptx
FILM LANGUAGE MISE-EN-SCENE LESSON P.pptxPreciousChanaiwa
 
CUSTOMER SERVICE WEEK NOTES AND LESSON 1.pptx
CUSTOMER SERVICE WEEK NOTES AND LESSON 1.pptxCUSTOMER SERVICE WEEK NOTES AND LESSON 1.pptx
CUSTOMER SERVICE WEEK NOTES AND LESSON 1.pptxPreciousChanaiwa
 
Basic Economics WEEK 6 LESSON PLAN .pptx
Basic Economics WEEK 6 LESSON PLAN .pptxBasic Economics WEEK 6 LESSON PLAN .pptx
Basic Economics WEEK 6 LESSON PLAN .pptxPreciousChanaiwa
 
Quantitative Research Techniques ppt 4.pptx
Quantitative Research Techniques ppt 4.pptxQuantitative Research Techniques ppt 4.pptx
Quantitative Research Techniques ppt 4.pptxPreciousChanaiwa
 
Market Research WEEK 6 LESSON PLAN .pptx
Market Research WEEK 6 LESSON PLAN .pptxMarket Research WEEK 6 LESSON PLAN .pptx
Market Research WEEK 6 LESSON PLAN .pptxPreciousChanaiwa
 
MARKET RESEARCH WEEK LESSONN PLAN 5.pptx
MARKET RESEARCH WEEK LESSONN PLAN 5.pptxMARKET RESEARCH WEEK LESSONN PLAN 5.pptx
MARKET RESEARCH WEEK LESSONN PLAN 5.pptxPreciousChanaiwa
 
MARKET RESEARCH WEEK LESSSON WEEK 2.pptx
MARKET RESEARCH WEEK LESSSON WEEK 2.pptxMARKET RESEARCH WEEK LESSSON WEEK 2.pptx
MARKET RESEARCH WEEK LESSSON WEEK 2.pptxPreciousChanaiwa
 
MARKET RESEARCH WEEK 1 LESSON OVERVIEW.pptx
MARKET RESEARCH WEEK 1 LESSON OVERVIEW.pptxMARKET RESEARCH WEEK 1 LESSON OVERVIEW.pptx
MARKET RESEARCH WEEK 1 LESSON OVERVIEW.pptxPreciousChanaiwa
 
Data Gathering, Preparation, and Analysis- Mktg.pptx
Data Gathering, Preparation, and Analysis- Mktg.pptxData Gathering, Preparation, and Analysis- Mktg.pptx
Data Gathering, Preparation, and Analysis- Mktg.pptxPreciousChanaiwa
 
1.2 MKIS and MDSS IN MARKET RESEARCH.pptx
1.2 MKIS and MDSS IN MARKET RESEARCH.pptx1.2 MKIS and MDSS IN MARKET RESEARCH.pptx
1.2 MKIS and MDSS IN MARKET RESEARCH.pptxPreciousChanaiwa
 
The role of PR the Media Study Unit 4.pptx
The role of PR  the Media Study Unit 4.pptxThe role of PR  the Media Study Unit 4.pptx
The role of PR the Media Study Unit 4.pptxPreciousChanaiwa
 
The role of Public Relations and the Media 3.pptx
The role of Public Relations and the Media 3.pptxThe role of Public Relations and the Media 3.pptx
The role of Public Relations and the Media 3.pptxPreciousChanaiwa
 
PR and the Media 2 THE ROLE OF PR IN BUSINESS.pptx
PR and the Media 2 THE ROLE OF PR IN BUSINESS.pptxPR and the Media 2 THE ROLE OF PR IN BUSINESS.pptx
PR and the Media 2 THE ROLE OF PR IN BUSINESS.pptxPreciousChanaiwa
 
PR and the Media the role of PR A 1.pptx
PR and the Media the role of PR A 1.pptxPR and the Media the role of PR A 1.pptx
PR and the Media the role of PR A 1.pptxPreciousChanaiwa
 
anatomy of public relations for pr playbook 3rd edition.ppt
anatomy of public relations for pr playbook 3rd edition.pptanatomy of public relations for pr playbook 3rd edition.ppt
anatomy of public relations for pr playbook 3rd edition.pptPreciousChanaiwa
 
public relations and corporate image.ppt
public relations and corporate image.pptpublic relations and corporate image.ppt
public relations and corporate image.pptPreciousChanaiwa
 
Strategic Marketing comms - corporate identity.ppt
Strategic Marketing comms - corporate identity.pptStrategic Marketing comms - corporate identity.ppt
Strategic Marketing comms - corporate identity.pptPreciousChanaiwa
 

More from PreciousChanaiwa (20)

oralpressiecriteriafull IB FILM STUDIES.pdf
oralpressiecriteriafull IB FILM STUDIES.pdforalpressiecriteriafull IB FILM STUDIES.pdf
oralpressiecriteriafull IB FILM STUDIES.pdf
 
FIM LANGUAGE PPT IB FILM STUDIES LESSON.pptx
FIM LANGUAGE PPT IB FILM STUDIES LESSON.pptxFIM LANGUAGE PPT IB FILM STUDIES LESSON.pptx
FIM LANGUAGE PPT IB FILM STUDIES LESSON.pptx
 
CINEMATOGRAPHY IB FIM STUDIES LESSON.pptx
CINEMATOGRAPHY IB FIM STUDIES LESSON.pptxCINEMATOGRAPHY IB FIM STUDIES LESSON.pptx
CINEMATOGRAPHY IB FIM STUDIES LESSON.pptx
 
FILM LANGUAGE MISE-EN-SCENE LESSON P.pptx
FILM LANGUAGE MISE-EN-SCENE LESSON P.pptxFILM LANGUAGE MISE-EN-SCENE LESSON P.pptx
FILM LANGUAGE MISE-EN-SCENE LESSON P.pptx
 
CUSTOMER SERVICE WEEK NOTES AND LESSON 1.pptx
CUSTOMER SERVICE WEEK NOTES AND LESSON 1.pptxCUSTOMER SERVICE WEEK NOTES AND LESSON 1.pptx
CUSTOMER SERVICE WEEK NOTES AND LESSON 1.pptx
 
Basic Economics WEEK 6 LESSON PLAN .pptx
Basic Economics WEEK 6 LESSON PLAN .pptxBasic Economics WEEK 6 LESSON PLAN .pptx
Basic Economics WEEK 6 LESSON PLAN .pptx
 
Quantitative Research Techniques ppt 4.pptx
Quantitative Research Techniques ppt 4.pptxQuantitative Research Techniques ppt 4.pptx
Quantitative Research Techniques ppt 4.pptx
 
Market Research WEEK 6 LESSON PLAN .pptx
Market Research WEEK 6 LESSON PLAN .pptxMarket Research WEEK 6 LESSON PLAN .pptx
Market Research WEEK 6 LESSON PLAN .pptx
 
MARKET RESEARCH WEEK LESSONN PLAN 5.pptx
MARKET RESEARCH WEEK LESSONN PLAN 5.pptxMARKET RESEARCH WEEK LESSONN PLAN 5.pptx
MARKET RESEARCH WEEK LESSONN PLAN 5.pptx
 
MARKET RESEARCH WEEK LESSSON WEEK 2.pptx
MARKET RESEARCH WEEK LESSSON WEEK 2.pptxMARKET RESEARCH WEEK LESSSON WEEK 2.pptx
MARKET RESEARCH WEEK LESSSON WEEK 2.pptx
 
MARKET RESEARCH WEEK 1 LESSON OVERVIEW.pptx
MARKET RESEARCH WEEK 1 LESSON OVERVIEW.pptxMARKET RESEARCH WEEK 1 LESSON OVERVIEW.pptx
MARKET RESEARCH WEEK 1 LESSON OVERVIEW.pptx
 
Data Gathering, Preparation, and Analysis- Mktg.pptx
Data Gathering, Preparation, and Analysis- Mktg.pptxData Gathering, Preparation, and Analysis- Mktg.pptx
Data Gathering, Preparation, and Analysis- Mktg.pptx
 
1.2 MKIS and MDSS IN MARKET RESEARCH.pptx
1.2 MKIS and MDSS IN MARKET RESEARCH.pptx1.2 MKIS and MDSS IN MARKET RESEARCH.pptx
1.2 MKIS and MDSS IN MARKET RESEARCH.pptx
 
The role of PR the Media Study Unit 4.pptx
The role of PR  the Media Study Unit 4.pptxThe role of PR  the Media Study Unit 4.pptx
The role of PR the Media Study Unit 4.pptx
 
The role of Public Relations and the Media 3.pptx
The role of Public Relations and the Media 3.pptxThe role of Public Relations and the Media 3.pptx
The role of Public Relations and the Media 3.pptx
 
PR and the Media 2 THE ROLE OF PR IN BUSINESS.pptx
PR and the Media 2 THE ROLE OF PR IN BUSINESS.pptxPR and the Media 2 THE ROLE OF PR IN BUSINESS.pptx
PR and the Media 2 THE ROLE OF PR IN BUSINESS.pptx
 
PR and the Media the role of PR A 1.pptx
PR and the Media the role of PR A 1.pptxPR and the Media the role of PR A 1.pptx
PR and the Media the role of PR A 1.pptx
 
anatomy of public relations for pr playbook 3rd edition.ppt
anatomy of public relations for pr playbook 3rd edition.pptanatomy of public relations for pr playbook 3rd edition.ppt
anatomy of public relations for pr playbook 3rd edition.ppt
 
public relations and corporate image.ppt
public relations and corporate image.pptpublic relations and corporate image.ppt
public relations and corporate image.ppt
 
Strategic Marketing comms - corporate identity.ppt
Strategic Marketing comms - corporate identity.pptStrategic Marketing comms - corporate identity.ppt
Strategic Marketing comms - corporate identity.ppt
 

Recently uploaded

Biting mechanism of poisonous snakes.pdf
Biting mechanism of poisonous snakes.pdfBiting mechanism of poisonous snakes.pdf
Biting mechanism of poisonous snakes.pdfadityarao40181
 
Crayon Activity Handout For the Crayon A
Crayon Activity Handout For the Crayon ACrayon Activity Handout For the Crayon A
Crayon Activity Handout For the Crayon AUnboundStockton
 
MARGINALIZATION (Different learners in Marginalized Group
MARGINALIZATION (Different learners in Marginalized GroupMARGINALIZATION (Different learners in Marginalized Group
MARGINALIZATION (Different learners in Marginalized GroupJonathanParaisoCruz
 
Pharmacognosy Flower 3. Compositae 2023.pdf
Pharmacognosy Flower 3. Compositae 2023.pdfPharmacognosy Flower 3. Compositae 2023.pdf
Pharmacognosy Flower 3. Compositae 2023.pdfMahmoud M. Sallam
 
Alper Gobel In Media Res Media Component
Alper Gobel In Media Res Media ComponentAlper Gobel In Media Res Media Component
Alper Gobel In Media Res Media ComponentInMediaRes1
 
Solving Puzzles Benefits Everyone (English).pptx
Solving Puzzles Benefits Everyone (English).pptxSolving Puzzles Benefits Everyone (English).pptx
Solving Puzzles Benefits Everyone (English).pptxOH TEIK BIN
 
Interactive Powerpoint_How to Master effective communication
Interactive Powerpoint_How to Master effective communicationInteractive Powerpoint_How to Master effective communication
Interactive Powerpoint_How to Master effective communicationnomboosow
 
Introduction to AI in Higher Education_draft.pptx
Introduction to AI in Higher Education_draft.pptxIntroduction to AI in Higher Education_draft.pptx
Introduction to AI in Higher Education_draft.pptxpboyjonauth
 
internship ppt on smartinternz platform as salesforce developer
internship ppt on smartinternz platform as salesforce developerinternship ppt on smartinternz platform as salesforce developer
internship ppt on smartinternz platform as salesforce developerunnathinaik
 
call girls in Kamla Market (DELHI) 🔝 >༒9953330565🔝 genuine Escort Service 🔝✔️✔️
call girls in Kamla Market (DELHI) 🔝 >༒9953330565🔝 genuine Escort Service 🔝✔️✔️call girls in Kamla Market (DELHI) 🔝 >༒9953330565🔝 genuine Escort Service 🔝✔️✔️
call girls in Kamla Market (DELHI) 🔝 >༒9953330565🔝 genuine Escort Service 🔝✔️✔️9953056974 Low Rate Call Girls In Saket, Delhi NCR
 
Earth Day Presentation wow hello nice great
Earth Day Presentation wow hello nice greatEarth Day Presentation wow hello nice great
Earth Day Presentation wow hello nice greatYousafMalik24
 
Employee wellbeing at the workplace.pptx
Employee wellbeing at the workplace.pptxEmployee wellbeing at the workplace.pptx
Employee wellbeing at the workplace.pptxNirmalaLoungPoorunde1
 
How to Make a Pirate ship Primary Education.pptx
How to Make a Pirate ship Primary Education.pptxHow to Make a Pirate ship Primary Education.pptx
How to Make a Pirate ship Primary Education.pptxmanuelaromero2013
 
Capitol Tech U Doctoral Presentation - April 2024.pptx
Capitol Tech U Doctoral Presentation - April 2024.pptxCapitol Tech U Doctoral Presentation - April 2024.pptx
Capitol Tech U Doctoral Presentation - April 2024.pptxCapitolTechU
 
“Oh GOSH! Reflecting on Hackteria's Collaborative Practices in a Global Do-It...
“Oh GOSH! Reflecting on Hackteria's Collaborative Practices in a Global Do-It...“Oh GOSH! Reflecting on Hackteria's Collaborative Practices in a Global Do-It...
“Oh GOSH! Reflecting on Hackteria's Collaborative Practices in a Global Do-It...Marc Dusseiller Dusjagr
 
Presiding Officer Training module 2024 lok sabha elections
Presiding Officer Training module 2024 lok sabha electionsPresiding Officer Training module 2024 lok sabha elections
Presiding Officer Training module 2024 lok sabha electionsanshu789521
 
POINT- BIOCHEMISTRY SEM 2 ENZYMES UNIT 5.pptx
POINT- BIOCHEMISTRY SEM 2 ENZYMES UNIT 5.pptxPOINT- BIOCHEMISTRY SEM 2 ENZYMES UNIT 5.pptx
POINT- BIOCHEMISTRY SEM 2 ENZYMES UNIT 5.pptxSayali Powar
 
ECONOMIC CONTEXT - LONG FORM TV DRAMA - PPT
ECONOMIC CONTEXT - LONG FORM TV DRAMA - PPTECONOMIC CONTEXT - LONG FORM TV DRAMA - PPT
ECONOMIC CONTEXT - LONG FORM TV DRAMA - PPTiammrhaywood
 

Recently uploaded (20)

Biting mechanism of poisonous snakes.pdf
Biting mechanism of poisonous snakes.pdfBiting mechanism of poisonous snakes.pdf
Biting mechanism of poisonous snakes.pdf
 
Crayon Activity Handout For the Crayon A
Crayon Activity Handout For the Crayon ACrayon Activity Handout For the Crayon A
Crayon Activity Handout For the Crayon A
 
MARGINALIZATION (Different learners in Marginalized Group
MARGINALIZATION (Different learners in Marginalized GroupMARGINALIZATION (Different learners in Marginalized Group
MARGINALIZATION (Different learners in Marginalized Group
 
Pharmacognosy Flower 3. Compositae 2023.pdf
Pharmacognosy Flower 3. Compositae 2023.pdfPharmacognosy Flower 3. Compositae 2023.pdf
Pharmacognosy Flower 3. Compositae 2023.pdf
 
Alper Gobel In Media Res Media Component
Alper Gobel In Media Res Media ComponentAlper Gobel In Media Res Media Component
Alper Gobel In Media Res Media Component
 
Solving Puzzles Benefits Everyone (English).pptx
Solving Puzzles Benefits Everyone (English).pptxSolving Puzzles Benefits Everyone (English).pptx
Solving Puzzles Benefits Everyone (English).pptx
 
Interactive Powerpoint_How to Master effective communication
Interactive Powerpoint_How to Master effective communicationInteractive Powerpoint_How to Master effective communication
Interactive Powerpoint_How to Master effective communication
 
Introduction to AI in Higher Education_draft.pptx
Introduction to AI in Higher Education_draft.pptxIntroduction to AI in Higher Education_draft.pptx
Introduction to AI in Higher Education_draft.pptx
 
internship ppt on smartinternz platform as salesforce developer
internship ppt on smartinternz platform as salesforce developerinternship ppt on smartinternz platform as salesforce developer
internship ppt on smartinternz platform as salesforce developer
 
call girls in Kamla Market (DELHI) 🔝 >༒9953330565🔝 genuine Escort Service 🔝✔️✔️
call girls in Kamla Market (DELHI) 🔝 >༒9953330565🔝 genuine Escort Service 🔝✔️✔️call girls in Kamla Market (DELHI) 🔝 >༒9953330565🔝 genuine Escort Service 🔝✔️✔️
call girls in Kamla Market (DELHI) 🔝 >༒9953330565🔝 genuine Escort Service 🔝✔️✔️
 
Earth Day Presentation wow hello nice great
Earth Day Presentation wow hello nice greatEarth Day Presentation wow hello nice great
Earth Day Presentation wow hello nice great
 
TataKelola dan KamSiber Kecerdasan Buatan v022.pdf
TataKelola dan KamSiber Kecerdasan Buatan v022.pdfTataKelola dan KamSiber Kecerdasan Buatan v022.pdf
TataKelola dan KamSiber Kecerdasan Buatan v022.pdf
 
Employee wellbeing at the workplace.pptx
Employee wellbeing at the workplace.pptxEmployee wellbeing at the workplace.pptx
Employee wellbeing at the workplace.pptx
 
How to Make a Pirate ship Primary Education.pptx
How to Make a Pirate ship Primary Education.pptxHow to Make a Pirate ship Primary Education.pptx
How to Make a Pirate ship Primary Education.pptx
 
Capitol Tech U Doctoral Presentation - April 2024.pptx
Capitol Tech U Doctoral Presentation - April 2024.pptxCapitol Tech U Doctoral Presentation - April 2024.pptx
Capitol Tech U Doctoral Presentation - April 2024.pptx
 
ESSENTIAL of (CS/IT/IS) class 06 (database)
ESSENTIAL of (CS/IT/IS) class 06 (database)ESSENTIAL of (CS/IT/IS) class 06 (database)
ESSENTIAL of (CS/IT/IS) class 06 (database)
 
“Oh GOSH! Reflecting on Hackteria's Collaborative Practices in a Global Do-It...
“Oh GOSH! Reflecting on Hackteria's Collaborative Practices in a Global Do-It...“Oh GOSH! Reflecting on Hackteria's Collaborative Practices in a Global Do-It...
“Oh GOSH! Reflecting on Hackteria's Collaborative Practices in a Global Do-It...
 
Presiding Officer Training module 2024 lok sabha elections
Presiding Officer Training module 2024 lok sabha electionsPresiding Officer Training module 2024 lok sabha elections
Presiding Officer Training module 2024 lok sabha elections
 
POINT- BIOCHEMISTRY SEM 2 ENZYMES UNIT 5.pptx
POINT- BIOCHEMISTRY SEM 2 ENZYMES UNIT 5.pptxPOINT- BIOCHEMISTRY SEM 2 ENZYMES UNIT 5.pptx
POINT- BIOCHEMISTRY SEM 2 ENZYMES UNIT 5.pptx
 
ECONOMIC CONTEXT - LONG FORM TV DRAMA - PPT
ECONOMIC CONTEXT - LONG FORM TV DRAMA - PPTECONOMIC CONTEXT - LONG FORM TV DRAMA - PPT
ECONOMIC CONTEXT - LONG FORM TV DRAMA - PPT
 

UNIT 1 - WHAT IS ECONOMICS LESSON...pptx

  • 2. Course Content  Study unit 1: What is economics  Study unit 2: Industry and commerce  Study unit 3: Productivity and pay  Study unit 4: Time and risk  Study unit 5: National income  Study unit 6: International trade
  • 3. Assessment  Test 10%  Assignment 40%  Examination 50%
  • 5. Objectives By the end of this lesson, students should be able to:  Allocation of scarce resources  How Prices Allocate Resources  Supply and Demand  What happens with artificial prices?  Myths about Prices
  • 6. Introduction  Economics is the study of how humans make decisions in the face of scarcity.  Economics is the social science that studies the choices that individuals, businesses, governments and entire societies make as they cope with scarcity and the incentives that influence and reconcile those choices.  The subject divides into two main parts:  Microeconomics-is the study of the choices that individuals and businesses make, the way these choices interact in markets and the influence of governments.  Macroeconomics- is the study of the performance of the national economy and the global economy. E.g. unemployment , unemployment etc.
  • 7. Allocation of Scarce Resources  A fundamental fact dominates our lives: we want more than we can get. Our inability to get everything we want is called scarcity.  Scarcity means that human wants for goods, services and resources exceed what is available. Scarcity is universal. It confronts all living things.  Resources, such as labour, tools, land, and raw materials are necessary to produce the goods and services we want but they exist in limited supply.
  • 8.  Time is the ultimate scarce resource, as we have only twenty-four hours in a day to complete what we have to.  Every society, at every level, must make choices about how to use its resources. Families must decide whether to spend their money on a new car or a fancy vacation. Towns must choose whether to put more of the budget into police and fire protection or into the school system. Nations must decide whether to devote more funds to national defense or to protecting the environment. In most cases, there just isn’t enough money in the budget to do everything.  Because we cant get everything we want, we must make choices. Incentives reconciles choices.  An incentive is a reward that encourages or a penalty that discourages an action.
  • 9. Supply and Demand  A market is any arrangement that enables buyers and sellers to get information and do business with each other.  A market has two sides: buyers and sellers.  Markets vary in the intensity of competition that buyers and sellers face. For this discussion we are going to focus on competitive markets-a market that has many buyers and many sellers, so no single buyer or seller can influence the price.
  • 10. Demand for goods and services  Economists use the term demand to refer to the amount of some good or service consumers are willing and able to purchase at each price.  Demand is based on needs and wants—a consumer may be able to differentiate between a need and a want, but from an economist’s perspective, they are the same thing. Demand is also based on ability to pay. If you can’t pay for it, you have no effective demand.  The quantity demanded of a good or service is the amount that consumers plan to buy during a given time period at a particular price.  The quantity demanded may exceed the amount of goods available, so the quantity bought is less than the quantity demanded.
  • 11.  Many factors influence buying plans and one of them is price.  If we observe the relationship between the quantity demanded of a good and its price, making a ceteris paribus assumption-that is we keep all other influences on buying plans the same.  The LAW OF DEMAND states: “Other things remaining the same, the higher the price of a good, the smaller the quantity demanded; and the lower the price of a good, the greater is the quantity demanded.”
  • 12. Demand Curve and Demand Schedule  Demand can be illustrated by the demand curve and the demand schedule.  The quantity demanded refers to a point on a demand curve-the quantity demanded at a particular price.  A demand curve shows the relationship between the quantity demanded of a good and its price when all other influences on consumers planned purchases remain the same.  The demand schedule lists the quantity demanded at each price when all other factors remain constant.
  • 13.  We can graph the demand schedule as a demand curve with quantity demanded on the x axis and the price on the y axis.  Table 1: The demand schedule Price per drink Quantity demanded(millions of energy drinks per week) A P5 9 B P10 6 C P15 4 D P20 3 E P25 2
  • 15.  The demand schedule (Table 1) shows that as price rises, quantity demanded decreases, and vice versa. These points can then be graphed, and the line connecting them is the demand curve. The downward slope of the demand curve again illustrates the law of demand—the inverse relationship between prices and quantity demanded.  The demand schedule and the demand curve shown by the graph in are two ways of describing the same relationship between price and quantity demanded.
  • 16. What Factors Affect Demand?  Six main factors affect demand, and these are 1. Prices of related goods-a substitute is a good that can be used in place of another good. Eg a bus ride is a substitute for a train ride. If the price for bus ride rises, people use less of the bus rides and use more train rides hence the demand for train rides will increase.  Demand also depend on the price of complements. A complement is a good that is used in conjunction with another good. For example, if the price of an hour at the gym falls, people buy more gym time and more energy drinks. 2. Expected future prices- if the expected future price of a good rises and if the good can be stored, the opportunity cost of obtaining the good for future use is lower today than it will be when the price has increased. So people retime their purchases. They buy more of the good now before the price increases, so the demand for the good today increases.
  • 17. 3. Income-consumers income influences demand. When income increases, consumers buy more of most goods; and when income decreases, consumers buy less of most goods.  A normal good is one for which demand increases as income increases. An inferior good is one for which demand decreases as income increases.  For example, as income increases, the demand for air travel(a normal good) increases and the demand for long distance bus trips(an inferior good) decreases. 4.Expected future income or credit-when expected income increases or credit becomes easier to get, demand for the good might increase now.
  • 18. 5. Population- demand also depend on the size and the age structure of the population. The larger the population, the greater is the demand for all goods and services; the smaller the population, the smaller is the demand for all goods and services.  Also the larger the proportion of the population in a given age group, the greater is the demand for the goods and services used by that age group. 6. Preferences-preferences are an individual’s attitudes towards goods and services. Preferences depend on the weather, information and fashion.
  • 19. A change in the quantity demanded versus a change in Demand Movement along the demand curve  If the price of the good changes but no other influence on buying plans changes, the effect is a movement along the demand curve.  A fall in the price of a good increases the quantity demanded of it and a rise in the price of a good decreases the quantity demanded of it. These are all movements along the demand curve.
  • 20.
  • 21. A shift of the demand curve  If the price of a good remains constant and some factor that affects the demand changes, there is a change in the demand for that good.  A change in the demand will shift the demand curve, either a rightward shift of the demand curve( increase in demand at each price) or leftwards shift of the demand curve( decrease in demand at each price).
  • 22.
  • 23. Ceteris Paribus Assumption  A demand curve or a supply curve (which we’ll cover later in this module) is a relationship between two, and only two, variables: price on the vertical axis and quantity on the horizontal axis.  The assumption behind a demand curve or a supply curve is that no relevant economic factors, other than the product’s price, are changing.  Economists call this assumption ceteris paribus, a Latin phrase meaning “other things being equal.” Any given demand or supply curve is based on the ceteris paribus assumption that all else is held equal.
  • 24. SUPPLY OF GOODS AND SERVICES  When economists talk about supply, they mean the amount of some good or service a producer is willing to supply at each price. Price is what the producer receives for selling one unit of a good or service.  The quantity supplied of a good or service is the amount that producers plan to sell during a given time period at a particular price.  The law of supply states: “Other things remaining the same, the higher the price of a good, the greater the is the quantity supplied; and the lower the price of a good, the smaller the quantity supplied.”
  • 25. Supply curve and supply schedule  The term supply refers to the relationship between the quantity supplied and the price of a good.  Supply is illustrated by the supply curve and the supply schedule.  The quantity supplied refers to a point on a supply curve-the quantity supplied at a particular price.  A supply curve shows the relationship between the quantity supplied of a good and its price when other factors are constant. The supply curve is a graph of a supply schedule.  A supply schedule lists the quantities supplied at each price when all other influences on producers planned sales remain the same
  • 26.  To make a supply curve, we graph the quantity supplied on the x axis and the price of the y axis. Price per drink Quantity supplied(millions of energy drinks per week) A P5 0 B P10 3 C P15 4 D P20 5 E P25 6
  • 27. The supply curve  The shape of supply curves will vary somewhat according to the product: steeper, flatter, straighter, or curved. Nearly all supply curves, however, share a basic similarity: they slope up from left to right and illustrate the law of supply
  • 28. What Factors Affect Supply?  There are 6 main factors that bring changes in supply and are:  Prices of factors of production- if the price of a factor of production rises, the lowest price a producer is willing to accept rises, so supply decreases.  Prices of related goods produced- the prices of related goods and services that firms produce influence supply. For example, if the price of soft drinks rises, the supply of energy drinks decreases. Energy drinks and soft drinks are substitutes in production-ie can be produced using the same resources.
  • 29.  Expected future prices- if the expected future price of a good rises, the return from selling it in the future is higher than it is today. So supply decreases today and increases in the future  Number of suppliers-the larger the number of firms that produce a good, the greater is the supply of the good.  Technology- this is the way that factors of production are used to produce a good. A technology change occurs when a new method is discovered that lowers the cost of producing a good.  The state of nature-this includes all natural forces that influence production including the state of the weather. Good weather can increase the supply of many crops and bad weather can decrease it.
  • 30. A change in the quantity supplied versus a change in supply  A movement along the supply curve shows a change in the quantity supplied.  A shift of the supply curve shows a change in supply.
  • 31.
  • 32. Market equilibrium  When the price of a good rises, the quantity demanded decreases and the quantity supplied increases.  Equilibrium is a situation in which opposing forces, balance each other.  Equilibrium in a market occurs when the price balances the plans of buyers and sellers.  The equilibrium price is the price at which the quantity demanded equals the quantity supplied.  The equilibrium quantity is the quantity bought and sold at the equilibrium price.
  • 33.  A market moves towards its equilibrium because: -Price regulates buying and selling plans -Price adjusts when plans don’t match  The price of a good regulates the quantities demanded and supplied.  If the price is too high, the quantity supplied exceed the quantity demanded.  If the price is too low, the quantity demanded exceeds the quantity supplied.  There is only one price at which the quantity demanded equals the quantity supplied.  A shortage forces the price up.  A surplus forces the price down.
  • 34. Price Quantity demanded Quantity supplied Shortage or surplus P5 9 0 -9 P10 6 3 -3 P15 4 4 0 P20 3 5 +2 P25 2 6 +4
  • 35.
  • 36. What happens with Artificial Prices  Artificial prices are prices of goods when the price has been affected by a market manipulation and is thus higher or lower than it would have been if it reflected the forces of supply and demand.  Market manipulation is a type of market abuse where there is a deliberate attempt to interfere with the free and fair operation of the market; the most blatant of cases involve creating false or misleading appearances with respect to the price of, or market for, a product, security or commodity.
  • 37. Examples of Artificial pricing  Pools -Agreements, often written, among a group of traders to delegate authority to a single manager to trade in a specific stock for a specific period of time and then to share in the resulting profits or losses.  Churning-When a trader places both buy and sell orders at about the same price. The increase in activity is intended to attract additional investors, and increase the price.  Stock bashing-This scheme is usually orchestrated by savvy online message board posters (a.k.a. "Bashers") who make up false and/or misleading information about the target company in an attempt to get shares for a cheaper price.
  • 38.  Runs-When a group of traders create activity or rumours in order to drive the price of a security up. An example is the Guinness share- trading fraud of the 1980s.  Ramping (the market)- Actions designed to artificially raise the market price of listed securities and give the impression of voluminous trading in order to make a quick profit.  Wash trade-In a wash trade the manipulator sells and repurchases the same or substantially the same security for the purpose of generating activity and increasing the price. This is more involved than churning because the orders are actually fulfilled.
  • 39.  Price-fixing-A very simple type of fraud where the principles who publish a price or indicator conspire to set it falsely and benefit their own interests. The Libor scandal for example, involved bankers setting the Libor rate to benefit their trader's portfolios or to make certain entities appear more creditworthy than they were.  High closing (finance)-High closing is an attempt to manipulate the price of a security at the end of trading day to ensure that it closes higher than it should. This is usually achieved by putting in manipulative trades close to closing
  • 40. Myths about prices Myth #1: We need to accept market or competitor pricing  Businesses must accept the equilibrium price, where the demand curve crosses the supply curve. While this is a convenient excuse for marketing managers to abdicate responsibility for pricing by finding an equilibrium point in the industry, this theory doesn’t correctly reflect how the real market works. Prices in any market span across a range, rather than fixing on only one point. Product differentiation through brand, quality, etc can all affect where your business lies on this range. TRUTH: No matter the density of your industry, product and brand differentiation can take you well above the market standard. Hell, even basic things like psychological pricing can set you a part and justify price increases.
  • 41.  Myth #2: The only way to increase volume of sales is by decreasing price  It may sound too good to be true, but it is indeed possible to raise prices and increase volume at the same time. Price isn’t the only factor that attracts consumers. Focusing on giving consumers a reason to pay a higher price for your product or service is crucial, whether that be greater quality or friendlier service. A powerful tool is market segmentation. Most products have a target audience, whether it’s the wealthy, the bargain hunters, the amateur software user or the rock star computer programmer. Creating different classes for your product depending on quality or number of services can expand the number of consumers you cater to, thus increasing buyers. Additionally, sometimes lowering your price can actually deter people from buying your product. Think about it. If I came up to you and said I’d sell you an Apple MacBook Air for $100, you wouldn’t buy it, because you’d definitely question the quality. TRUTH: Volume is created by customer segmentation, charging different sets of customers different prices, and thus increasing volume and revenue.
  • 42.  Myth #3: We need to charge lower than everyone else  This is quite possibly the biggest misconception. A race to the bottom is one of the worst ways to compete, because you end up underpricing and losing out on your customer segment who begin to question your quality or revenue while your customer segment continues to buy.  Lower prices equals lower revenue rates, which means the number of sales must increase to cover the loss. Obvious, yes, but it needed to be stated.  Additionally, a smaller price tag doesn’t mean automatically consumers will flock towards your product. For example, if BMW suddenly sold its cars for $35,000 instead of whatever ridiculous number they’re priced at now, would that necessarily increase its revenues?  Possibly in the short term, but in the long term they would begin to compete with cars made by Honda and Toyota who already have the market cornered. BMW would also lose out on the consumers that put luxury value in the premium pricing of their cars. TRUTH: Underpricing is rarely the solution to any pricing woes. You end up dropping into a different segment of customer and lose out on cash from your current customers.
  • 43.  Myth #4: Pricing isn’t important  Pricing is the most important aspect of your business. Period. We explained why in this pricing post, but to reiterate: a 1% improvement in pricing results in an average increase of 11.1% in operating profit.  No other business lever has that impact, not cost optimization, volume increases, or anything. The answer is pricing. Of course, business owners are pretty busy people. Especially with small businesses that require constant diligence, which pushes pricing to the side, because an optimized strategy does take some time and effort.  Yet, advertising, brand awareness, and the like all sum up to your price, so you should make sure you have the right one. Stop guessing, and start taking it seriously today. TRUTH: Pricing is, bar none, the lever in your business that has the highest impact on the most important cell on your end of month spreadsheet - your revenue. You need to take it seriously.
  • 44.  Myth #5: Price optimization is difficult  In fact, calculating fairly accurate upper and lower bounds for your pricing is very possible to do from just looking at current sales, your loss rate, and speaking with a few customers (which you should be doing already).  When you want to optimize even further, value based pricing brings a much higher confidence interval, taking research of consumer’s wilingess to pay and calculating price bands. Those math models may not be fun, but they get results and there are plenty of resources out there. TRUTH: Optimizing your pricing isn’t difficult, it just takes some initiative.
  • 45. Myth#6: Price optimization will cost a fortune  As we explained previously, you don’t need to hire anyone or buy any software to get things moving on your pricing strategy  For small businesses, it is often difficult to conduct this type of research on their own, due to resource limitations. Not to worry, because there are pricing companies that specialize in aiding these smaller groups. They are usually characterized by less expensive services and quicker results. Remember though, you can get things moving by simply dedicating a small amount of time per week where you prioritize pricing research and optimization. Trust us, a little work can go a long way. TRUTH: Pricing doesn’t have to be an expensive endeavor. There are a lot of cheaper alternatives to expensive consultants, and you can even get the ball moving by simply dedicating a small amount of time to pricing each week.