SlideShare a Scribd company logo
1 of 4
Download to read offline
ExpertSpeak
21
February 2016
www.InfralinePlus.com
CEA’s 18th EPS forecast of 3,500 TWh
by 2030. The INDC is not clear on
whether the proposed 40% target for
non-fossil fuel is based on generation
or capacity. For the purpose of this
analysis, we assume a 40% non-fossil
fuel based generation mix is the target
by 2030.
Nuclear and Hydro generation
additions: INDC does not specify
explicit targets for setting up nuclear
and large hydro (storage or run-of–
river or pump storage) generation.
However, it specifies overall potential
for these two generation sources. Given
the long gestation period associated
with nuclear and large hydro capacity,
we assume that India will continue to
add this capacity at a rate similar to
that seen in the recent past. While total
hydro capacity has been capped at 70
GW, nuclear capacity has been capped
at 30 GW.
Load profile: Over the years,
India’s national average load factor
has increased from ~75% in FY11
to ~85% (less peaky) in FY15; this
change is primarily due to changes in
supply availability. We have assumed
that a similar load profile will continue
in the future.
Wind resource: Wind resource
(state wise) potential as indicated by
NIWE at 100 mt hub height and annual
average capacity factor of 22% to 24%
depending on state. Historical wind
generation profiles of respective states
have been used for future forecast.
Solar resource: Solar resource
(state wise) potential of 400 GW has
India has re-iterated its commitment
to install 175 GW of renewables by
2022 in its Intended Nationally Deter-
mined Contribution (INDC) document
released recently. Additionally, India’s
INDC outlines a vision of reduction
of 33%-35% in emission intensity of
India’s GDP by 2030 from 2005 levels
and achieving 40% of generation based
on non-fossil fuels (i.e. Large Hydro,
Nuclear, Small-Hydro, Wind, Solar PV/
TH and Biomass) by 2030. The INDC
document forecasts average annual
electricity demand growth of 6.7% be-
tween 2012 and 2030 and also outlines
various means of reducing electricity
intensity of GDP. These ambitious ob-
jectives are bound to have wide ranging
ramifications for the power system and
across the spectrum of stakeholders.
INDC targets and related
assumptions
Since the specific details of how these
targets will be met are not very clear
right now, our analysis employs some
assumptions to complete the picture.
Electricity demand ~20% lower
than 18th EPS forecast: In 2014,
with per capita consumption of around
900 kWh/person, India’s electricity
consumption stood at 1,060 TWh.
Assuming YoY growths of 6.7% (2014
to 2030), India’s electricity demand is
expected to reach about 3,000 TWh
by 2030 which is ~20% lower than
Gurpreet Chugh, Consulting
Director and Ashish Singla,
Senior Consultant, ICF
International, analyses the
INDCs submitted by India
recently and its implications for
the power sector.
Coal will continue to dominate
power generation at 60% by 2030
Gurpreet Chugh, Consulting Director,
ICF International
Ashish Singla, Senior Consultant,
ICF International
If the government can
support or lower the
capital investment
required in setting up
RE-based capacity
(either by funding
directly through VGF
or by introducing
innovative market
designs), the overall
system cost can be
significantly lower.
22
ExpertSpeak
February 2016
www.InfralinePlus.com
Modelling Results and
Analysis
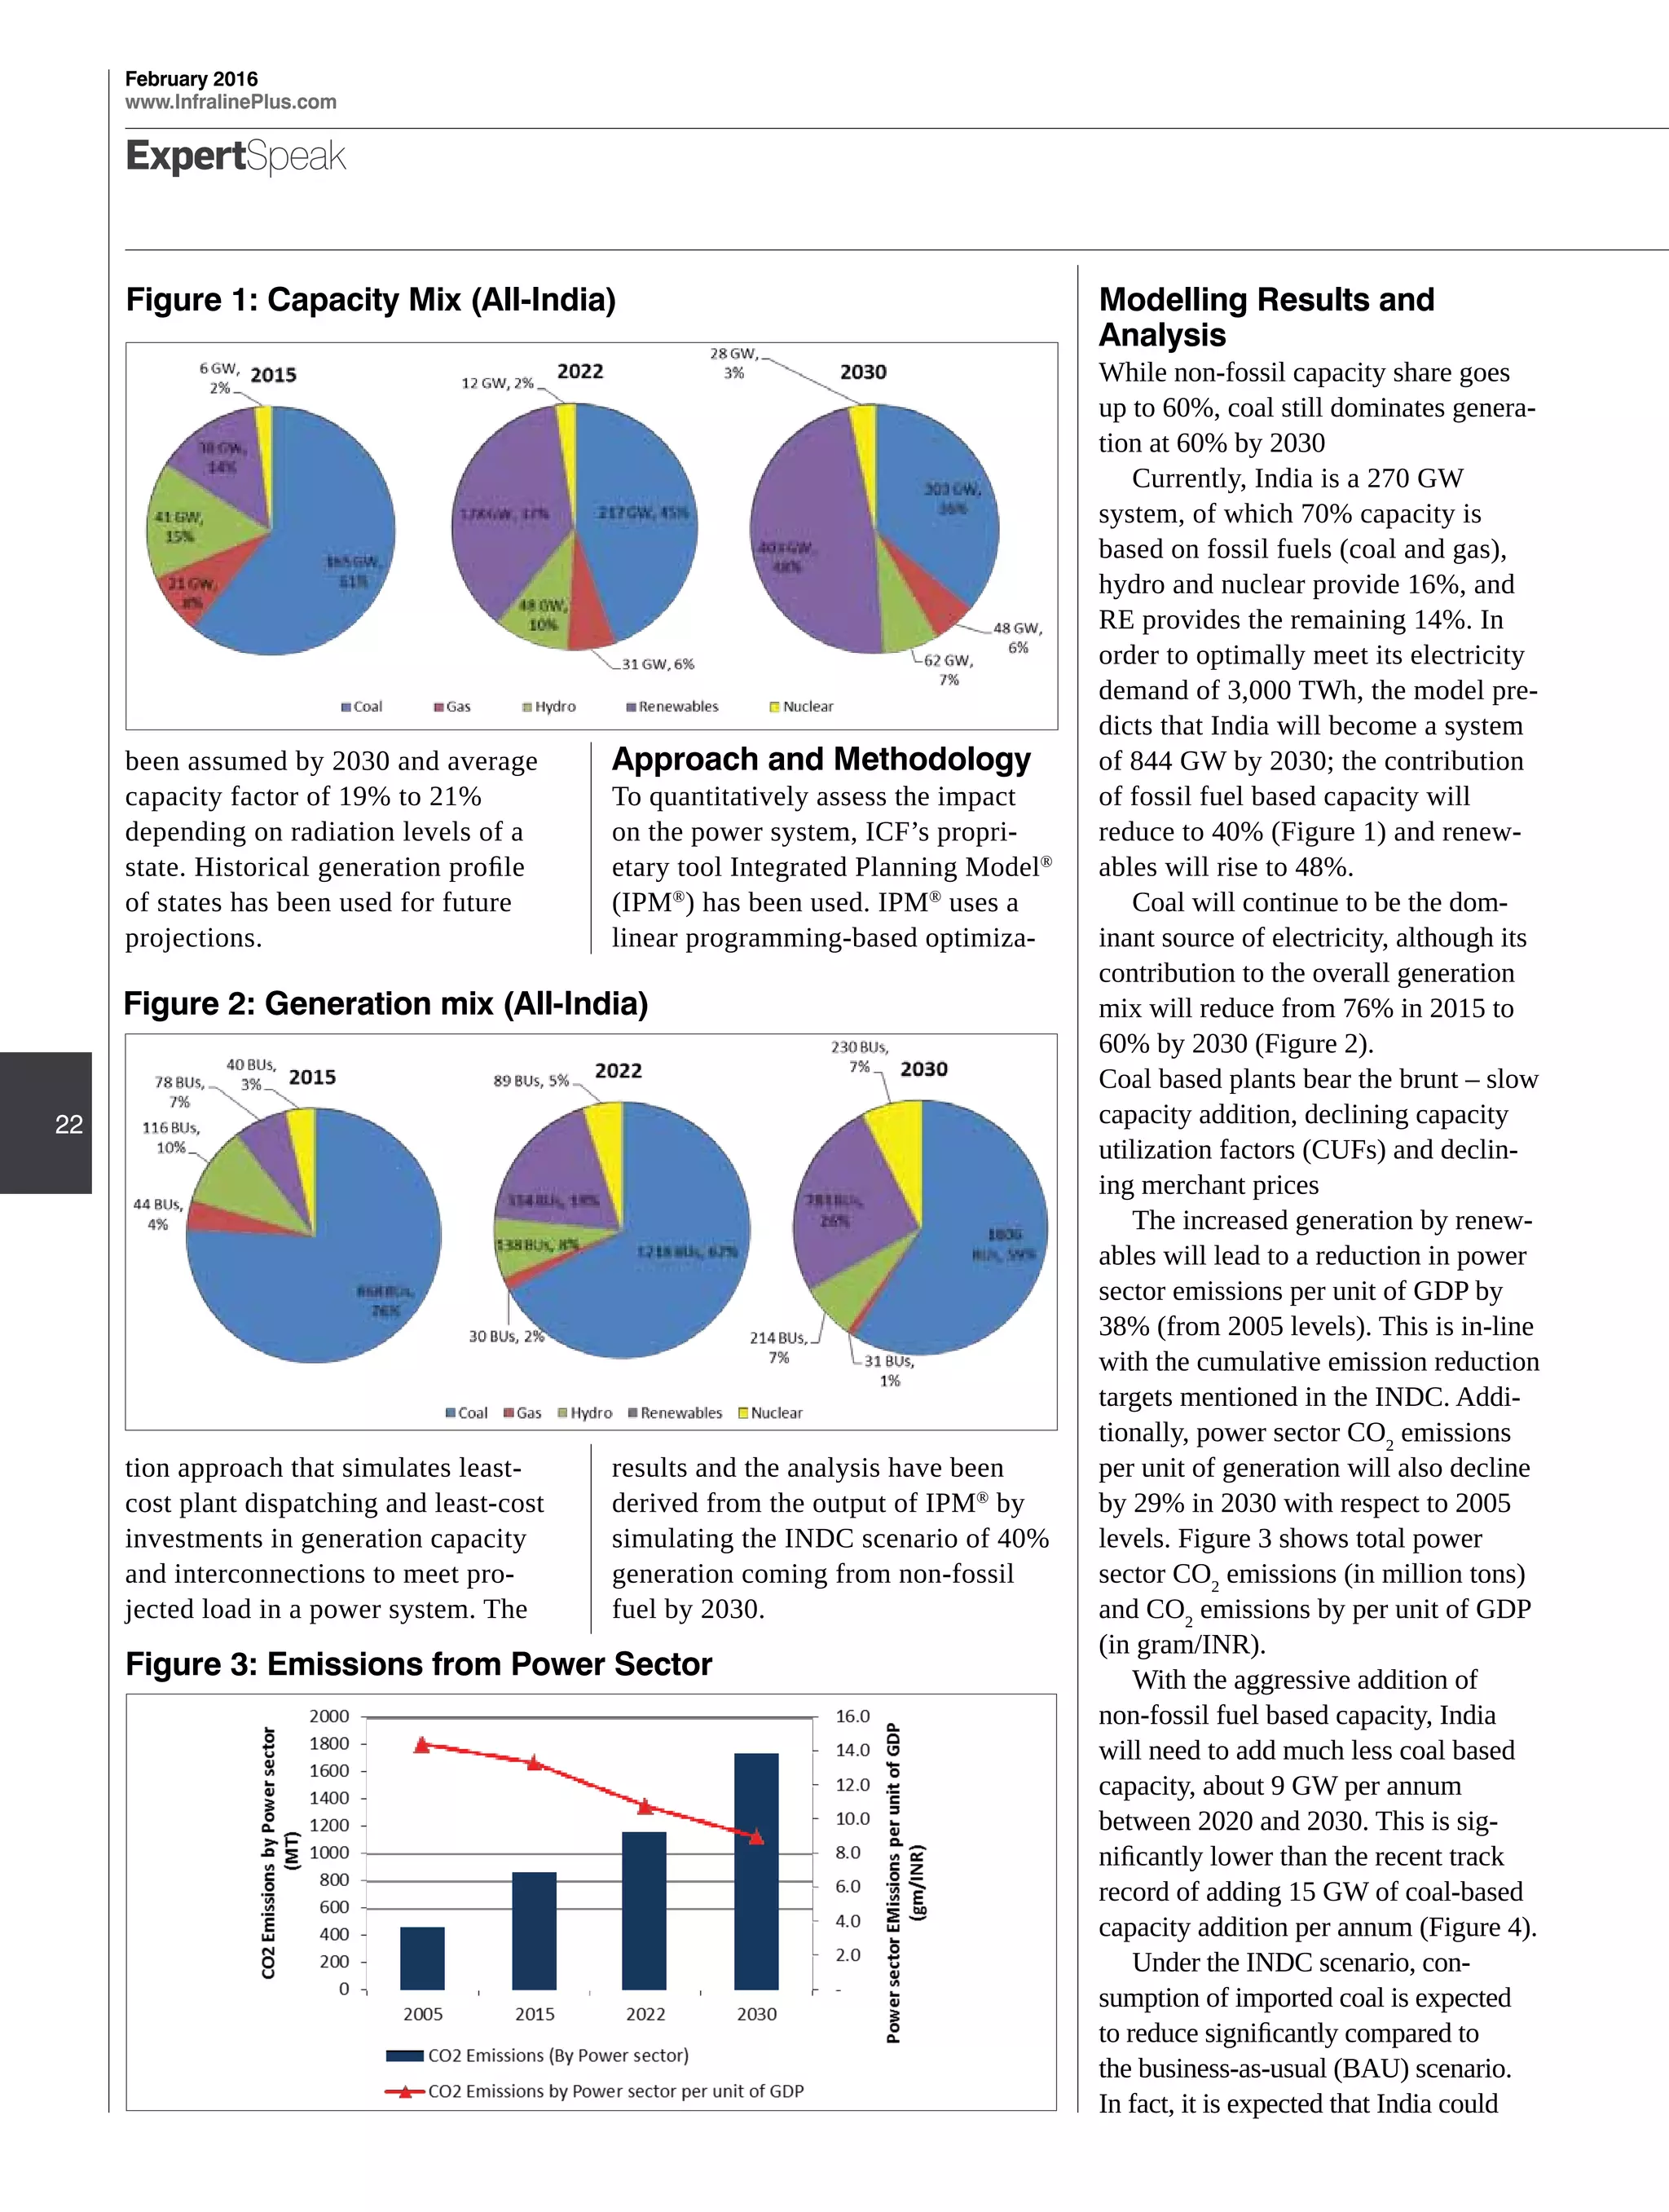
While non-fossil capacity share goes
up to 60%, coal still dominates genera-
tion at 60% by 2030
Currently, India is a 270 GW
system, of which 70% capacity is
based on fossil fuels (coal and gas),
hydro and nuclear provide 16%, and
RE provides the remaining 14%. In
order to optimally meet its electricity
demand of 3,000 TWh, the model pre-
dicts that India will become a system
of 844 GW by 2030; the contribution
of fossil fuel based capacity will
reduce to 40% (Figure 1) and renew-
ables will rise to 48%.
Coal will continue to be the dom-
inant source of electricity, although its
contribution to the overall generation
mix will reduce from 76% in 2015 to
60% by 2030 (Figure 2).
Coal based plants bear the brunt – slow
capacity addition, declining capacity
utilization factors (CUFs) and declin-
ing merchant prices
The increased generation by renew-
ables will lead to a reduction in power
sector emissions per unit of GDP by
38% (from 2005 levels). This is in-line
with the cumulative emission reduction
targets mentioned in the INDC. Addi-
tionally, power sector CO2
emissions
per unit of generation will also decline
by 29% in 2030 with respect to 2005
levels. Figure 3 shows total power
sector CO2
emissions (in million tons)
and CO2
emissions by per unit of GDP
(in gram/INR).
With the aggressive addition of
non-fossil fuel based capacity, India
will need to add much less coal based
capacity, about 9 GW per annum
between 2020 and 2030. This is sig-
nificantly lower than the recent track
record of adding 15 GW of coal-based
capacity addition per annum (Figure 4).
Under the INDC scenario, con-
sumption of imported coal is expected
to reduce significantly compared to
the business-as-usual (BAU) scenario.
In fact, it is expected that India could
been assumed by 2030 and average
capacity factor of 19% to 21%
depending on radiation levels of a
state. Historical generation profile
of states has been used for future
projections.
Approach and Methodology
To quantitatively assess the impact
on the power system, ICF’s propri-
etary tool Integrated Planning Model®
(IPM®
) has been used. IPM®
uses a
linear programming-based optimiza-
Figure 1: Capacity Mix (All-India)
Figure 2: Generation mix (All-India)
Figure 3: Emissions from Power Sector
tion approach that simulates least-
cost plant dispatching and least-cost
investments in generation capacity
and interconnections to meet pro-
jected load in a power system. The
results and the analysis have been
derived from the output of IPM®
by
simulating the INDC scenario of 40%
generation coming from non-fossil
fuel by 2030.
23
February 2016
www.InfralinePlus.com
The overall value of coal based plants
is expected to decrease primarily
driven by reduced capacity factors and
reduced market prices. While capacity
factors of coal based plants would be
produce a surplus in domestic coal
supply by 2030 (figure 5). In fact, if Coal
India achieves its target of 1 billion ton
of coal production by 2022, India might
produce a coal surplus as early as 2022.
to be in the range of 80% to 85%.
However, capacity utilization of inef-
ficient coal-based plants is expected to
be less than 40%.
More gas-based and hydro
capacity will be needed to manage
variability of renewable energy
With integration of significant
solar and wind capacity into the
system by 2030, the Indian grid will
likely need to add 20 GW of storage
based hydro and 25 GW of gas-based
capacity to manage net variability
of system’s demand and supply.
However, if the system’s load factors
were to change from current levels
of 85% to 75%, and demand were
to become peakier, the balancing
capacity requirement will increase
significantly (Figure 6).
However, this gas-based capacity is
likely to have a much lower PLF and
is likely to operate only during peak
times. Overall gas-based generation
is likely to reduce from 44 BUs in
2015 to 31 BUs in 2030. This clearly
requires a suitable policy to enable gas-
based plants to be set up and used as
peakers (open cycle mode). This also
calls for setting up ancillary service
market which might promote open
cycle gas based (or hydro pump storage
or storage based hydro) power plants
which are compensated for providing
such flexibility to the system
With aggressive renewable capacity
addition, system becomes expensive
India is expected to add 400 GW
of RE based capacity by 2030. Due
to high capital costs, these RE-based
capacities have traditionally relied on
government subsidies in one form or
another. Going forward, reliance on
subsidy schemes (such as FiT, VGF,
accelerated depreciation, Renewable
Purchase Obligation, RECs, etc.) is
expected to continue. Wind and solar
may remain expensive options when
compared to coal-based generation
and, depending on economics, policies
to stimulate RE capacity addition may
need to be sustained.
Figure 4: Year-on-Year Coal Capacity Addition (in GW)
Figure 5: Imported Coal Consumption and Domestic Supply
(for Power Sector)
Figure 6: Gas and Hydro Capacity (All-India Total)
under stress primarily due to increased
RE based generation (which will have
must-run status or self-dispatch),
market prices are expected to decrease.
Moreover, the marginal unit of genera-
tion for the entire system will change
from imported coal to domestic coal.
In the medium to long-term, capacity
utilization of efficient (primarily super-
critical) coal-based plants is expected
24
February 2016
www.InfralinePlus.com
ExpertSpeak
Based on the INDC targets, the
power system will become more
expensive by INR 2,60,000 crores
(as compared to the BAU case). The
increase in system cost would pri-
marily be driven by addition of RE
sources which have higher capital cost
than conventional generating capacity
and higher O&M costs. Although
there would be some savings due to
reduction in fuel costs (i.e., reduction
in coal and gas consumption) and lower
costs of inter-state transmission system,
the increase in capital cost more than
offsets the benefit achieved (Figure 7).
This also means that if the gov-
ernment can support or lower the
capital investment required in setting
up RE-based capacity (either by
funding directly through VGF or by
introducing innovative market designs),
the overall system cost can be signifi-
cantly lower.
Implications for stakeholders
These significant changes will create
opportunities and threats for various
stakeholders. These stakeholders thus
need to understand these implications
and try to realign their strategy to this
new regime, considering many questions:
▪▪ Central planning agencies:
-- How can the demand forecast be
made more systematic?
-- What is more optimal for the
system to add, solar or wind?
-- What are the grid integration/
balancing requirements for systems
where RE additions are primarily
solar versus wind?
-- What policies will best enable use
of existing gas-based capacity in
peaking mode and enable new
plants to be set up in open cycle
mode?
-- In case, India is able to add
significant amount of hydro and
nuclear capacity, how much
Figure 7: Change in Total system Cost (BAU to INDC case) ▪▪ Coal-based capacity
-- How will coal-based assets be
impacted – especially those based
on imported coal and those that
are less efficient?
-- How will closer lender scrutiny of
proposed coal-based capacities,
affect current capacities, the
dispatch levels, and additions?
-- How will EPC majors respond
to slow coal-based capacity
addition?
-- How much coal will we need and
what do we do with the surplus?
▪▪ Gas-based capacity
-- Can the system incentivize gas-
based capacity to operate at very
low utilization to balance the
grid?
-- How will current gas-based
capacity operate?
-- What can change the load factor
significantly, and what impact
will these changes have on gas
demand for power generation?
-- How much capacity is required
for balanced integration of RE
sources and how would it change with
increasing load factors of system,
and for different RE generation
mixes (wind-dominated versus solar–
dominated)?
▪▪ Transmission
-- Which transmission corridors
should be strengthened, and by
how much?
-- How would power flow change
under an RE-dominated scenario
versus the current coal-dominated
scenario?
India’s INDCs represent a sig-
nificant departure from the BAU sce-
nario. Even if these ambitious goals
were not to be fully achieved, the
INDCs have the potential to dramati-
cally shift the India power sector, and
all stakeholders – investors, devel-
opers, EPC players, lenders – need to
review their outlook on the sector and
realign their strategies.
Based on the INDC tar-
gets, the power system
will become more ex-
pensive by INR 2,60,000
crores. The increase in
system cost would pri-
marily be driven by addi-
tion of RE sources which
have higher capital
cost than conventional
generating capacity
and higher OM costs.
Although there would be
some savings due to re-
duction in fuel costs and
lower costs of inter-state
transmission system,
the increase in capital
cost more than offsets
the benefit achieved
The views in the article of the author are personal
For suggestions email at feedback@infraline.com

More Related Content

What's hot

Power sector ,devlopment
Power sector ,devlopmentPower sector ,devlopment
Power sector ,devlopmentBhakti Parida
 
Pathways to Low Carbon Development: Impediments and Opportunities: Nepal
Pathways to Low Carbon Development: Impediments and Opportunities: NepalPathways to Low Carbon Development: Impediments and Opportunities: Nepal
Pathways to Low Carbon Development: Impediments and Opportunities: NepalClimate Action Network South Asia
 
Pakistan Economic Survey Energy 2018-19
Pakistan Economic Survey Energy 2018-19Pakistan Economic Survey Energy 2018-19
Pakistan Economic Survey Energy 2018-19IqraAfaq
 
IRJET-A Review of Renewable Energy Scenario in India
IRJET-A Review of Renewable Energy Scenario in IndiaIRJET-A Review of Renewable Energy Scenario in India
IRJET-A Review of Renewable Energy Scenario in IndiaIRJET Journal
 
Emergence-of-hybrid renewable energy systems
Emergence-of-hybrid renewable energy systemsEmergence-of-hybrid renewable energy systems
Emergence-of-hybrid renewable energy systemsSwarnim Srivastava
 
Accelerating hydropower-development-in-india-for-sustainable-energy-security
Accelerating hydropower-development-in-india-for-sustainable-energy-securityAccelerating hydropower-development-in-india-for-sustainable-energy-security
Accelerating hydropower-development-in-india-for-sustainable-energy-securityProbodh Mallick
 
Vibrant Gujarat Summit Profile for Energy Spectrum Sector
Vibrant Gujarat Summit Profile for Energy Spectrum SectorVibrant Gujarat Summit Profile for Energy Spectrum Sector
Vibrant Gujarat Summit Profile for Energy Spectrum SectorVibrant Gujarat
 
Energy Industry in Turkey by 2014
Energy Industry in Turkey by 2014Energy Industry in Turkey by 2014
Energy Industry in Turkey by 2014FMC Group
 
Vibrant Gujarat - Renewable Energy Sector Profile
Vibrant Gujarat - Renewable Energy Sector ProfileVibrant Gujarat - Renewable Energy Sector Profile
Vibrant Gujarat - Renewable Energy Sector ProfileVibrant Gujarat
 

What's hot (20)

Energy efficiency policy in india
Energy efficiency policy in indiaEnergy efficiency policy in india
Energy efficiency policy in india
 
Power sector ,devlopment
Power sector ,devlopmentPower sector ,devlopment
Power sector ,devlopment
 
Renewable Energy Sector Report - April 2018
Renewable Energy Sector Report - April 2018Renewable Energy Sector Report - April 2018
Renewable Energy Sector Report - April 2018
 
Pathways to Low Carbon Development: Impediments and Opportunities: Nepal
Pathways to Low Carbon Development: Impediments and Opportunities: NepalPathways to Low Carbon Development: Impediments and Opportunities: Nepal
Pathways to Low Carbon Development: Impediments and Opportunities: Nepal
 
Pakistan Economic Survey Energy 2018-19
Pakistan Economic Survey Energy 2018-19Pakistan Economic Survey Energy 2018-19
Pakistan Economic Survey Energy 2018-19
 
Renewable Energy Sector Report September 2017
Renewable Energy Sector Report September 2017Renewable Energy Sector Report September 2017
Renewable Energy Sector Report September 2017
 
IRJET-A Review of Renewable Energy Scenario in India
IRJET-A Review of Renewable Energy Scenario in IndiaIRJET-A Review of Renewable Energy Scenario in India
IRJET-A Review of Renewable Energy Scenario in India
 
Power Sector Report March 2018
Power Sector Report March 2018Power Sector Report March 2018
Power Sector Report March 2018
 
PWC renewable energy report India 2012
PWC renewable energy report India 2012PWC renewable energy report India 2012
PWC renewable energy report India 2012
 
Emergence-of-hybrid renewable energy systems
Emergence-of-hybrid renewable energy systemsEmergence-of-hybrid renewable energy systems
Emergence-of-hybrid renewable energy systems
 
Accelerating hydropower-development-in-india-for-sustainable-energy-security
Accelerating hydropower-development-in-india-for-sustainable-energy-securityAccelerating hydropower-development-in-india-for-sustainable-energy-security
Accelerating hydropower-development-in-india-for-sustainable-energy-security
 
30120140501001
3012014050100130120140501001
30120140501001
 
Power Sector Report - July 2018
Power Sector Report - July 2018Power Sector Report - July 2018
Power Sector Report - July 2018
 
Renewable Energy Sector Report March 2018
Renewable Energy Sector Report March 2018Renewable Energy Sector Report March 2018
Renewable Energy Sector Report March 2018
 
Vibrant Gujarat Summit Profile for Energy Spectrum Sector
Vibrant Gujarat Summit Profile for Energy Spectrum SectorVibrant Gujarat Summit Profile for Energy Spectrum Sector
Vibrant Gujarat Summit Profile for Energy Spectrum Sector
 
Power Sector Repor June 2018
Power Sector Repor June 2018Power Sector Repor June 2018
Power Sector Repor June 2018
 
Power Sector Report February 2018
Power Sector Report February 2018Power Sector Report February 2018
Power Sector Report February 2018
 
Power Sector Report May 2018
Power Sector Report May 2018Power Sector Report May 2018
Power Sector Report May 2018
 
Energy Industry in Turkey by 2014
Energy Industry in Turkey by 2014Energy Industry in Turkey by 2014
Energy Industry in Turkey by 2014
 
Vibrant Gujarat - Renewable Energy Sector Profile
Vibrant Gujarat - Renewable Energy Sector ProfileVibrant Gujarat - Renewable Energy Sector Profile
Vibrant Gujarat - Renewable Energy Sector Profile
 

Similar to Expert Speak_Coal_Gurpreet Chugh

Electric Vehicle & Integration with Renewable Energy
Electric Vehicle & Integration with Renewable Energy Electric Vehicle & Integration with Renewable Energy
Electric Vehicle & Integration with Renewable Energy Gensol Engineering Limited
 
Renewable Energy & Alternative Technologies for Rural India
Renewable Energy & Alternative Technologies for Rural IndiaRenewable Energy & Alternative Technologies for Rural India
Renewable Energy & Alternative Technologies for Rural IndiaShantanu Basu
 
CEEW-A-Green-Hydrogen-Economy-for-India-14Dec20.pdf
CEEW-A-Green-Hydrogen-Economy-for-India-14Dec20.pdfCEEW-A-Green-Hydrogen-Economy-for-India-14Dec20.pdf
CEEW-A-Green-Hydrogen-Economy-for-India-14Dec20.pdfRajneesh Katoch
 
National energy policy ppt
National energy policy pptNational energy policy ppt
National energy policy pptghildiyal8811
 
Renewable Energy & Alternative Technologies and Services for Rural India
Renewable Energy & Alternative Technologies and Services for Rural IndiaRenewable Energy & Alternative Technologies and Services for Rural India
Renewable Energy & Alternative Technologies and Services for Rural IndiaShantanu Basu
 
Hydropower in-india-key-enablers-for-better-tomorrow
Hydropower in-india-key-enablers-for-better-tomorrowHydropower in-india-key-enablers-for-better-tomorrow
Hydropower in-india-key-enablers-for-better-tomorrowPriya Zadu
 
REACHING 50% ENERGY FROM RENEWABLES BY 2030
REACHING 50% ENERGY FROM RENEWABLES BY 2030REACHING 50% ENERGY FROM RENEWABLES BY 2030
REACHING 50% ENERGY FROM RENEWABLES BY 2030AurovilleConsulting
 
Lawyer in Vietnam Dr. Oliver Massmann - Vietnam - Power Development Plan 8 - ...
Lawyer in Vietnam Dr. Oliver Massmann - Vietnam - Power Development Plan 8 - ...Lawyer in Vietnam Dr. Oliver Massmann - Vietnam - Power Development Plan 8 - ...
Lawyer in Vietnam Dr. Oliver Massmann - Vietnam - Power Development Plan 8 - ...Dr. Oliver Massmann
 
Market insight: In Context of the Bangladesh Power Sector
Market insight: In Context of the Bangladesh Power SectorMarket insight: In Context of the Bangladesh Power Sector
Market insight: In Context of the Bangladesh Power SectorLightCastle Partners
 
PATHWAYS TO DECARBONISATION – MODELLING TAMIL NADU’S POWER SECTOR DECARBONISA...
PATHWAYS TO DECARBONISATION – MODELLING TAMIL NADU’S POWER SECTOR DECARBONISA...PATHWAYS TO DECARBONISATION – MODELLING TAMIL NADU’S POWER SECTOR DECARBONISA...
PATHWAYS TO DECARBONISATION – MODELLING TAMIL NADU’S POWER SECTOR DECARBONISA...AurovilleConsulting
 
Indian electricity sector
Indian electricity sectorIndian electricity sector
Indian electricity sectorshivraj negi
 
AUROVILLE RENEWABLE ENERGY SOURCING PLAN
AUROVILLE RENEWABLE ENERGY SOURCING PLANAUROVILLE RENEWABLE ENERGY SOURCING PLAN
AUROVILLE RENEWABLE ENERGY SOURCING PLANAurovilleConsulting
 
Energy Scenario in India by Prayaas
Energy Scenario in India by PrayaasEnergy Scenario in India by Prayaas
Energy Scenario in India by Prayaassambhaavnaa
 
ICF ppt India Infrastructure - The road ahead for Power sector 16th May 2016
ICF ppt India Infrastructure - The road ahead for Power sector 16th May 2016ICF ppt India Infrastructure - The road ahead for Power sector 16th May 2016
ICF ppt India Infrastructure - The road ahead for Power sector 16th May 2016Ashish Singla
 
Energy Management andLecture 2 (1).pptx
Energy Management andLecture 2 (1).pptxEnergy Management andLecture 2 (1).pptx
Energy Management andLecture 2 (1).pptxMuhammadAdeelJamil
 
Vietnam energy-outlook-report-2017-eng
Vietnam energy-outlook-report-2017-engVietnam energy-outlook-report-2017-eng
Vietnam energy-outlook-report-2017-engHgamar
 

Similar to Expert Speak_Coal_Gurpreet Chugh (20)

Electric Vehicle & Integration with Renewable Energy
Electric Vehicle & Integration with Renewable Energy Electric Vehicle & Integration with Renewable Energy
Electric Vehicle & Integration with Renewable Energy
 
Renewable Energy & Alternative Technologies for Rural India
Renewable Energy & Alternative Technologies for Rural IndiaRenewable Energy & Alternative Technologies for Rural India
Renewable Energy & Alternative Technologies for Rural India
 
CII-PWC report: Round the Clock Power Supply
CII-PWC report: Round the Clock Power SupplyCII-PWC report: Round the Clock Power Supply
CII-PWC report: Round the Clock Power Supply
 
CEEW-A-Green-Hydrogen-Economy-for-India-14Dec20.pdf
CEEW-A-Green-Hydrogen-Economy-for-India-14Dec20.pdfCEEW-A-Green-Hydrogen-Economy-for-India-14Dec20.pdf
CEEW-A-Green-Hydrogen-Economy-for-India-14Dec20.pdf
 
National energy policy ppt
National energy policy pptNational energy policy ppt
National energy policy ppt
 
Renewable Energy & Alternative Technologies and Services for Rural India
Renewable Energy & Alternative Technologies and Services for Rural IndiaRenewable Energy & Alternative Technologies and Services for Rural India
Renewable Energy & Alternative Technologies and Services for Rural India
 
Hydropower in-india-key-enablers-for-better-tomorrow
Hydropower in-india-key-enablers-for-better-tomorrowHydropower in-india-key-enablers-for-better-tomorrow
Hydropower in-india-key-enablers-for-better-tomorrow
 
REACHING 50% ENERGY FROM RENEWABLES BY 2030
REACHING 50% ENERGY FROM RENEWABLES BY 2030REACHING 50% ENERGY FROM RENEWABLES BY 2030
REACHING 50% ENERGY FROM RENEWABLES BY 2030
 
Lawyer in Vietnam Dr. Oliver Massmann - Vietnam - Power Development Plan 8 - ...
Lawyer in Vietnam Dr. Oliver Massmann - Vietnam - Power Development Plan 8 - ...Lawyer in Vietnam Dr. Oliver Massmann - Vietnam - Power Development Plan 8 - ...
Lawyer in Vietnam Dr. Oliver Massmann - Vietnam - Power Development Plan 8 - ...
 
Market insight: In Context of the Bangladesh Power Sector
Market insight: In Context of the Bangladesh Power SectorMarket insight: In Context of the Bangladesh Power Sector
Market insight: In Context of the Bangladesh Power Sector
 
Making sense of kusum
Making sense of kusumMaking sense of kusum
Making sense of kusum
 
Psmp 2010
Psmp 2010Psmp 2010
Psmp 2010
 
PATHWAYS TO DECARBONISATION – MODELLING TAMIL NADU’S POWER SECTOR DECARBONISA...
PATHWAYS TO DECARBONISATION – MODELLING TAMIL NADU’S POWER SECTOR DECARBONISA...PATHWAYS TO DECARBONISATION – MODELLING TAMIL NADU’S POWER SECTOR DECARBONISA...
PATHWAYS TO DECARBONISATION – MODELLING TAMIL NADU’S POWER SECTOR DECARBONISA...
 
Indian electricity sector
Indian electricity sectorIndian electricity sector
Indian electricity sector
 
AUROVILLE RENEWABLE ENERGY SOURCING PLAN
AUROVILLE RENEWABLE ENERGY SOURCING PLANAUROVILLE RENEWABLE ENERGY SOURCING PLAN
AUROVILLE RENEWABLE ENERGY SOURCING PLAN
 
CII Report on India Power Transmission Industry
CII Report on India Power Transmission IndustryCII Report on India Power Transmission Industry
CII Report on India Power Transmission Industry
 
Energy Scenario in India by Prayaas
Energy Scenario in India by PrayaasEnergy Scenario in India by Prayaas
Energy Scenario in India by Prayaas
 
ICF ppt India Infrastructure - The road ahead for Power sector 16th May 2016
ICF ppt India Infrastructure - The road ahead for Power sector 16th May 2016ICF ppt India Infrastructure - The road ahead for Power sector 16th May 2016
ICF ppt India Infrastructure - The road ahead for Power sector 16th May 2016
 
Energy Management andLecture 2 (1).pptx
Energy Management andLecture 2 (1).pptxEnergy Management andLecture 2 (1).pptx
Energy Management andLecture 2 (1).pptx
 
Vietnam energy-outlook-report-2017-eng
Vietnam energy-outlook-report-2017-engVietnam energy-outlook-report-2017-eng
Vietnam energy-outlook-report-2017-eng
 

Expert Speak_Coal_Gurpreet Chugh

  • 1. ExpertSpeak 21 February 2016 www.InfralinePlus.com CEA’s 18th EPS forecast of 3,500 TWh by 2030. The INDC is not clear on whether the proposed 40% target for non-fossil fuel is based on generation or capacity. For the purpose of this analysis, we assume a 40% non-fossil fuel based generation mix is the target by 2030. Nuclear and Hydro generation additions: INDC does not specify explicit targets for setting up nuclear and large hydro (storage or run-of– river or pump storage) generation. However, it specifies overall potential for these two generation sources. Given the long gestation period associated with nuclear and large hydro capacity, we assume that India will continue to add this capacity at a rate similar to that seen in the recent past. While total hydro capacity has been capped at 70 GW, nuclear capacity has been capped at 30 GW. Load profile: Over the years, India’s national average load factor has increased from ~75% in FY11 to ~85% (less peaky) in FY15; this change is primarily due to changes in supply availability. We have assumed that a similar load profile will continue in the future. Wind resource: Wind resource (state wise) potential as indicated by NIWE at 100 mt hub height and annual average capacity factor of 22% to 24% depending on state. Historical wind generation profiles of respective states have been used for future forecast. Solar resource: Solar resource (state wise) potential of 400 GW has India has re-iterated its commitment to install 175 GW of renewables by 2022 in its Intended Nationally Deter- mined Contribution (INDC) document released recently. Additionally, India’s INDC outlines a vision of reduction of 33%-35% in emission intensity of India’s GDP by 2030 from 2005 levels and achieving 40% of generation based on non-fossil fuels (i.e. Large Hydro, Nuclear, Small-Hydro, Wind, Solar PV/ TH and Biomass) by 2030. The INDC document forecasts average annual electricity demand growth of 6.7% be- tween 2012 and 2030 and also outlines various means of reducing electricity intensity of GDP. These ambitious ob- jectives are bound to have wide ranging ramifications for the power system and across the spectrum of stakeholders. INDC targets and related assumptions Since the specific details of how these targets will be met are not very clear right now, our analysis employs some assumptions to complete the picture. Electricity demand ~20% lower than 18th EPS forecast: In 2014, with per capita consumption of around 900 kWh/person, India’s electricity consumption stood at 1,060 TWh. Assuming YoY growths of 6.7% (2014 to 2030), India’s electricity demand is expected to reach about 3,000 TWh by 2030 which is ~20% lower than Gurpreet Chugh, Consulting Director and Ashish Singla, Senior Consultant, ICF International, analyses the INDCs submitted by India recently and its implications for the power sector. Coal will continue to dominate power generation at 60% by 2030 Gurpreet Chugh, Consulting Director, ICF International Ashish Singla, Senior Consultant, ICF International If the government can support or lower the capital investment required in setting up RE-based capacity (either by funding directly through VGF or by introducing innovative market designs), the overall system cost can be significantly lower.
  • 2. 22 ExpertSpeak February 2016 www.InfralinePlus.com Modelling Results and Analysis While non-fossil capacity share goes up to 60%, coal still dominates genera- tion at 60% by 2030 Currently, India is a 270 GW system, of which 70% capacity is based on fossil fuels (coal and gas), hydro and nuclear provide 16%, and RE provides the remaining 14%. In order to optimally meet its electricity demand of 3,000 TWh, the model pre- dicts that India will become a system of 844 GW by 2030; the contribution of fossil fuel based capacity will reduce to 40% (Figure 1) and renew- ables will rise to 48%. Coal will continue to be the dom- inant source of electricity, although its contribution to the overall generation mix will reduce from 76% in 2015 to 60% by 2030 (Figure 2). Coal based plants bear the brunt – slow capacity addition, declining capacity utilization factors (CUFs) and declin- ing merchant prices The increased generation by renew- ables will lead to a reduction in power sector emissions per unit of GDP by 38% (from 2005 levels). This is in-line with the cumulative emission reduction targets mentioned in the INDC. Addi- tionally, power sector CO2 emissions per unit of generation will also decline by 29% in 2030 with respect to 2005 levels. Figure 3 shows total power sector CO2 emissions (in million tons) and CO2 emissions by per unit of GDP (in gram/INR). With the aggressive addition of non-fossil fuel based capacity, India will need to add much less coal based capacity, about 9 GW per annum between 2020 and 2030. This is sig- nificantly lower than the recent track record of adding 15 GW of coal-based capacity addition per annum (Figure 4). Under the INDC scenario, con- sumption of imported coal is expected to reduce significantly compared to the business-as-usual (BAU) scenario. In fact, it is expected that India could been assumed by 2030 and average capacity factor of 19% to 21% depending on radiation levels of a state. Historical generation profile of states has been used for future projections. Approach and Methodology To quantitatively assess the impact on the power system, ICF’s propri- etary tool Integrated Planning Model® (IPM® ) has been used. IPM® uses a linear programming-based optimiza- Figure 1: Capacity Mix (All-India) Figure 2: Generation mix (All-India) Figure 3: Emissions from Power Sector tion approach that simulates least- cost plant dispatching and least-cost investments in generation capacity and interconnections to meet pro- jected load in a power system. The results and the analysis have been derived from the output of IPM® by simulating the INDC scenario of 40% generation coming from non-fossil fuel by 2030.
  • 3. 23 February 2016 www.InfralinePlus.com The overall value of coal based plants is expected to decrease primarily driven by reduced capacity factors and reduced market prices. While capacity factors of coal based plants would be produce a surplus in domestic coal supply by 2030 (figure 5). In fact, if Coal India achieves its target of 1 billion ton of coal production by 2022, India might produce a coal surplus as early as 2022. to be in the range of 80% to 85%. However, capacity utilization of inef- ficient coal-based plants is expected to be less than 40%. More gas-based and hydro capacity will be needed to manage variability of renewable energy With integration of significant solar and wind capacity into the system by 2030, the Indian grid will likely need to add 20 GW of storage based hydro and 25 GW of gas-based capacity to manage net variability of system’s demand and supply. However, if the system’s load factors were to change from current levels of 85% to 75%, and demand were to become peakier, the balancing capacity requirement will increase significantly (Figure 6). However, this gas-based capacity is likely to have a much lower PLF and is likely to operate only during peak times. Overall gas-based generation is likely to reduce from 44 BUs in 2015 to 31 BUs in 2030. This clearly requires a suitable policy to enable gas- based plants to be set up and used as peakers (open cycle mode). This also calls for setting up ancillary service market which might promote open cycle gas based (or hydro pump storage or storage based hydro) power plants which are compensated for providing such flexibility to the system With aggressive renewable capacity addition, system becomes expensive India is expected to add 400 GW of RE based capacity by 2030. Due to high capital costs, these RE-based capacities have traditionally relied on government subsidies in one form or another. Going forward, reliance on subsidy schemes (such as FiT, VGF, accelerated depreciation, Renewable Purchase Obligation, RECs, etc.) is expected to continue. Wind and solar may remain expensive options when compared to coal-based generation and, depending on economics, policies to stimulate RE capacity addition may need to be sustained. Figure 4: Year-on-Year Coal Capacity Addition (in GW) Figure 5: Imported Coal Consumption and Domestic Supply (for Power Sector) Figure 6: Gas and Hydro Capacity (All-India Total) under stress primarily due to increased RE based generation (which will have must-run status or self-dispatch), market prices are expected to decrease. Moreover, the marginal unit of genera- tion for the entire system will change from imported coal to domestic coal. In the medium to long-term, capacity utilization of efficient (primarily super- critical) coal-based plants is expected
  • 4. 24 February 2016 www.InfralinePlus.com ExpertSpeak Based on the INDC targets, the power system will become more expensive by INR 2,60,000 crores (as compared to the BAU case). The increase in system cost would pri- marily be driven by addition of RE sources which have higher capital cost than conventional generating capacity and higher O&M costs. Although there would be some savings due to reduction in fuel costs (i.e., reduction in coal and gas consumption) and lower costs of inter-state transmission system, the increase in capital cost more than offsets the benefit achieved (Figure 7). This also means that if the gov- ernment can support or lower the capital investment required in setting up RE-based capacity (either by funding directly through VGF or by introducing innovative market designs), the overall system cost can be signifi- cantly lower. Implications for stakeholders These significant changes will create opportunities and threats for various stakeholders. These stakeholders thus need to understand these implications and try to realign their strategy to this new regime, considering many questions: ▪▪ Central planning agencies: -- How can the demand forecast be made more systematic? -- What is more optimal for the system to add, solar or wind? -- What are the grid integration/ balancing requirements for systems where RE additions are primarily solar versus wind? -- What policies will best enable use of existing gas-based capacity in peaking mode and enable new plants to be set up in open cycle mode? -- In case, India is able to add significant amount of hydro and nuclear capacity, how much Figure 7: Change in Total system Cost (BAU to INDC case) ▪▪ Coal-based capacity -- How will coal-based assets be impacted – especially those based on imported coal and those that are less efficient? -- How will closer lender scrutiny of proposed coal-based capacities, affect current capacities, the dispatch levels, and additions? -- How will EPC majors respond to slow coal-based capacity addition? -- How much coal will we need and what do we do with the surplus? ▪▪ Gas-based capacity -- Can the system incentivize gas- based capacity to operate at very low utilization to balance the grid? -- How will current gas-based capacity operate? -- What can change the load factor significantly, and what impact will these changes have on gas demand for power generation? -- How much capacity is required for balanced integration of RE sources and how would it change with increasing load factors of system, and for different RE generation mixes (wind-dominated versus solar– dominated)? ▪▪ Transmission -- Which transmission corridors should be strengthened, and by how much? -- How would power flow change under an RE-dominated scenario versus the current coal-dominated scenario? India’s INDCs represent a sig- nificant departure from the BAU sce- nario. Even if these ambitious goals were not to be fully achieved, the INDCs have the potential to dramati- cally shift the India power sector, and all stakeholders – investors, devel- opers, EPC players, lenders – need to review their outlook on the sector and realign their strategies. Based on the INDC tar- gets, the power system will become more ex- pensive by INR 2,60,000 crores. The increase in system cost would pri- marily be driven by addi- tion of RE sources which have higher capital cost than conventional generating capacity and higher OM costs. Although there would be some savings due to re- duction in fuel costs and lower costs of inter-state transmission system, the increase in capital cost more than offsets the benefit achieved The views in the article of the author are personal For suggestions email at feedback@infraline.com