The document describes different research experiment designs including:
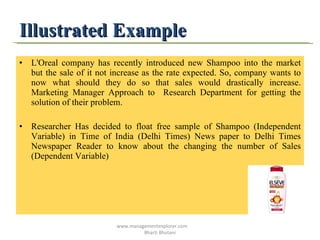
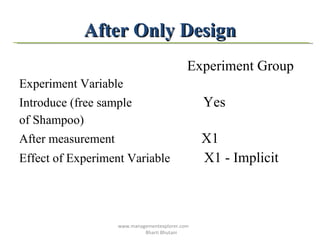
1) An after-only design with a control group to test the effect of a new shampoo sample on sales.
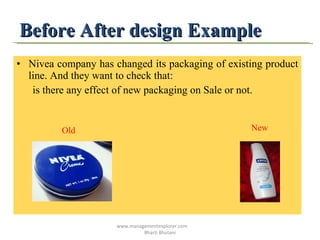
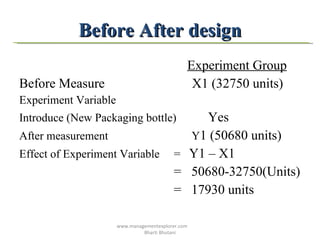
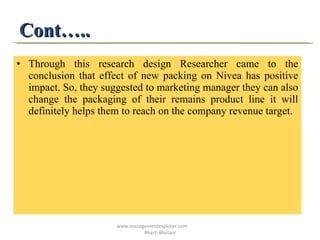
2) A before-after design to test the effect of new packaging on an existing product's sales.
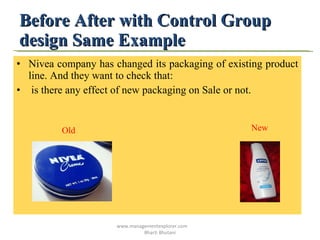
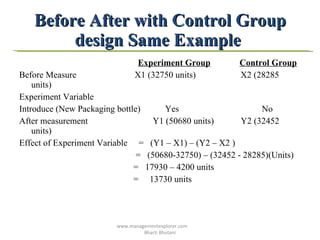
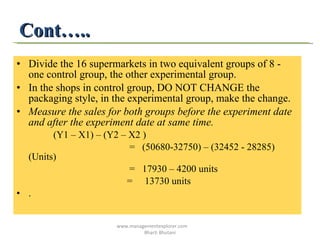
3) A before-after design with a control group to more rigorously test the effect of new packaging while controlling for other factors.
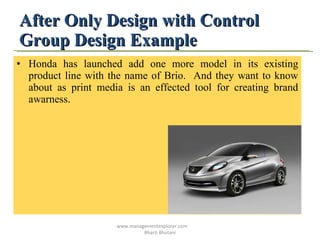
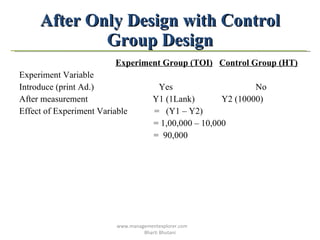
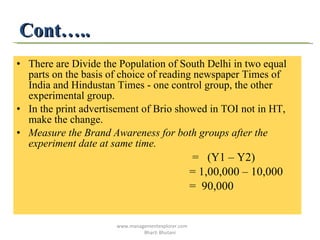
4) An after-only design with a control group to test the effect of print advertisements on brand awareness.
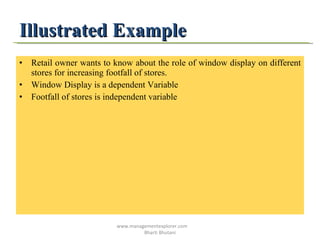
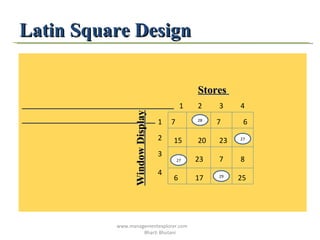
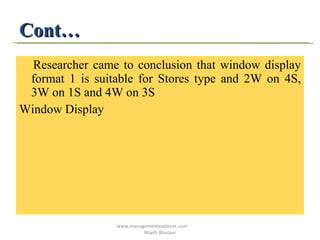
5) A Latin square design to test the effect of different window displays on foot traffic to various stores.