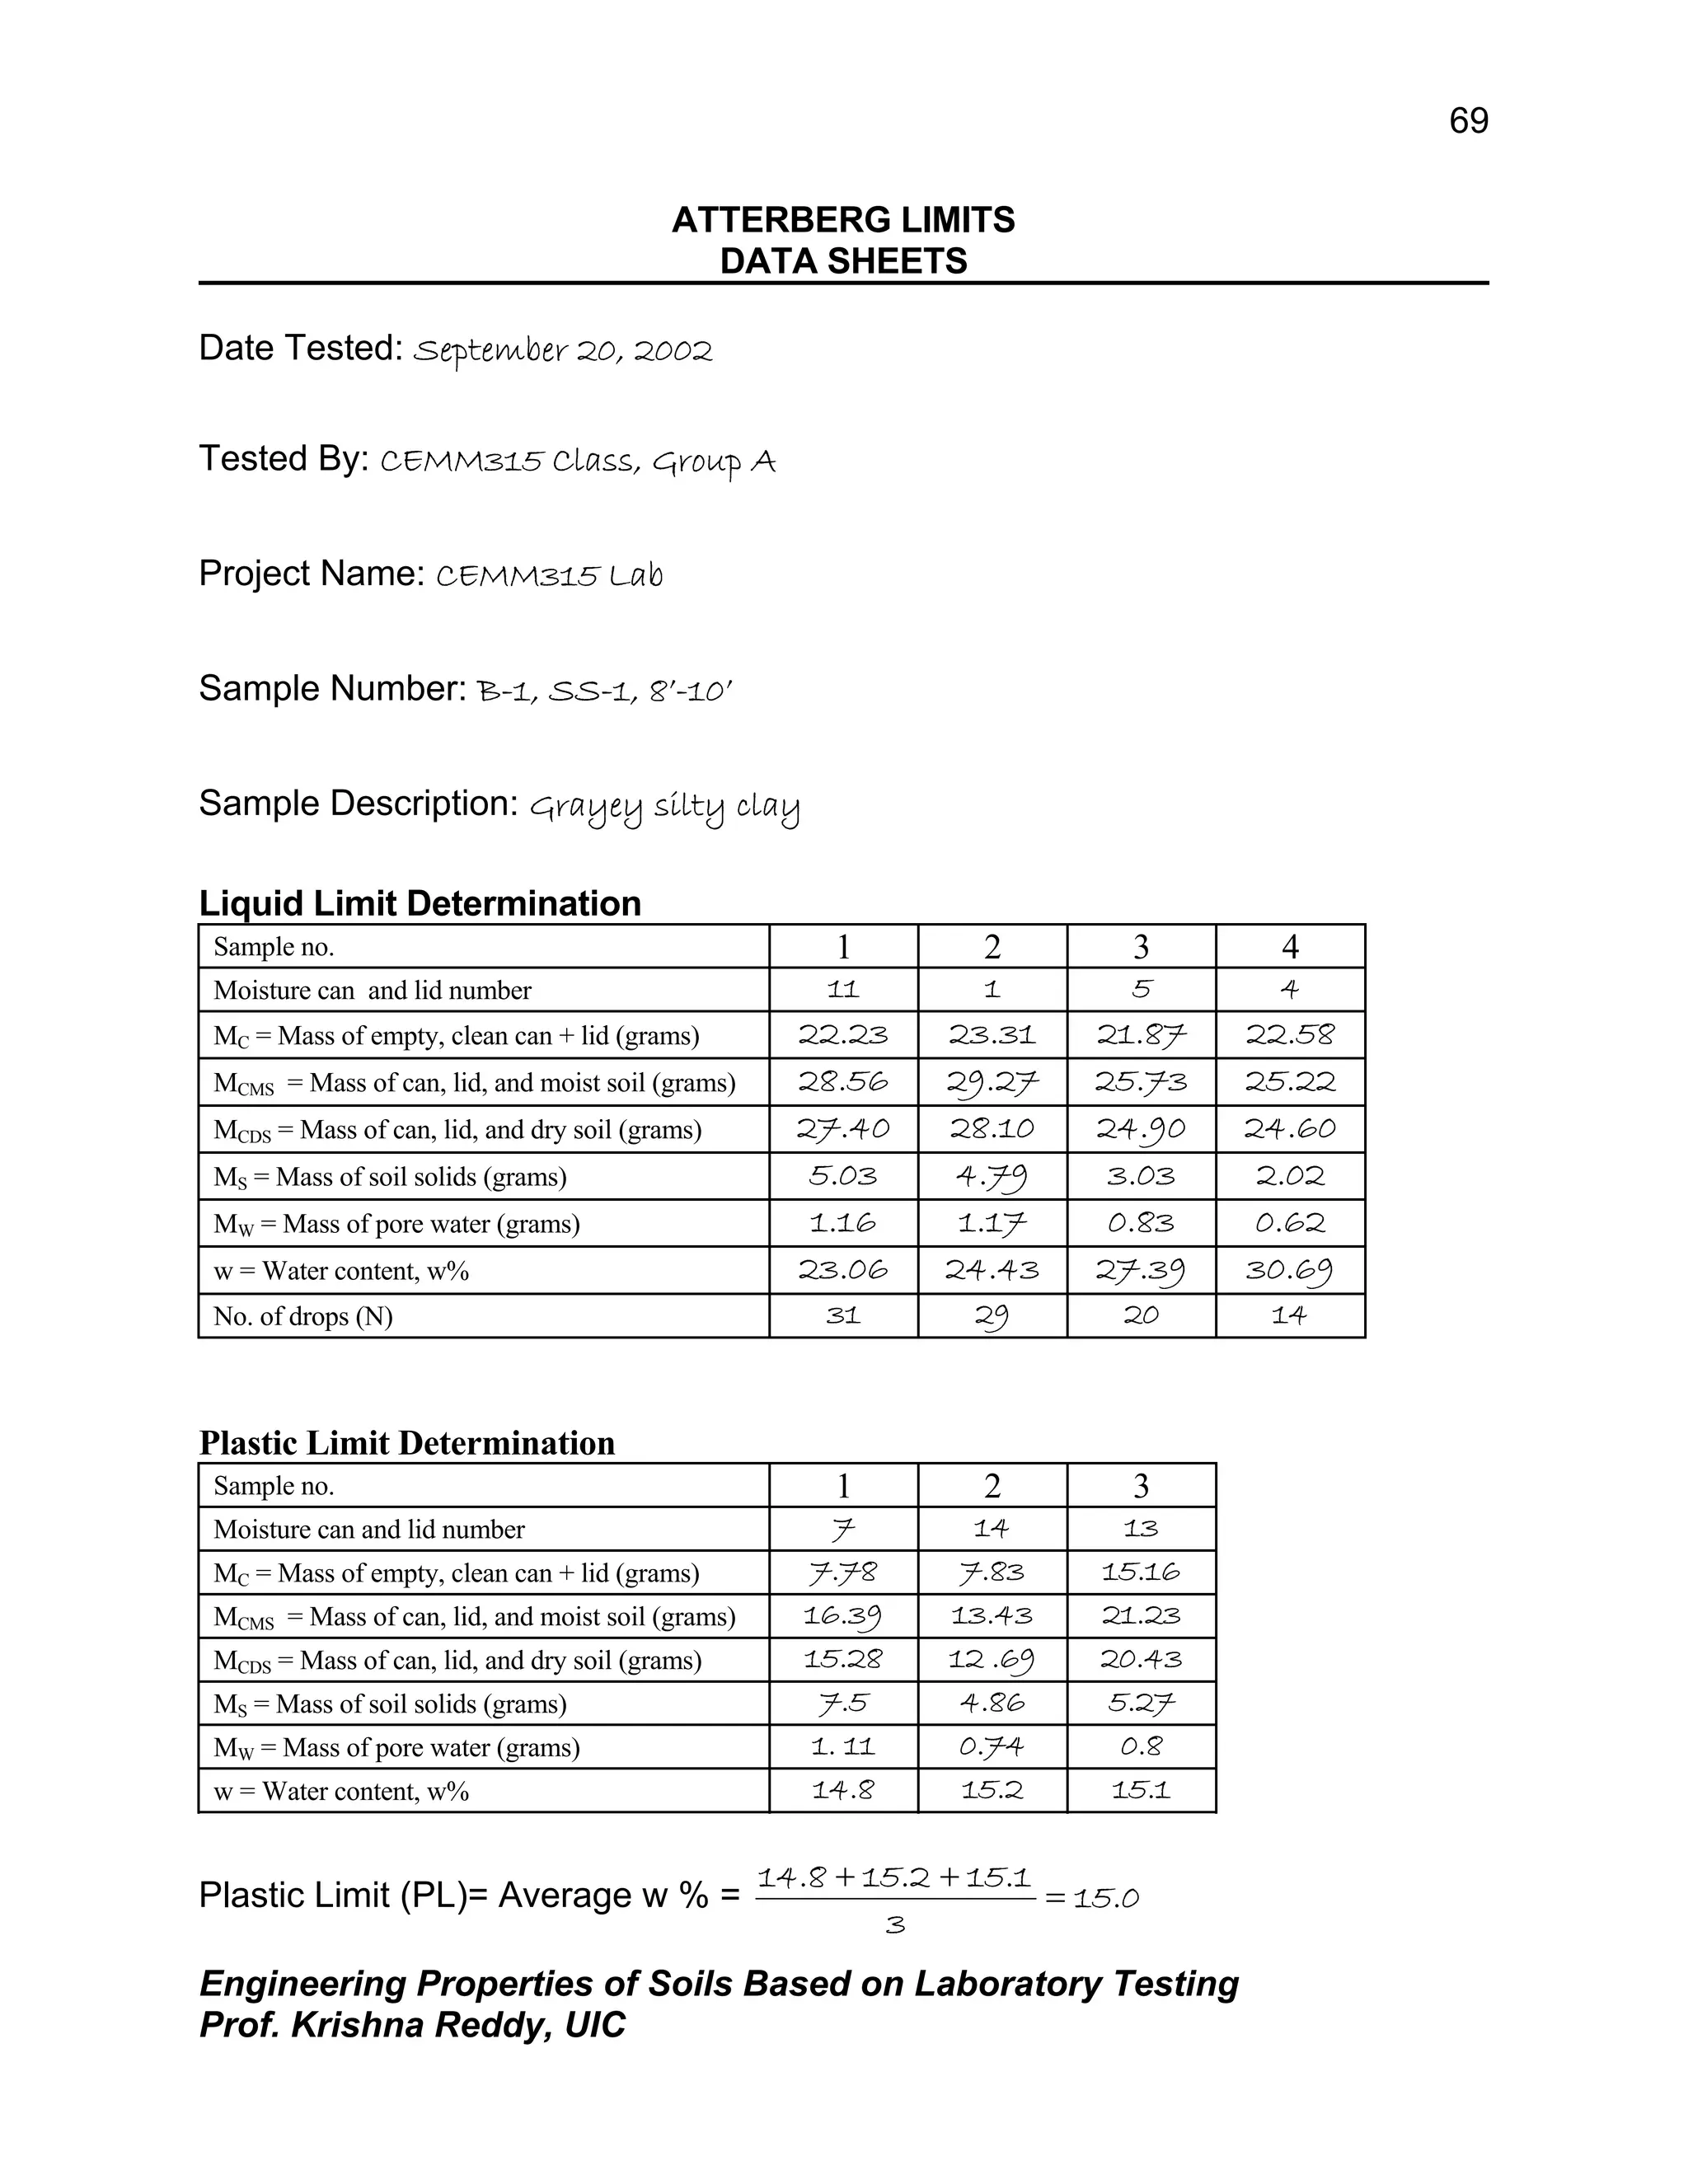
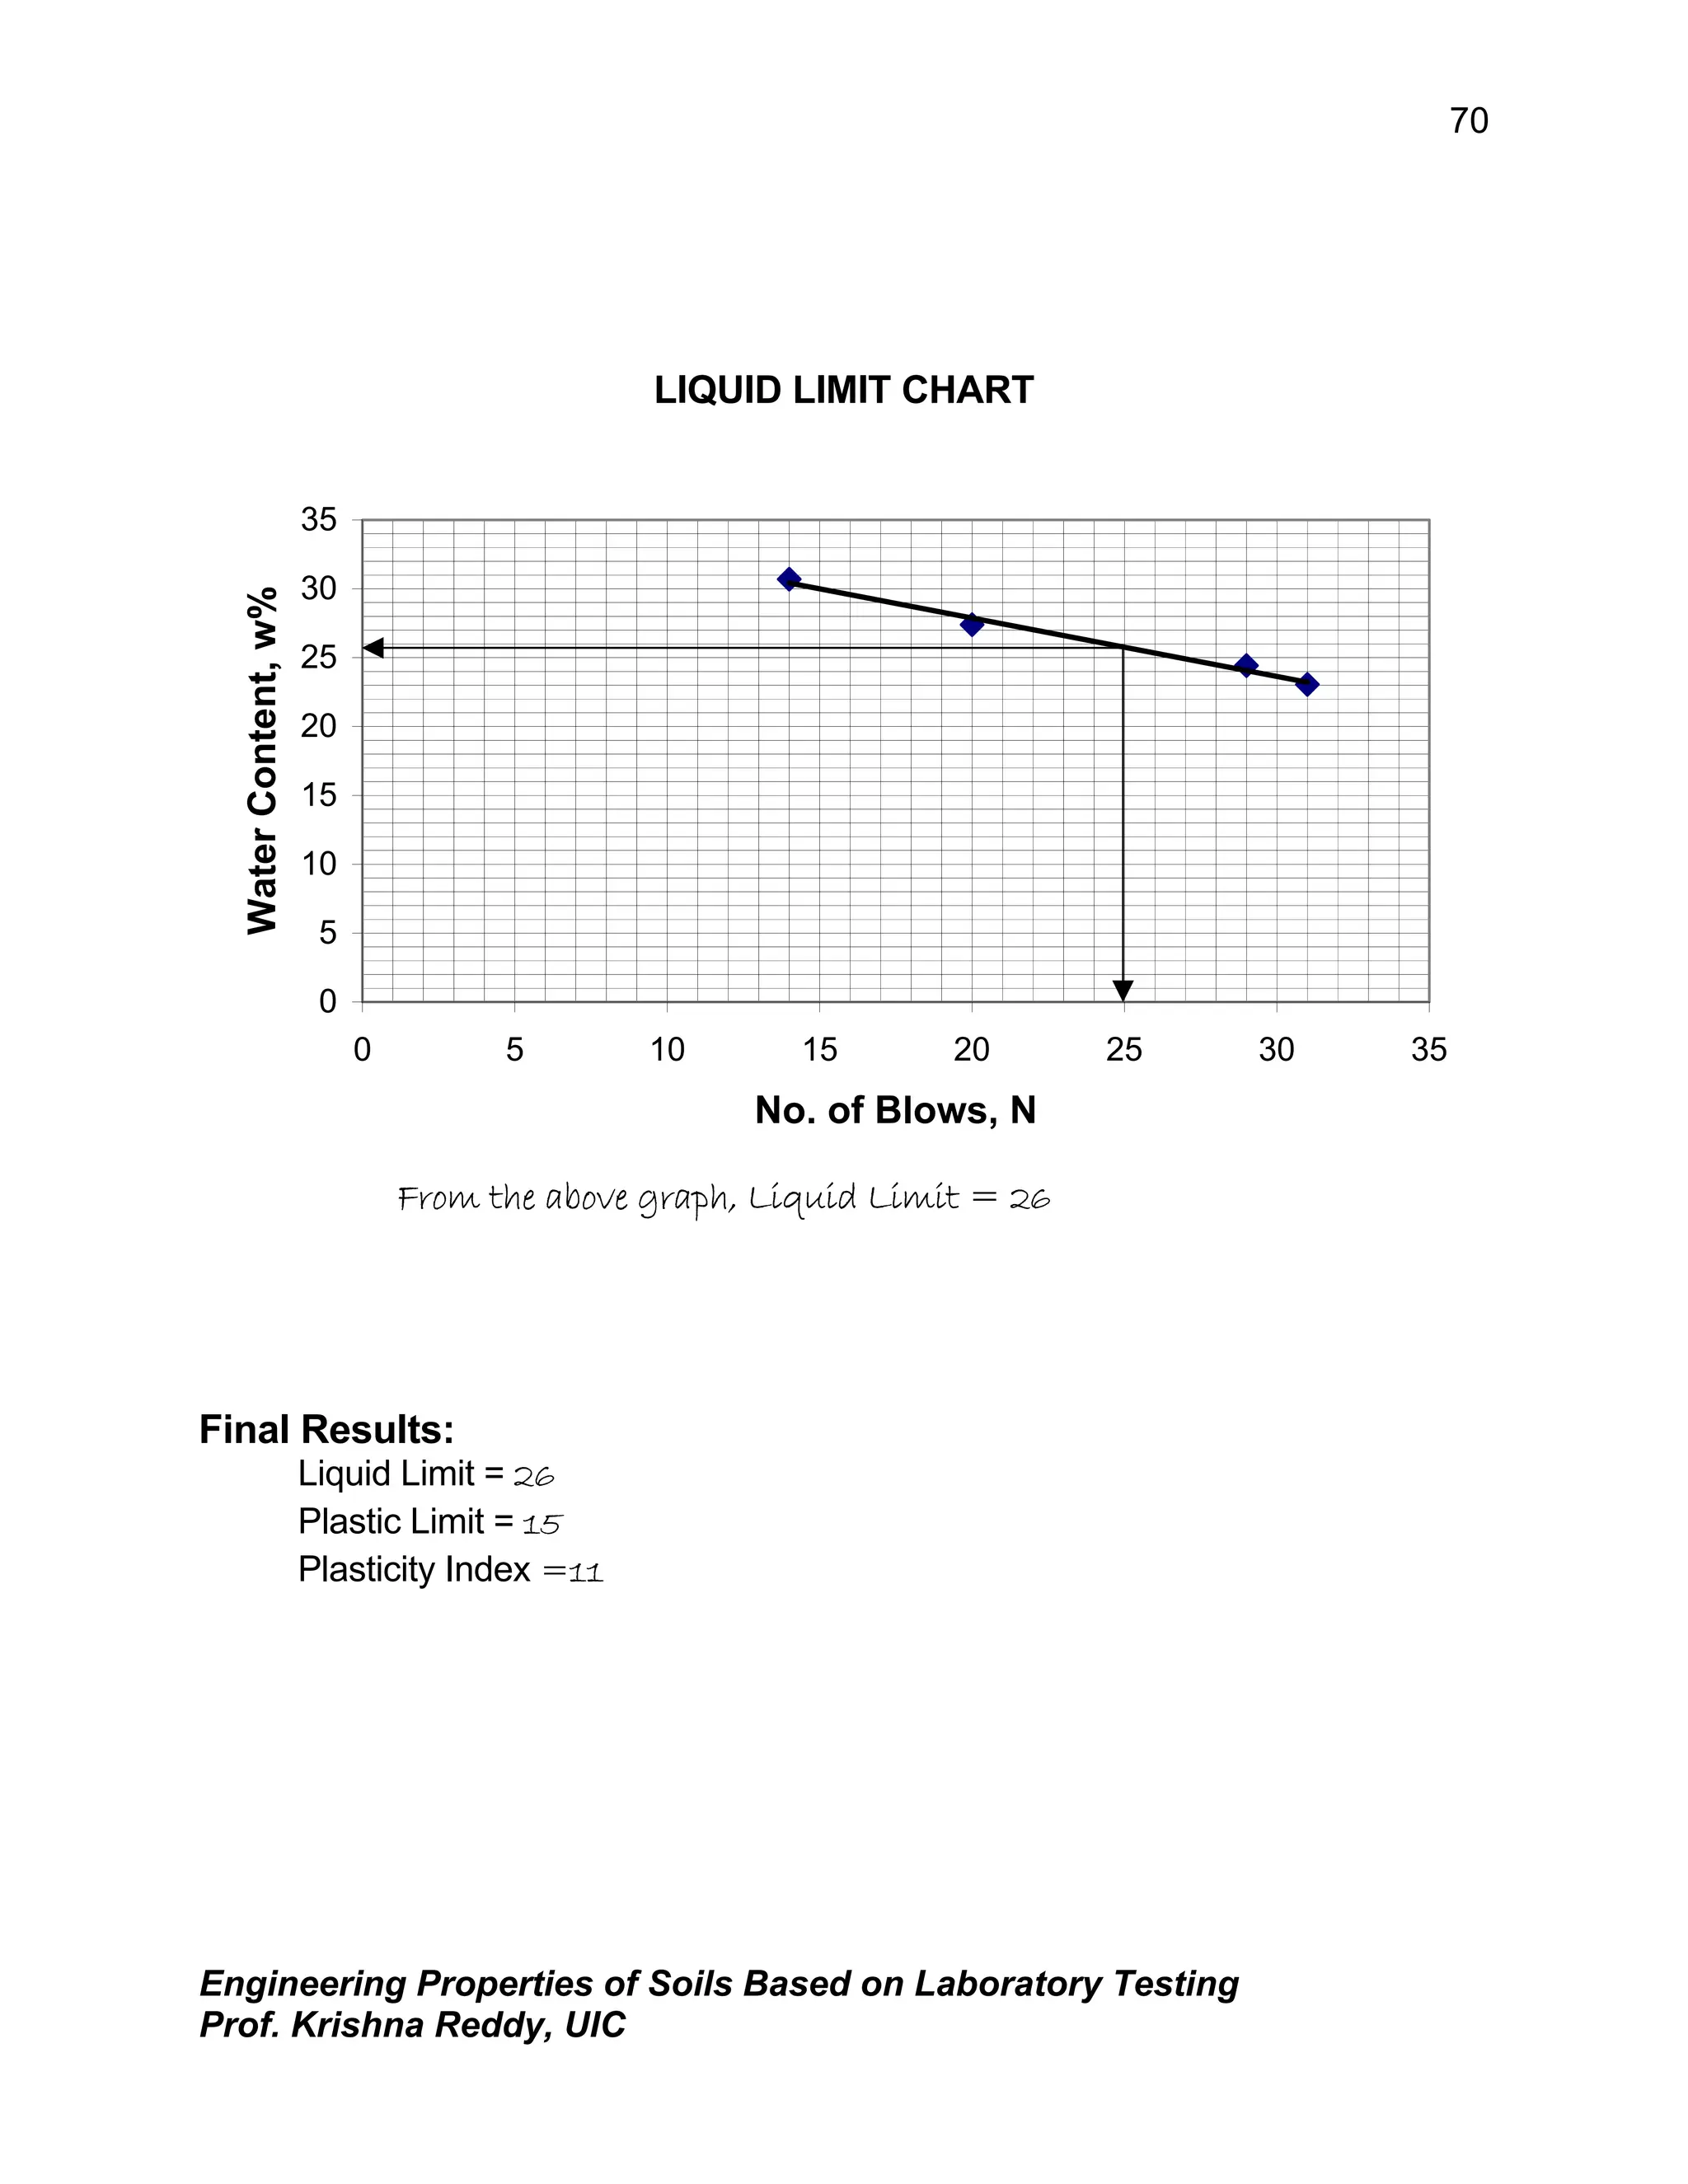
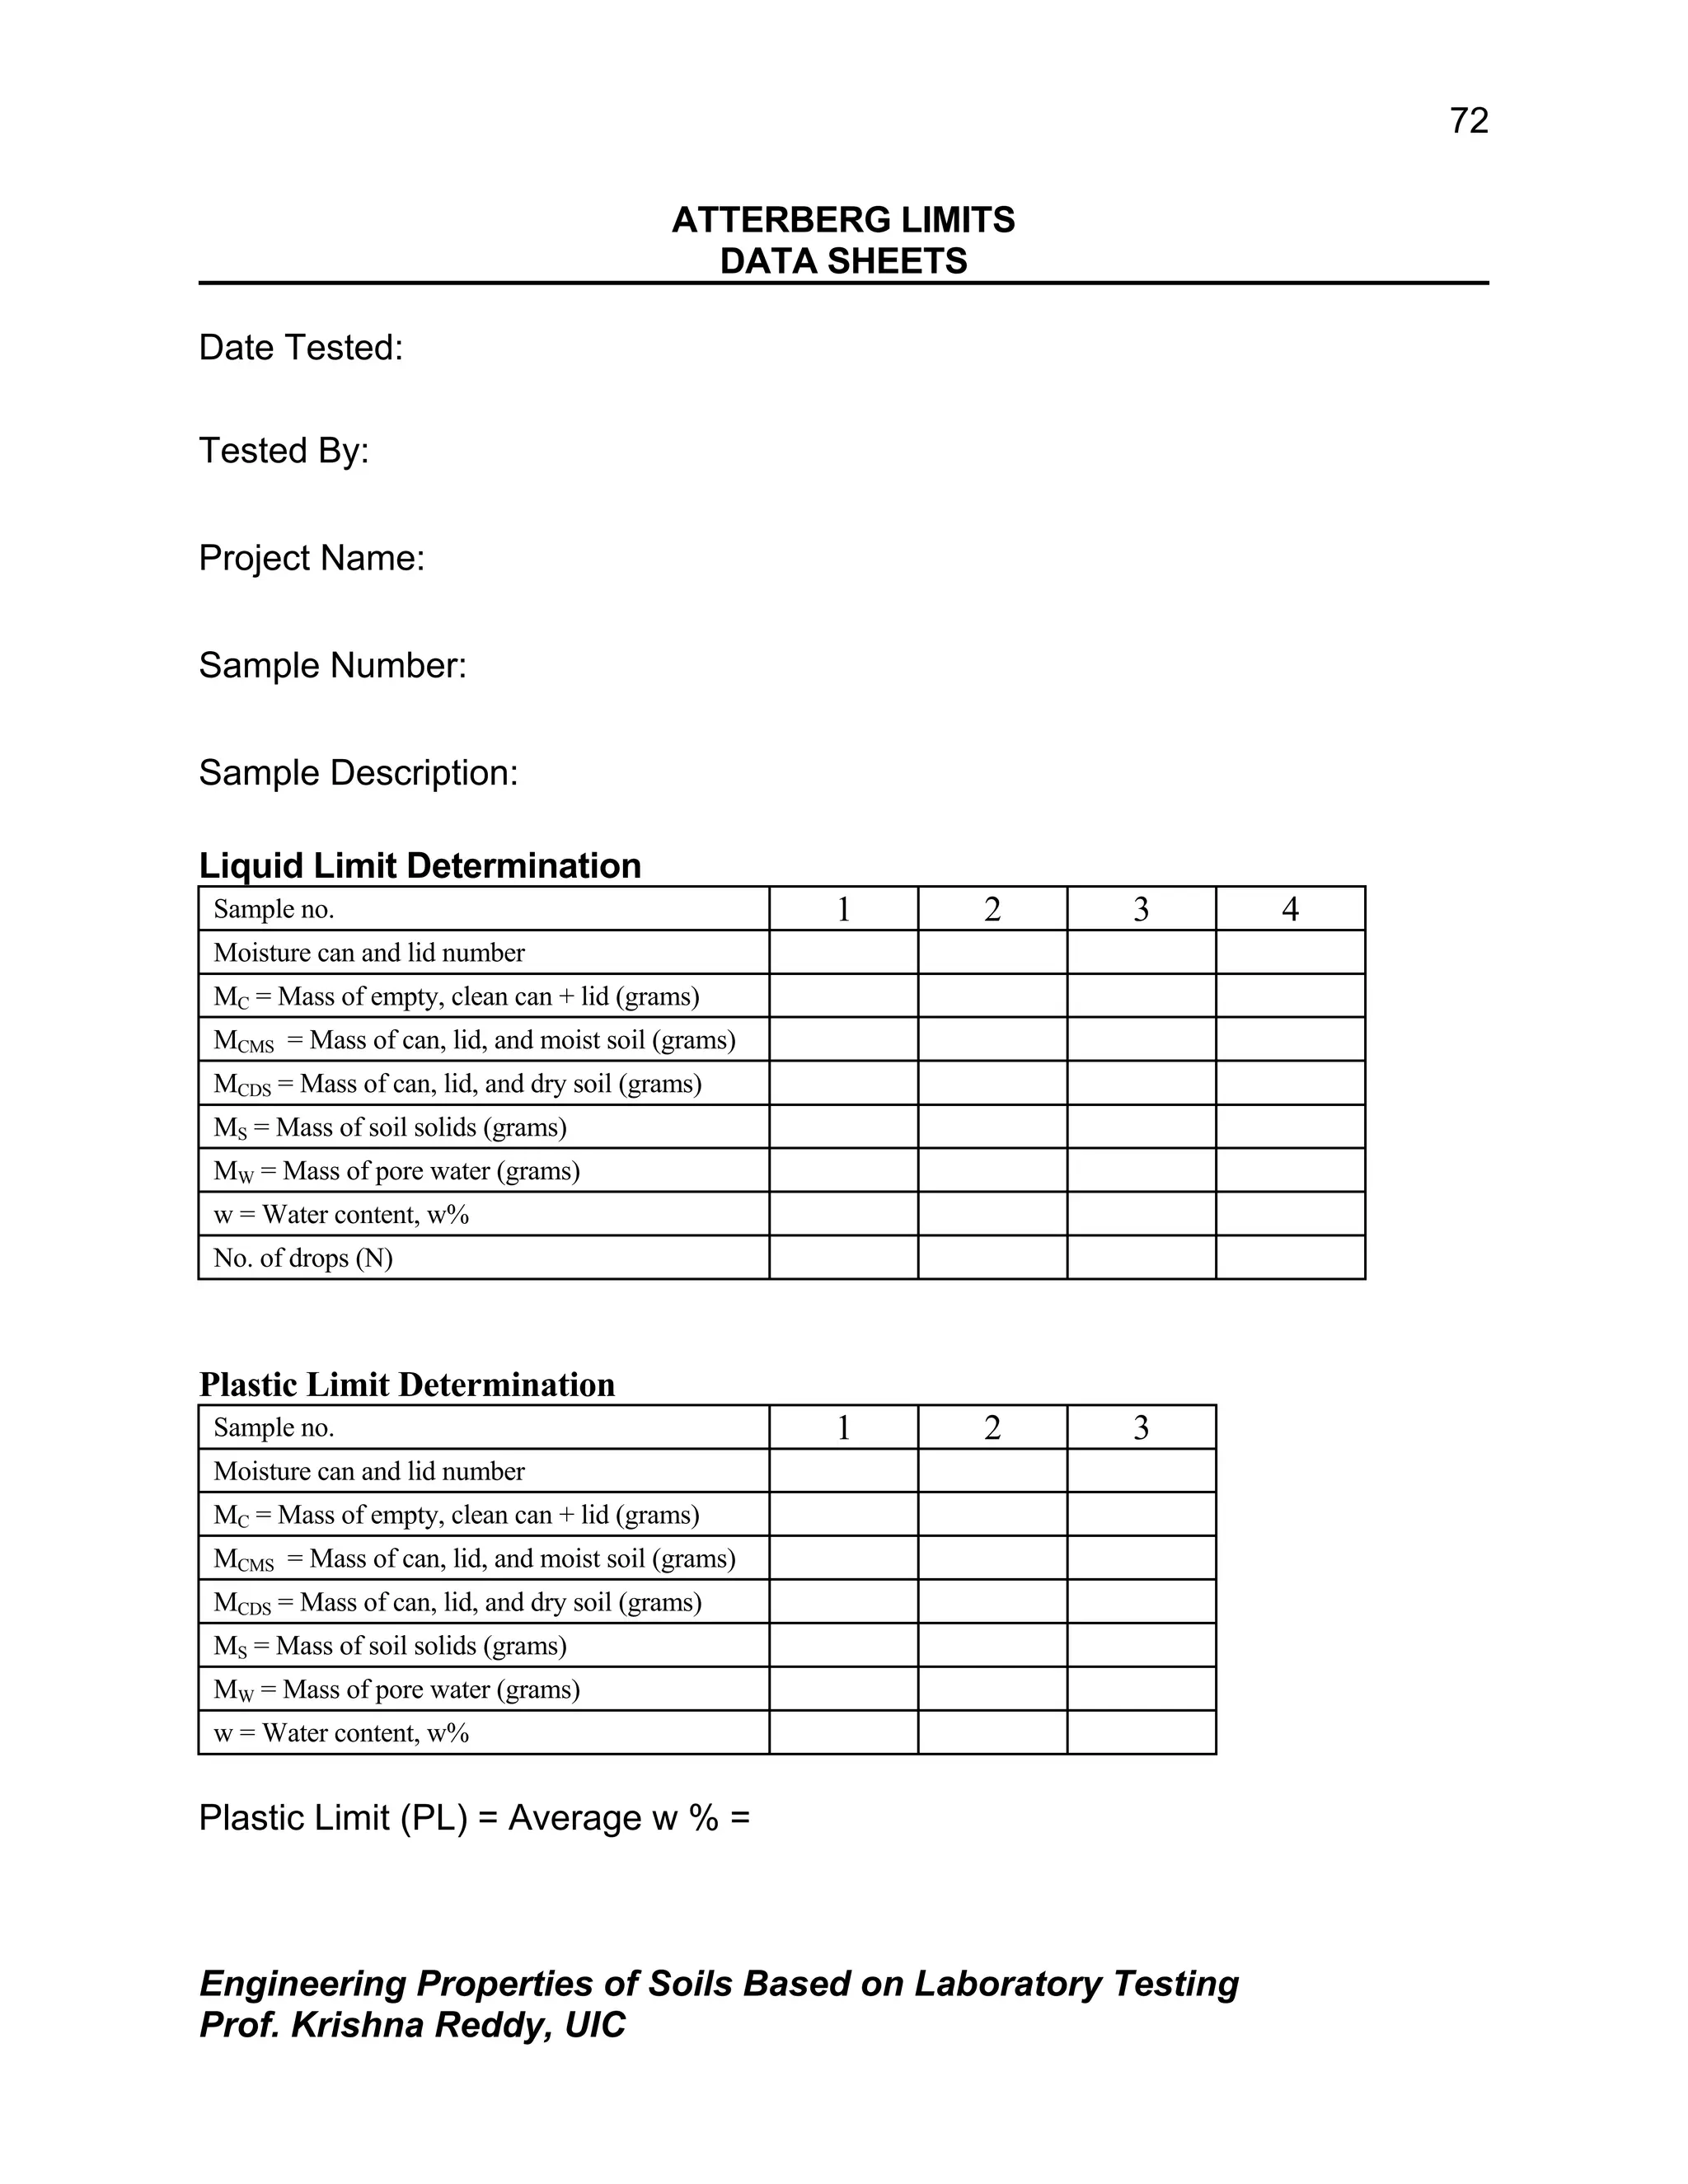
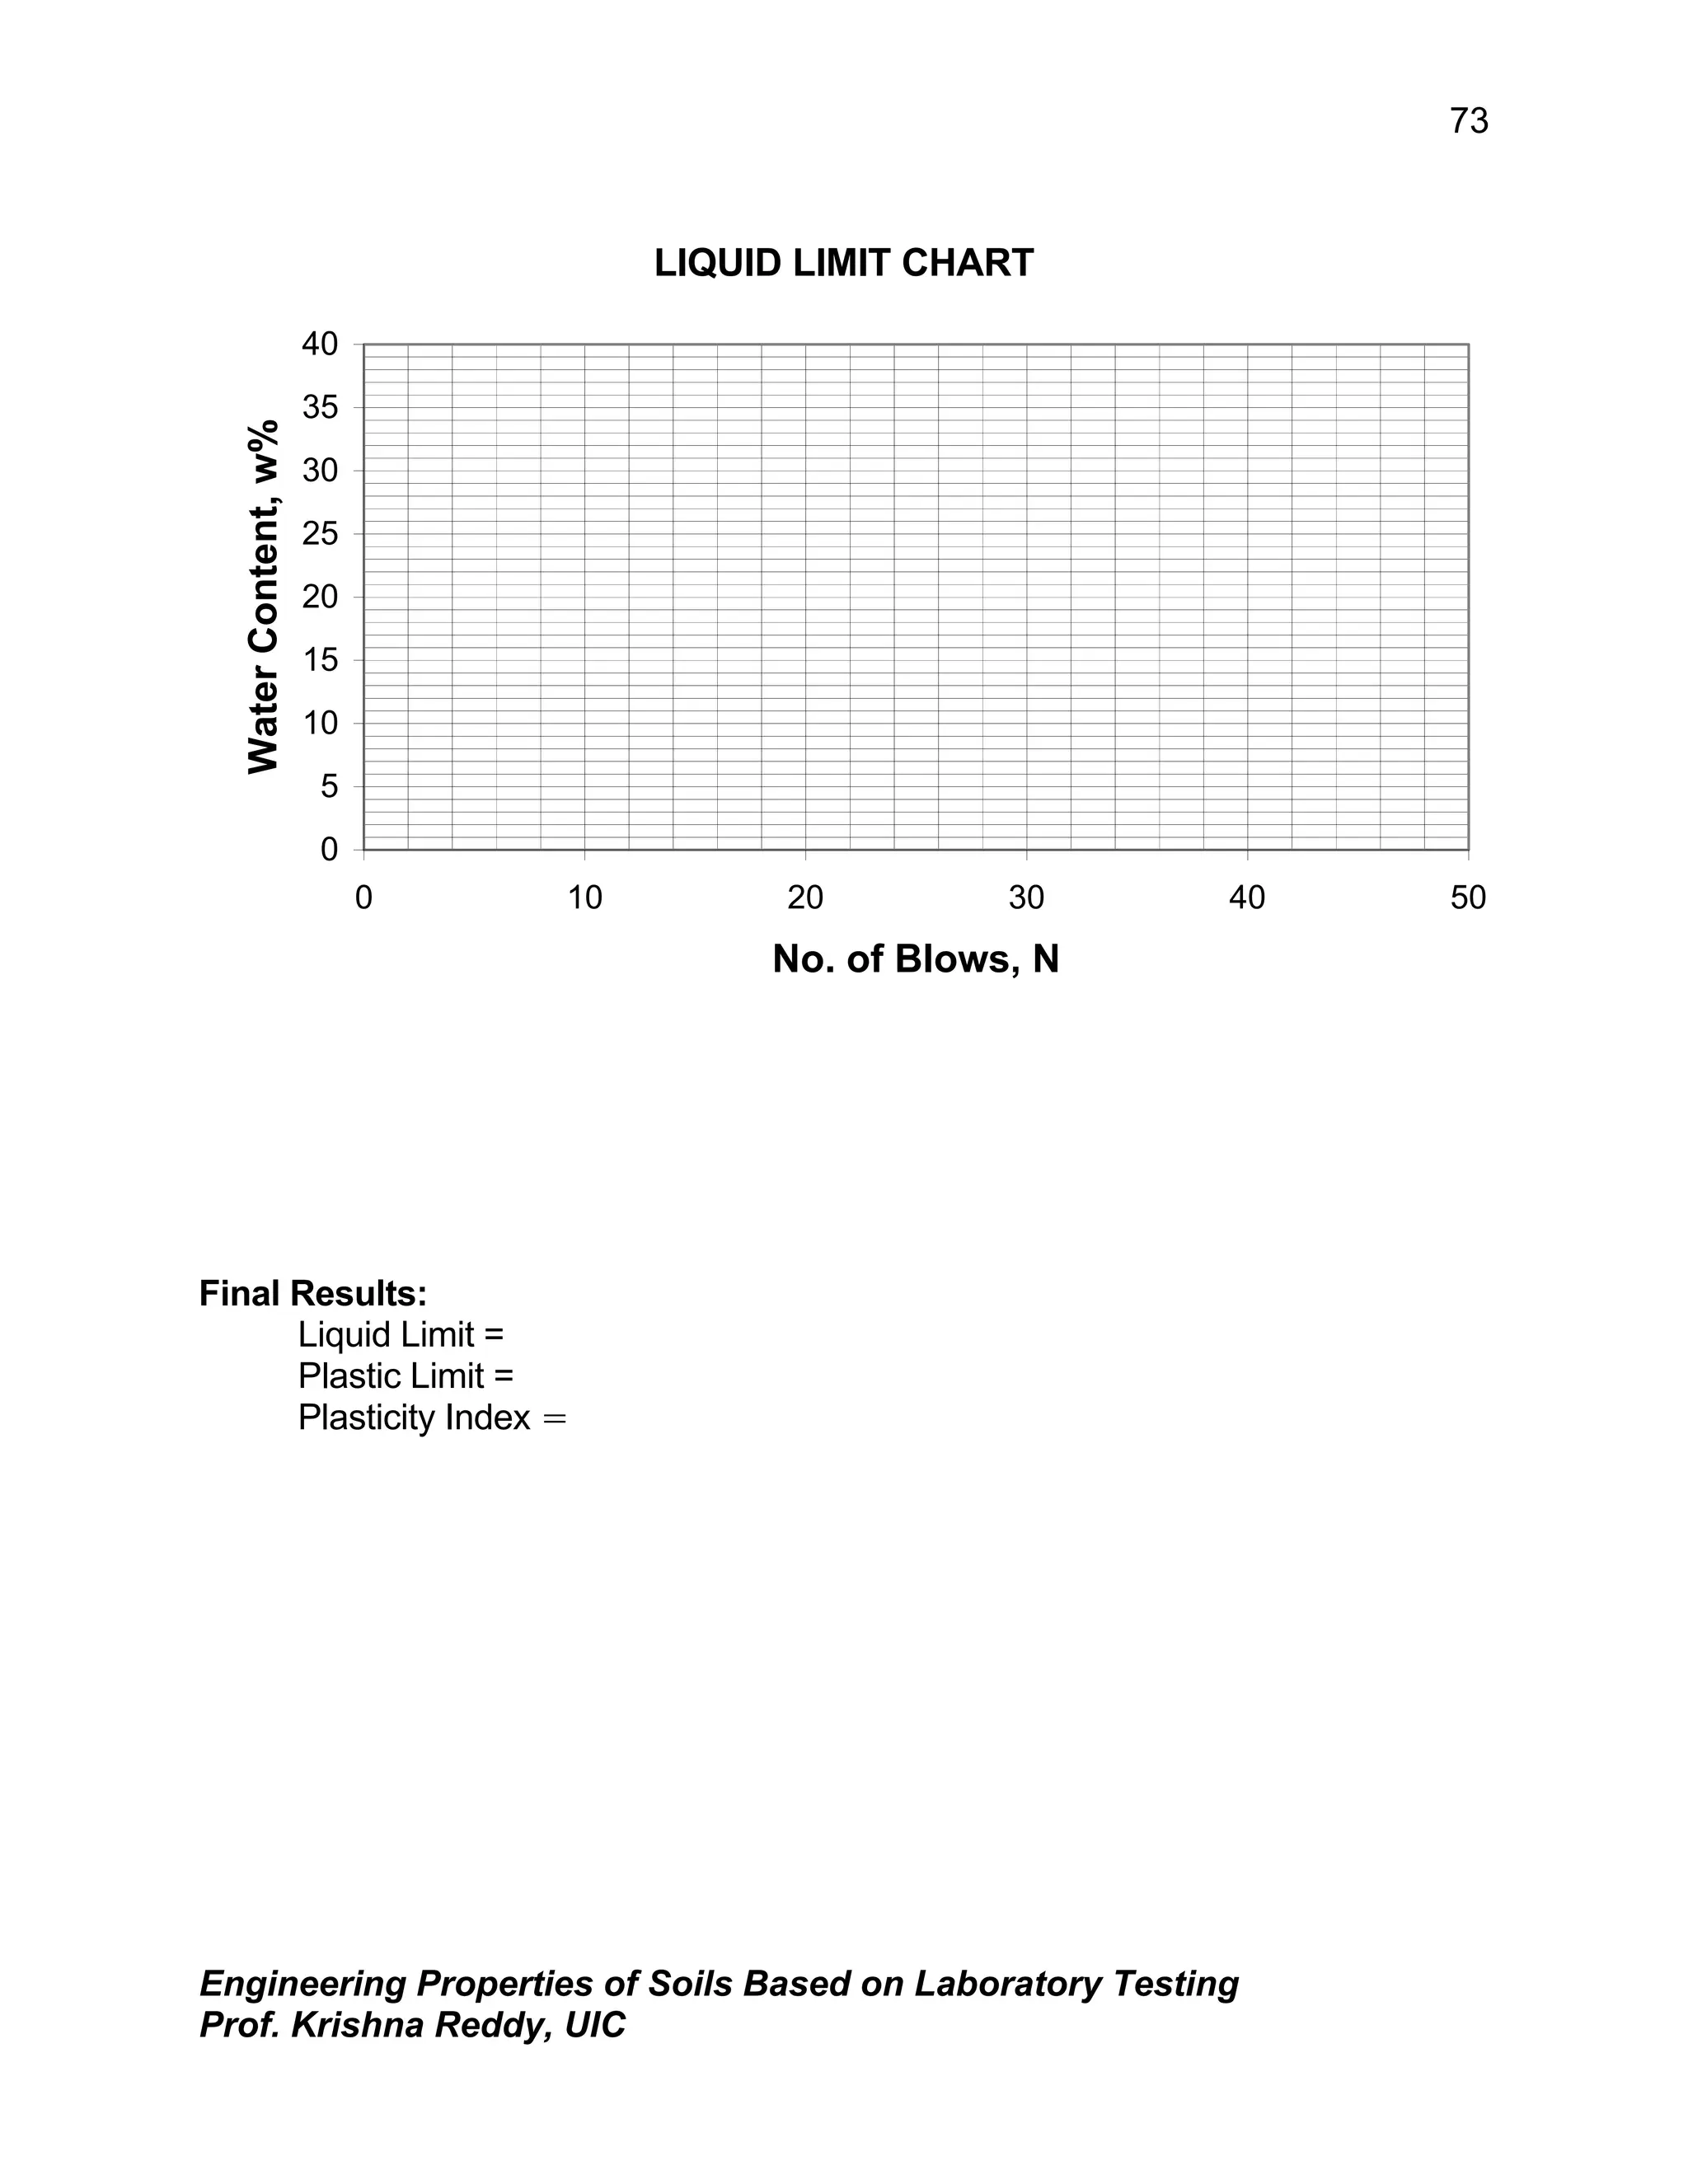
SlideShare a Scribd company logo
Engineering Properties of Soils Based on Laboratory Testing
Prof. Krishna Reddy, UIC
60
EXPERIMENT 7
ATTERBERG LIMITS
Purpose:
This lab is performed to determine the plastic and liquid limits of a fine-
grained soil. The liquid limit (LL) is arbitrarily defined as the water content, in
percent, at which a pat of soil in a standard cup and cut by a groove of standard
dimensions will flow together at the base of the groove for a distance of 13 mm (1/2
in.) when subjected to 25 shocks from the cup being dropped 10 mm in a standard
liquid limit apparatus operated at a rate of two shocks per second. The plastic limit
(PL) is the water content, in percent, at which a soil can no longer be deformed by
rolling into 3.2 mm (1/8 in.) diameter threads without crumbling.
Standard Reference:
ASTM D 4318 - Standard Test Method for Liquid Limit, Plastic Limit, and
Plasticity Index of Soils
Significance:
The Swedish soil scientist Albert Atterberg originally defined seven “limits of
consistency” to classify fine-grained soils, but in current engineering practice only
two of the limits, the liquid and plastic limits, are commonly used. (A third limit,
called the shrinkage limit, is used occasionally.) The Atterberg limits are based on
the moisture content of the soil. The plastic limit is the moisture content that
defines where the soil changes from a semi-solid to a plastic (flexible) state. The
liquid limit is the moisture content that defines where the soil changes from a plastic
to a viscous fluid state. The shrinkage limit is the moisture content that defines
where the soil volume will not reduce further if the moisture content is reduced. A
Engineering Properties of Soils Based on Laboratory Testing
Prof. Krishna Reddy, UIC
61
wide variety of soil engineering properties have been correlated to the liquid and
plastic limits, and these Atterberg limits are also used to classify a fine-grained soil
according to the Unified Soil Classification system or AASHTO system.
Equipment:
Liquid limit device, Porcelain (evaporating) dish, Flat grooving tool with gage,
Eight moisture cans, Balance, Glass plate, Spatula, Wash bottle filled with distilled
water, Drying oven set at 105°C.
Engineering Properties of Soils Based on Laboratory Testing
Prof. Krishna Reddy, UIC
62
Engineering Properties of Soils Based on Laboratory Testing
Prof. Krishna Reddy, UIC
63
Test Procedure:
Liquid Limit:
(1) Take roughly 3/4 of the soil and place it into the porcelain dish.
Assume that the soil was previously passed though a No. 40 sieve,
air-dried, and then pulverized. Thoroughly mix the soil with a small
amount of distilled water until it appears as a smooth uniform paste.
Cover the dish with cellophane to prevent moisture from escaping.
(2) Weigh four of the empty moisture cans with their lids, and record the
respective weights and can numbers on the data sheet.
(3) Adjust the liquid limit apparatus by checking the height of drop of the
cup. The point on the cup that comes in contact with the base should
rise to a height of 10 mm. The block on the end of the grooving tool is
Engineering Properties of Soils Based on Laboratory Testing
Prof. Krishna Reddy, UIC
64
10 mm high and should be used as a gage. Practice using the cup
and determine the correct rate to rotate the crank so that the cup
drops approximately two times per second.
(4) Place a portion of the previously mixed soil into the cup of the liquid
limit apparatus at the point where the cup rests on the base. Squeeze
the soil down to eliminate air pockets and spread it into the cup to a
depth of about 10 mm at its deepest point. The soil pat should form
an approximately horizontal surface (See Photo B).
(5) Use the grooving tool carefully cut a clean straight groove down the
center of the cup. The tool should remain perpendicular to the surface
of the cup as groove is being made. Use extreme care to prevent
sliding the soil relative to the surface of the cup (See Photo C).
(6) Make sure that the base of the apparatus below the cup and the
underside of the cup is clean of soil. Turn the crank of the apparatus
at a rate of approximately two drops per second and count the number
of drops, N, it takes to make the two halves of the soil pat come into
contact at the bottom of the groove along a distance of 13 mm (1/2 in.)
(See Photo D). If the number of drops exceeds 50, then go directly to
step eight and do not record the number of drops, otherwise, record
the number of drops on the data sheet.
(7) Take a sample, using the spatula, from edge to edge of the soil pat.
The sample should include the soil on both sides of where the groove
came into contact. Place the soil into a moisture can cover it.
Immediately weigh the moisture can containing the soil, record its
Engineering Properties of Soils Based on Laboratory Testing
Prof. Krishna Reddy, UIC
65
mass, remove the lid, and place the can into the oven. Leave the
moisture can in the oven for at least 16 hours. Place the soil
remaining in the cup into the porcelain dish. Clean and dry the cup on
the apparatus and the grooving tool.
(8) Remix the entire soil specimen in the porcelain dish. Add a small
amount of distilled water to increase the water content so that the
number of drops required to close the groove decrease.
(9) Repeat steps six, seven, and eight for at least two additional trials
producing successively lower numbers of drops to close the groove.
One of the trials shall be for a closure requiring 25 to 35 drops, one for
closure between 20 and 30 drops, and one trial for a closure requiring
15 to 25 drops. Determine the water content from each trial by using
the same method used in the first laboratory. Remember to use the
same balance for all weighing.
Plastic Limit:
(1) Weigh the remaining empty moisture cans with their lids, and record
the respective weights and can numbers on the data sheet.
(2) Take the remaining 1/4 of the original soil sample and add distilled
water until the soil is at a consistency where it can be rolled without
sticking to the hands.
(3) Form the soil into an ellipsoidal mass (See Photo F). Roll the mass
between the palm or the fingers and the glass plate (See Photo G).
Use sufficient pressure to roll the mass into a thread of uniform
Engineering Properties of Soils Based on Laboratory Testing
Prof. Krishna Reddy, UIC
66
diameter by using about 90 strokes per minute. (A stroke is one
complete motion of the hand forward and back to the starting position.)
The thread shall be deformed so that its diameter reaches 3.2 mm (1/8
in.), taking no more than two minutes.
(4) When the diameter of the thread reaches the correct diameter, break
the thread into several pieces. Knead and reform the pieces into
ellipsoidal masses and re-roll them. Continue this alternate rolling,
gathering together, kneading and re-rolling until the thread crumbles
under the pressure required for rolling and can no longer be rolled into
a 3.2 mm diameter thread (See Photo H).
(5) Gather the portions of the crumbled thread together and place the soil
into a moisture can, then cover it. If the can does not contain at least
6 grams of soil, add soil to the can from the next trial (See Step 6).
Immediately weigh the moisture can containing the soil, record its
mass, remove the lid, and place the can into the oven. Leave the
moisture can in the oven for at least 16 hours.
(6) Repeat steps three, four, and five at least two more times. Determine
the water content from each trial by using the same method used in
the first laboratory. Remember to use the same balance for all
weighing.
Engineering Properties of Soils Based on Laboratory Testing
Prof. Krishna Reddy, UIC
67
Analysis:
Liquid Limit:
(1) Calculate the water content of each of the liquid limit moisture cans
after they have been in the oven for at least 16 hours.
(2) Plot the number of drops, N, (on the log scale) versus the water
content (w). Draw the best-fit straight line through the plotted points
and determine the liquid limit (LL) as the water content at 25 drops.
Plastic Limit:
(1) Calculate the water content of each of the plastic limit moisture cans
after they have been in the oven for at least 16 hours.
(2) Compute the average of the water contents to determine the plastic
limit, PL. Check to see if the difference between the water contents is
greater than the acceptable range of two results (2.6 %).
(3) Calculate the plasticity index, PI=LL-PL.
Report the liquid limit, plastic limit, and plasticity index to the nearest
whole number, omitting the percent designation.
Engineering Properties of Soils Based on Laboratory Testing
Prof. Krishna Reddy, UIC
68
EXAMPLE DATA
Engineering Properties of Soils Based on Laboratory Testing
Prof. Krishna Reddy, UIC
69
ATTERBERG LIMITS
DATA SHEETS
Date Tested: September 20, 2002
Tested By: CEMM315 Class, Group A
Project Name: CEMM315 Lab
Sample Number: B-1, SS-1, 8’-10’
Sample Description: Grayey silty clay
Liquid Limit Determination
Sample no. 1 2 3 4
Moisture can and lid number 11 1 5 4
MC = Mass of empty, clean can + lid (grams) 22.23 23.31 21.87 22.58
MCMS = Mass of can, lid, and moist soil (grams) 28.56 29.27 25.73 25.22
MCDS = Mass of can, lid, and dry soil (grams) 27.40 28.10 24.90 24.60
MS = Mass of soil solids (grams) 5.03 4.79 3.03 2.02
MW = Mass of pore water (grams) 1.16 1.17 0.83 0.62
w = Water content, w% 23.06 24.43 27.39 30.69
No. of drops (N) 31 29 20 14
Plastic Limit Determination
Sample no. 1 2 3
Moisture can and lid number 7 14 13
MC = Mass of empty, clean can + lid (grams) 7.78 7.83 15.16
MCMS = Mass of can, lid, and moist soil (grams) 16.39 13.43 21.23
MCDS = Mass of can, lid, and dry soil (grams) 15.28 12 .69 20.43
MS = Mass of soil solids (grams) 7.5 4.86 5.27
MW = Mass of pore water (grams) 1. 11 0.74 0.8
w = Water content, w% 14.8 15.2 15.1
Plastic Limit (PL)= Average w % = 15.0
3
15.1
15.2
14.8
=
+
+
Engineering Properties of Soils Based on Laboratory Testing
Prof. Krishna Reddy, UIC
70
LIQUID LIMIT CHART
From the above graph, Liquid Limit = 26
Final Results:
Liquid Limit = 26
Plastic Limit = 15
Plasticity Index =11
0
5
10
15
20
25
30
35
0 5 10 15 20 25 30 35
No. of Blows, N
Water
Content,
w%
Engineering Properties of Soils Based on Laboratory Testing
Prof. Krishna Reddy, UIC
71
BLANK DATA SHEETS
Engineering Properties of Soils Based on Laboratory Testing
Prof. Krishna Reddy, UIC
72
ATTERBERG LIMITS
DATA SHEETS
Date Tested:
Tested By:
Project Name:
Sample Number:
Sample Description:
Liquid Limit Determination
Sample no. 1 2 3 4
Moisture can and lid number
MC = Mass of empty, clean can + lid (grams)
MCMS = Mass of can, lid, and moist soil (grams)
MCDS = Mass of can, lid, and dry soil (grams)
MS = Mass of soil solids (grams)
MW = Mass of pore water (grams)
w = Water content, w%
No. of drops (N)
Plastic Limit Determination
Sample no. 1 2 3
Moisture can and lid number
MC = Mass of empty, clean can + lid (grams)
MCMS = Mass of can, lid, and moist soil (grams)
MCDS = Mass of can, lid, and dry soil (grams)
MS = Mass of soil solids (grams)
MW = Mass of pore water (grams)
w = Water content, w%
Plastic Limit (PL) = Average w % =
Engineering Properties of Soils Based on Laboratory Testing
Prof. Krishna Reddy, UIC
73
LIQUID LIMIT CHART
0
5
10
15
20
25
30
35
40
0 10 20 30 40 50
No. of Blows, N
Water
Content,
w%
Final Results:
Liquid Limit =
Plastic Limit =
Plasticity Index =

More Related Content

Similar to Experiment 7-Atterberg Limits.pdf

International Journal of Engineering and Science Invention (IJESI)
International Journal of Engineering and Science Invention (IJESI)International Journal of Engineering and Science Invention (IJESI)
International Journal of Engineering and Science Invention (IJESI)
inventionjournals
 
DETERMINATION OF SOIL CONSISTANCY LIMITS
DETERMINATION OF SOIL CONSISTANCY LIMITSDETERMINATION OF SOIL CONSISTANCY LIMITS
DETERMINATION OF SOIL CONSISTANCY LIMITS
MdAbdullahAlAslam
 
Lecture 01 lab (Soil)
Lecture 01 lab (Soil)Lecture 01 lab (Soil)
Lecture 01 lab (Soil)
Muhammad Faisal
 
Ex 7 a permeability by constant head
Ex 7 a permeability by constant headEx 7 a permeability by constant head
Ex 7 a permeability by constant head
bhimaji40
 
B.tech Civil Engineering Major Project by Deepak Kumar ppt.pdf
B.tech Civil Engineering Major Project by Deepak Kumar ppt.pdfB.tech Civil Engineering Major Project by Deepak Kumar ppt.pdf
B.tech Civil Engineering Major Project by Deepak Kumar ppt.pdf
Deepak15CivilEngg
 
Permeability test
Permeability testPermeability test
Permeability test
Raz Azad
 
Determination of Bulk density of soil sample..pdf
Determination of Bulk density of soil sample..pdfDetermination of Bulk density of soil sample..pdf
Determination of Bulk density of soil sample..pdf
Mithil Fal Desai
 
capillary suction time
capillary suction timecapillary suction time
capillary suction time
Muhammad Faisal
 
Ex 8 standard proctor test
Ex 8 standard proctor testEx 8 standard proctor test
Ex 8 standard proctor test
bhimaji40
 
Pract 5.pptx
Pract 5.pptxPract 5.pptx
Pract 5.pptx
ArunKumar863577
 
Sample Chemistry Coursework 2015 (STPM)
 Sample Chemistry Coursework 2015 (STPM)  Sample Chemistry Coursework 2015 (STPM)
Sample Chemistry Coursework 2015 (STPM)
Thivyaapriya Sambamoorthy
 
Standard proctor test
Standard proctor testStandard proctor test
Standard proctor test
Raz Azad
 
Ex 2 water content by calcium carbide method
Ex 2 water content by calcium carbide methodEx 2 water content by calcium carbide method
Ex 2 water content by calcium carbide method
bhimaji40
 
Summer training report on soil testing experiments
Summer training report on soil testing experimentsSummer training report on soil testing experiments
Summer training report on soil testing experiments
ashishcivil098
 
Integrated Design Project (Geotech)_1.pdf
Integrated Design Project (Geotech)_1.pdfIntegrated Design Project (Geotech)_1.pdf
Integrated Design Project (Geotech)_1.pdf
SanDar27
 
Atterberg Limits test
Atterberg Limits testAtterberg Limits test
Atterberg Limits test
Bahzad5
 
Permeability Test of soil Using Constant and Falling Head Method
Permeability Test of soil Using Constant and Falling Head MethodPermeability Test of soil Using Constant and Falling Head Method
Permeability Test of soil Using Constant and Falling Head Method
Jameel Academy
 
Soil Compaction
Soil Compaction Soil Compaction
Proctor compaction test
Proctor compaction testProctor compaction test
Proctor compaction test
Faizan Tanoli
 
Atterberg limits test
Atterberg limits testAtterberg limits test
Atterberg limits test
Malith Buddhika
 

Similar to Experiment 7-Atterberg Limits.pdf (20)

International Journal of Engineering and Science Invention (IJESI)
International Journal of Engineering and Science Invention (IJESI)International Journal of Engineering and Science Invention (IJESI)
International Journal of Engineering and Science Invention (IJESI)
 
DETERMINATION OF SOIL CONSISTANCY LIMITS
DETERMINATION OF SOIL CONSISTANCY LIMITSDETERMINATION OF SOIL CONSISTANCY LIMITS
DETERMINATION OF SOIL CONSISTANCY LIMITS
 
Lecture 01 lab (Soil)
Lecture 01 lab (Soil)Lecture 01 lab (Soil)
Lecture 01 lab (Soil)
 
Ex 7 a permeability by constant head
Ex 7 a permeability by constant headEx 7 a permeability by constant head
Ex 7 a permeability by constant head
 
B.tech Civil Engineering Major Project by Deepak Kumar ppt.pdf
B.tech Civil Engineering Major Project by Deepak Kumar ppt.pdfB.tech Civil Engineering Major Project by Deepak Kumar ppt.pdf
B.tech Civil Engineering Major Project by Deepak Kumar ppt.pdf
 
Permeability test
Permeability testPermeability test
Permeability test
 
Determination of Bulk density of soil sample..pdf
Determination of Bulk density of soil sample..pdfDetermination of Bulk density of soil sample..pdf
Determination of Bulk density of soil sample..pdf
 
capillary suction time
capillary suction timecapillary suction time
capillary suction time
 
Ex 8 standard proctor test
Ex 8 standard proctor testEx 8 standard proctor test
Ex 8 standard proctor test
 
Pract 5.pptx
Pract 5.pptxPract 5.pptx
Pract 5.pptx
 
Sample Chemistry Coursework 2015 (STPM)
 Sample Chemistry Coursework 2015 (STPM)  Sample Chemistry Coursework 2015 (STPM)
Sample Chemistry Coursework 2015 (STPM)
 
Standard proctor test
Standard proctor testStandard proctor test
Standard proctor test
 
Ex 2 water content by calcium carbide method
Ex 2 water content by calcium carbide methodEx 2 water content by calcium carbide method
Ex 2 water content by calcium carbide method
 
Summer training report on soil testing experiments
Summer training report on soil testing experimentsSummer training report on soil testing experiments
Summer training report on soil testing experiments
 
Integrated Design Project (Geotech)_1.pdf
Integrated Design Project (Geotech)_1.pdfIntegrated Design Project (Geotech)_1.pdf
Integrated Design Project (Geotech)_1.pdf
 
Atterberg Limits test
Atterberg Limits testAtterberg Limits test
Atterberg Limits test
 
Permeability Test of soil Using Constant and Falling Head Method
Permeability Test of soil Using Constant and Falling Head MethodPermeability Test of soil Using Constant and Falling Head Method
Permeability Test of soil Using Constant and Falling Head Method
 
Soil Compaction
Soil Compaction Soil Compaction
Soil Compaction
 
Proctor compaction test
Proctor compaction testProctor compaction test
Proctor compaction test
 
Atterberg limits test
Atterberg limits testAtterberg limits test
Atterberg limits test
 

Recently uploaded

Mechanical Engineering on AAI Summer Training Report-003.pdf
Mechanical Engineering on AAI Summer Training Report-003.pdfMechanical Engineering on AAI Summer Training Report-003.pdf
Mechanical Engineering on AAI Summer Training Report-003.pdf
21UME003TUSHARDEB
 
一比一原版(CalArts毕业证)加利福尼亚艺术学院毕业证如何办理
一比一原版(CalArts毕业证)加利福尼亚艺术学院毕业证如何办理一比一原版(CalArts毕业证)加利福尼亚艺术学院毕业证如何办理
一比一原版(CalArts毕业证)加利福尼亚艺术学院毕业证如何办理
ecqow
 
VARIABLE FREQUENCY DRIVE. VFDs are widely used in industrial applications for...
VARIABLE FREQUENCY DRIVE. VFDs are widely used in industrial applications for...VARIABLE FREQUENCY DRIVE. VFDs are widely used in industrial applications for...
VARIABLE FREQUENCY DRIVE. VFDs are widely used in industrial applications for...
PIMR BHOPAL
 
2008 BUILDING CONSTRUCTION Illustrated - Ching Chapter 02 The Building.pdf
2008 BUILDING CONSTRUCTION Illustrated - Ching Chapter 02 The Building.pdf2008 BUILDING CONSTRUCTION Illustrated - Ching Chapter 02 The Building.pdf
2008 BUILDING CONSTRUCTION Illustrated - Ching Chapter 02 The Building.pdf
Yasser Mahgoub
 
Advanced control scheme of doubly fed induction generator for wind turbine us...
Advanced control scheme of doubly fed induction generator for wind turbine us...Advanced control scheme of doubly fed induction generator for wind turbine us...
Advanced control scheme of doubly fed induction generator for wind turbine us...
IJECEIAES
 
ITSM Integration with MuleSoft.pptx
ITSM  Integration with MuleSoft.pptxITSM  Integration with MuleSoft.pptx
ITSM Integration with MuleSoft.pptx
VANDANAMOHANGOUDA
 
4. Mosca vol I -Fisica-Tipler-5ta-Edicion-Vol-1.pdf
4. Mosca vol I -Fisica-Tipler-5ta-Edicion-Vol-1.pdf4. Mosca vol I -Fisica-Tipler-5ta-Edicion-Vol-1.pdf
4. Mosca vol I -Fisica-Tipler-5ta-Edicion-Vol-1.pdf
Gino153088
 
CompEx~Manual~1210 (2).pdf COMPEX GAS AND VAPOURS
CompEx~Manual~1210 (2).pdf COMPEX GAS AND VAPOURSCompEx~Manual~1210 (2).pdf COMPEX GAS AND VAPOURS
CompEx~Manual~1210 (2).pdf COMPEX GAS AND VAPOURS
RamonNovais6
 
Object Oriented Analysis and Design - OOAD
Object Oriented Analysis and Design - OOADObject Oriented Analysis and Design - OOAD
Object Oriented Analysis and Design - OOAD
PreethaV16
 
Null Bangalore | Pentesters Approach to AWS IAM
Null Bangalore | Pentesters Approach to AWS IAMNull Bangalore | Pentesters Approach to AWS IAM
Null Bangalore | Pentesters Approach to AWS IAM
Divyanshu
 
Generative AI Use cases applications solutions and implementation.pdf
Generative AI Use cases applications solutions and implementation.pdfGenerative AI Use cases applications solutions and implementation.pdf
Generative AI Use cases applications solutions and implementation.pdf
mahaffeycheryld
 
An Introduction to the Compiler Designss
An Introduction to the Compiler DesignssAn Introduction to the Compiler Designss
An Introduction to the Compiler Designss
ElakkiaU
 
Comparative analysis between traditional aquaponics and reconstructed aquapon...
Comparative analysis between traditional aquaponics and reconstructed aquapon...Comparative analysis between traditional aquaponics and reconstructed aquapon...
Comparative analysis between traditional aquaponics and reconstructed aquapon...
bijceesjournal
 
学校原版美国波士顿大学毕业证学历学位证书原版一模一样
学校原版美国波士顿大学毕业证学历学位证书原版一模一样学校原版美国波士顿大学毕业证学历学位证书原版一模一样
学校原版美国波士顿大学毕业证学历学位证书原版一模一样
171ticu
 
Applications of artificial Intelligence in Mechanical Engineering.pdf
Applications of artificial Intelligence in Mechanical Engineering.pdfApplications of artificial Intelligence in Mechanical Engineering.pdf
Applications of artificial Intelligence in Mechanical Engineering.pdf
Atif Razi
 
DEEP LEARNING FOR SMART GRID INTRUSION DETECTION: A HYBRID CNN-LSTM-BASED MODEL
DEEP LEARNING FOR SMART GRID INTRUSION DETECTION: A HYBRID CNN-LSTM-BASED MODELDEEP LEARNING FOR SMART GRID INTRUSION DETECTION: A HYBRID CNN-LSTM-BASED MODEL
DEEP LEARNING FOR SMART GRID INTRUSION DETECTION: A HYBRID CNN-LSTM-BASED MODEL
ijaia
 
一比一原版(osu毕业证书)美国俄勒冈州立大学毕业证如何办理
一比一原版(osu毕业证书)美国俄勒冈州立大学毕业证如何办理一比一原版(osu毕业证书)美国俄勒冈州立大学毕业证如何办理
一比一原版(osu毕业证书)美国俄勒冈州立大学毕业证如何办理
upoux
 
Design and optimization of ion propulsion drone
Design and optimization of ion propulsion droneDesign and optimization of ion propulsion drone
Design and optimization of ion propulsion drone
bjmsejournal
 
Software Engineering and Project Management - Software Testing + Agile Method...
Software Engineering and Project Management - Software Testing + Agile Method...Software Engineering and Project Management - Software Testing + Agile Method...
Software Engineering and Project Management - Software Testing + Agile Method...
Prakhyath Rai
 
Curve Fitting in Numerical Methods Regression
Curve Fitting in Numerical Methods RegressionCurve Fitting in Numerical Methods Regression
Curve Fitting in Numerical Methods Regression
Nada Hikmah
 

Recently uploaded (20)

Mechanical Engineering on AAI Summer Training Report-003.pdf
Mechanical Engineering on AAI Summer Training Report-003.pdfMechanical Engineering on AAI Summer Training Report-003.pdf
Mechanical Engineering on AAI Summer Training Report-003.pdf
 
一比一原版(CalArts毕业证)加利福尼亚艺术学院毕业证如何办理
一比一原版(CalArts毕业证)加利福尼亚艺术学院毕业证如何办理一比一原版(CalArts毕业证)加利福尼亚艺术学院毕业证如何办理
一比一原版(CalArts毕业证)加利福尼亚艺术学院毕业证如何办理
 
VARIABLE FREQUENCY DRIVE. VFDs are widely used in industrial applications for...
VARIABLE FREQUENCY DRIVE. VFDs are widely used in industrial applications for...VARIABLE FREQUENCY DRIVE. VFDs are widely used in industrial applications for...
VARIABLE FREQUENCY DRIVE. VFDs are widely used in industrial applications for...
 
2008 BUILDING CONSTRUCTION Illustrated - Ching Chapter 02 The Building.pdf
2008 BUILDING CONSTRUCTION Illustrated - Ching Chapter 02 The Building.pdf2008 BUILDING CONSTRUCTION Illustrated - Ching Chapter 02 The Building.pdf
2008 BUILDING CONSTRUCTION Illustrated - Ching Chapter 02 The Building.pdf
 
Advanced control scheme of doubly fed induction generator for wind turbine us...
Advanced control scheme of doubly fed induction generator for wind turbine us...Advanced control scheme of doubly fed induction generator for wind turbine us...
Advanced control scheme of doubly fed induction generator for wind turbine us...
 
ITSM Integration with MuleSoft.pptx
ITSM  Integration with MuleSoft.pptxITSM  Integration with MuleSoft.pptx
ITSM Integration with MuleSoft.pptx
 
4. Mosca vol I -Fisica-Tipler-5ta-Edicion-Vol-1.pdf
4. Mosca vol I -Fisica-Tipler-5ta-Edicion-Vol-1.pdf4. Mosca vol I -Fisica-Tipler-5ta-Edicion-Vol-1.pdf
4. Mosca vol I -Fisica-Tipler-5ta-Edicion-Vol-1.pdf
 
CompEx~Manual~1210 (2).pdf COMPEX GAS AND VAPOURS
CompEx~Manual~1210 (2).pdf COMPEX GAS AND VAPOURSCompEx~Manual~1210 (2).pdf COMPEX GAS AND VAPOURS
CompEx~Manual~1210 (2).pdf COMPEX GAS AND VAPOURS
 
Object Oriented Analysis and Design - OOAD
Object Oriented Analysis and Design - OOADObject Oriented Analysis and Design - OOAD
Object Oriented Analysis and Design - OOAD
 
Null Bangalore | Pentesters Approach to AWS IAM
Null Bangalore | Pentesters Approach to AWS IAMNull Bangalore | Pentesters Approach to AWS IAM
Null Bangalore | Pentesters Approach to AWS IAM
 
Generative AI Use cases applications solutions and implementation.pdf
Generative AI Use cases applications solutions and implementation.pdfGenerative AI Use cases applications solutions and implementation.pdf
Generative AI Use cases applications solutions and implementation.pdf
 
An Introduction to the Compiler Designss
An Introduction to the Compiler DesignssAn Introduction to the Compiler Designss
An Introduction to the Compiler Designss
 
Comparative analysis between traditional aquaponics and reconstructed aquapon...
Comparative analysis between traditional aquaponics and reconstructed aquapon...Comparative analysis between traditional aquaponics and reconstructed aquapon...
Comparative analysis between traditional aquaponics and reconstructed aquapon...
 
学校原版美国波士顿大学毕业证学历学位证书原版一模一样
学校原版美国波士顿大学毕业证学历学位证书原版一模一样学校原版美国波士顿大学毕业证学历学位证书原版一模一样
学校原版美国波士顿大学毕业证学历学位证书原版一模一样
 
Applications of artificial Intelligence in Mechanical Engineering.pdf
Applications of artificial Intelligence in Mechanical Engineering.pdfApplications of artificial Intelligence in Mechanical Engineering.pdf
Applications of artificial Intelligence in Mechanical Engineering.pdf
 
DEEP LEARNING FOR SMART GRID INTRUSION DETECTION: A HYBRID CNN-LSTM-BASED MODEL
DEEP LEARNING FOR SMART GRID INTRUSION DETECTION: A HYBRID CNN-LSTM-BASED MODELDEEP LEARNING FOR SMART GRID INTRUSION DETECTION: A HYBRID CNN-LSTM-BASED MODEL
DEEP LEARNING FOR SMART GRID INTRUSION DETECTION: A HYBRID CNN-LSTM-BASED MODEL
 
一比一原版(osu毕业证书)美国俄勒冈州立大学毕业证如何办理
一比一原版(osu毕业证书)美国俄勒冈州立大学毕业证如何办理一比一原版(osu毕业证书)美国俄勒冈州立大学毕业证如何办理
一比一原版(osu毕业证书)美国俄勒冈州立大学毕业证如何办理
 
Design and optimization of ion propulsion drone
Design and optimization of ion propulsion droneDesign and optimization of ion propulsion drone
Design and optimization of ion propulsion drone
 
Software Engineering and Project Management - Software Testing + Agile Method...
Software Engineering and Project Management - Software Testing + Agile Method...Software Engineering and Project Management - Software Testing + Agile Method...
Software Engineering and Project Management - Software Testing + Agile Method...
 
Curve Fitting in Numerical Methods Regression
Curve Fitting in Numerical Methods RegressionCurve Fitting in Numerical Methods Regression
Curve Fitting in Numerical Methods Regression
 

Experiment 7-Atterberg Limits.pdf

  • 1. Engineering Properties of Soils Based on Laboratory Testing Prof. Krishna Reddy, UIC 60 EXPERIMENT 7 ATTERBERG LIMITS Purpose: This lab is performed to determine the plastic and liquid limits of a fine- grained soil. The liquid limit (LL) is arbitrarily defined as the water content, in percent, at which a pat of soil in a standard cup and cut by a groove of standard dimensions will flow together at the base of the groove for a distance of 13 mm (1/2 in.) when subjected to 25 shocks from the cup being dropped 10 mm in a standard liquid limit apparatus operated at a rate of two shocks per second. The plastic limit (PL) is the water content, in percent, at which a soil can no longer be deformed by rolling into 3.2 mm (1/8 in.) diameter threads without crumbling. Standard Reference: ASTM D 4318 - Standard Test Method for Liquid Limit, Plastic Limit, and Plasticity Index of Soils Significance: The Swedish soil scientist Albert Atterberg originally defined seven “limits of consistency” to classify fine-grained soils, but in current engineering practice only two of the limits, the liquid and plastic limits, are commonly used. (A third limit, called the shrinkage limit, is used occasionally.) The Atterberg limits are based on the moisture content of the soil. The plastic limit is the moisture content that defines where the soil changes from a semi-solid to a plastic (flexible) state. The liquid limit is the moisture content that defines where the soil changes from a plastic to a viscous fluid state. The shrinkage limit is the moisture content that defines where the soil volume will not reduce further if the moisture content is reduced. A
  • 2. Engineering Properties of Soils Based on Laboratory Testing Prof. Krishna Reddy, UIC 61 wide variety of soil engineering properties have been correlated to the liquid and plastic limits, and these Atterberg limits are also used to classify a fine-grained soil according to the Unified Soil Classification system or AASHTO system. Equipment: Liquid limit device, Porcelain (evaporating) dish, Flat grooving tool with gage, Eight moisture cans, Balance, Glass plate, Spatula, Wash bottle filled with distilled water, Drying oven set at 105°C.
  • 3. Engineering Properties of Soils Based on Laboratory Testing Prof. Krishna Reddy, UIC 62
  • 4. Engineering Properties of Soils Based on Laboratory Testing Prof. Krishna Reddy, UIC 63 Test Procedure: Liquid Limit: (1) Take roughly 3/4 of the soil and place it into the porcelain dish. Assume that the soil was previously passed though a No. 40 sieve, air-dried, and then pulverized. Thoroughly mix the soil with a small amount of distilled water until it appears as a smooth uniform paste. Cover the dish with cellophane to prevent moisture from escaping. (2) Weigh four of the empty moisture cans with their lids, and record the respective weights and can numbers on the data sheet. (3) Adjust the liquid limit apparatus by checking the height of drop of the cup. The point on the cup that comes in contact with the base should rise to a height of 10 mm. The block on the end of the grooving tool is
  • 5. Engineering Properties of Soils Based on Laboratory Testing Prof. Krishna Reddy, UIC 64 10 mm high and should be used as a gage. Practice using the cup and determine the correct rate to rotate the crank so that the cup drops approximately two times per second. (4) Place a portion of the previously mixed soil into the cup of the liquid limit apparatus at the point where the cup rests on the base. Squeeze the soil down to eliminate air pockets and spread it into the cup to a depth of about 10 mm at its deepest point. The soil pat should form an approximately horizontal surface (See Photo B). (5) Use the grooving tool carefully cut a clean straight groove down the center of the cup. The tool should remain perpendicular to the surface of the cup as groove is being made. Use extreme care to prevent sliding the soil relative to the surface of the cup (See Photo C). (6) Make sure that the base of the apparatus below the cup and the underside of the cup is clean of soil. Turn the crank of the apparatus at a rate of approximately two drops per second and count the number of drops, N, it takes to make the two halves of the soil pat come into contact at the bottom of the groove along a distance of 13 mm (1/2 in.) (See Photo D). If the number of drops exceeds 50, then go directly to step eight and do not record the number of drops, otherwise, record the number of drops on the data sheet. (7) Take a sample, using the spatula, from edge to edge of the soil pat. The sample should include the soil on both sides of where the groove came into contact. Place the soil into a moisture can cover it. Immediately weigh the moisture can containing the soil, record its
  • 6. Engineering Properties of Soils Based on Laboratory Testing Prof. Krishna Reddy, UIC 65 mass, remove the lid, and place the can into the oven. Leave the moisture can in the oven for at least 16 hours. Place the soil remaining in the cup into the porcelain dish. Clean and dry the cup on the apparatus and the grooving tool. (8) Remix the entire soil specimen in the porcelain dish. Add a small amount of distilled water to increase the water content so that the number of drops required to close the groove decrease. (9) Repeat steps six, seven, and eight for at least two additional trials producing successively lower numbers of drops to close the groove. One of the trials shall be for a closure requiring 25 to 35 drops, one for closure between 20 and 30 drops, and one trial for a closure requiring 15 to 25 drops. Determine the water content from each trial by using the same method used in the first laboratory. Remember to use the same balance for all weighing. Plastic Limit: (1) Weigh the remaining empty moisture cans with their lids, and record the respective weights and can numbers on the data sheet. (2) Take the remaining 1/4 of the original soil sample and add distilled water until the soil is at a consistency where it can be rolled without sticking to the hands. (3) Form the soil into an ellipsoidal mass (See Photo F). Roll the mass between the palm or the fingers and the glass plate (See Photo G). Use sufficient pressure to roll the mass into a thread of uniform
  • 7. Engineering Properties of Soils Based on Laboratory Testing Prof. Krishna Reddy, UIC 66 diameter by using about 90 strokes per minute. (A stroke is one complete motion of the hand forward and back to the starting position.) The thread shall be deformed so that its diameter reaches 3.2 mm (1/8 in.), taking no more than two minutes. (4) When the diameter of the thread reaches the correct diameter, break the thread into several pieces. Knead and reform the pieces into ellipsoidal masses and re-roll them. Continue this alternate rolling, gathering together, kneading and re-rolling until the thread crumbles under the pressure required for rolling and can no longer be rolled into a 3.2 mm diameter thread (See Photo H). (5) Gather the portions of the crumbled thread together and place the soil into a moisture can, then cover it. If the can does not contain at least 6 grams of soil, add soil to the can from the next trial (See Step 6). Immediately weigh the moisture can containing the soil, record its mass, remove the lid, and place the can into the oven. Leave the moisture can in the oven for at least 16 hours. (6) Repeat steps three, four, and five at least two more times. Determine the water content from each trial by using the same method used in the first laboratory. Remember to use the same balance for all weighing.
  • 8. Engineering Properties of Soils Based on Laboratory Testing Prof. Krishna Reddy, UIC 67 Analysis: Liquid Limit: (1) Calculate the water content of each of the liquid limit moisture cans after they have been in the oven for at least 16 hours. (2) Plot the number of drops, N, (on the log scale) versus the water content (w). Draw the best-fit straight line through the plotted points and determine the liquid limit (LL) as the water content at 25 drops. Plastic Limit: (1) Calculate the water content of each of the plastic limit moisture cans after they have been in the oven for at least 16 hours. (2) Compute the average of the water contents to determine the plastic limit, PL. Check to see if the difference between the water contents is greater than the acceptable range of two results (2.6 %). (3) Calculate the plasticity index, PI=LL-PL. Report the liquid limit, plastic limit, and plasticity index to the nearest whole number, omitting the percent designation.
  • 9. Engineering Properties of Soils Based on Laboratory Testing Prof. Krishna Reddy, UIC 68 EXAMPLE DATA
  • 10. Engineering Properties of Soils Based on Laboratory Testing Prof. Krishna Reddy, UIC 69 ATTERBERG LIMITS DATA SHEETS Date Tested: September 20, 2002 Tested By: CEMM315 Class, Group A Project Name: CEMM315 Lab Sample Number: B-1, SS-1, 8’-10’ Sample Description: Grayey silty clay Liquid Limit Determination Sample no. 1 2 3 4 Moisture can and lid number 11 1 5 4 MC = Mass of empty, clean can + lid (grams) 22.23 23.31 21.87 22.58 MCMS = Mass of can, lid, and moist soil (grams) 28.56 29.27 25.73 25.22 MCDS = Mass of can, lid, and dry soil (grams) 27.40 28.10 24.90 24.60 MS = Mass of soil solids (grams) 5.03 4.79 3.03 2.02 MW = Mass of pore water (grams) 1.16 1.17 0.83 0.62 w = Water content, w% 23.06 24.43 27.39 30.69 No. of drops (N) 31 29 20 14 Plastic Limit Determination Sample no. 1 2 3 Moisture can and lid number 7 14 13 MC = Mass of empty, clean can + lid (grams) 7.78 7.83 15.16 MCMS = Mass of can, lid, and moist soil (grams) 16.39 13.43 21.23 MCDS = Mass of can, lid, and dry soil (grams) 15.28 12 .69 20.43 MS = Mass of soil solids (grams) 7.5 4.86 5.27 MW = Mass of pore water (grams) 1. 11 0.74 0.8 w = Water content, w% 14.8 15.2 15.1 Plastic Limit (PL)= Average w % = 15.0 3 15.1 15.2 14.8 = + +
  • 11. Engineering Properties of Soils Based on Laboratory Testing Prof. Krishna Reddy, UIC 70 LIQUID LIMIT CHART From the above graph, Liquid Limit = 26 Final Results: Liquid Limit = 26 Plastic Limit = 15 Plasticity Index =11 0 5 10 15 20 25 30 35 0 5 10 15 20 25 30 35 No. of Blows, N Water Content, w%
  • 12. Engineering Properties of Soils Based on Laboratory Testing Prof. Krishna Reddy, UIC 71 BLANK DATA SHEETS
  • 13. Engineering Properties of Soils Based on Laboratory Testing Prof. Krishna Reddy, UIC 72 ATTERBERG LIMITS DATA SHEETS Date Tested: Tested By: Project Name: Sample Number: Sample Description: Liquid Limit Determination Sample no. 1 2 3 4 Moisture can and lid number MC = Mass of empty, clean can + lid (grams) MCMS = Mass of can, lid, and moist soil (grams) MCDS = Mass of can, lid, and dry soil (grams) MS = Mass of soil solids (grams) MW = Mass of pore water (grams) w = Water content, w% No. of drops (N) Plastic Limit Determination Sample no. 1 2 3 Moisture can and lid number MC = Mass of empty, clean can + lid (grams) MCMS = Mass of can, lid, and moist soil (grams) MCDS = Mass of can, lid, and dry soil (grams) MS = Mass of soil solids (grams) MW = Mass of pore water (grams) w = Water content, w% Plastic Limit (PL) = Average w % =
  • 14. Engineering Properties of Soils Based on Laboratory Testing Prof. Krishna Reddy, UIC 73 LIQUID LIMIT CHART 0 5 10 15 20 25 30 35 40 0 10 20 30 40 50 No. of Blows, N Water Content, w% Final Results: Liquid Limit = Plastic Limit = Plasticity Index =