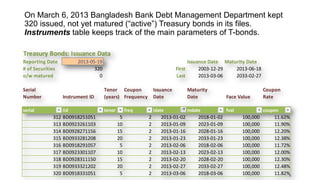
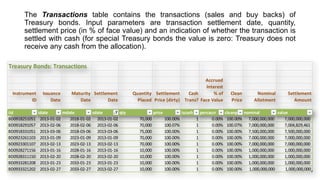
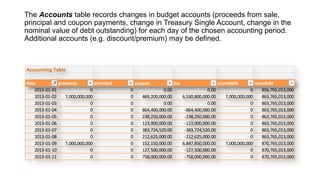
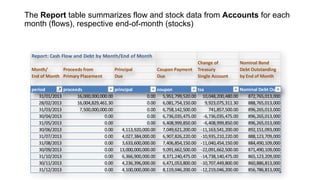
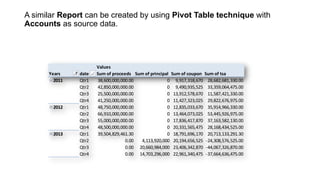
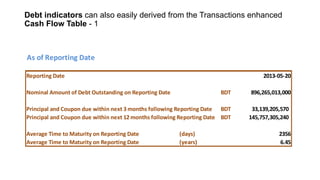
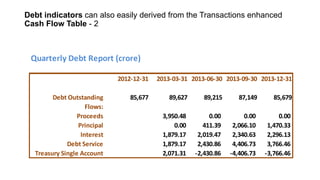
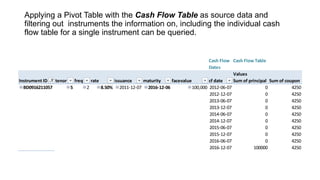
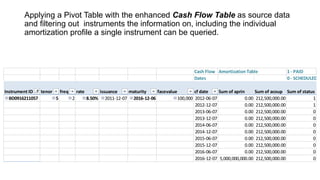
SlideShare a Scribd company logo
Excel Workbook for
Treatment of a large
Treasury Bond Portfolio
By Werner Riecke
The Cash Flow Table for all T-bonds is generated based on parameters of
the Instruments table. All transactions (first primary placement, re-opening,
buy back) are recorded in the Transactions table. Accounts table keeps
track of daily changes in government securities related budget accounts.
Reports table(s) provide stock and flow data on governments securities for
selected time periods.

Cash Flow Table

Transactions

Instruments
Accounts

Reports
On March 6, 2013 Bangladesh Bank Debt Management Department kept
320 issued, not yet matured (“active”) Treasury bonds in its files.
Instruments table keeps track of the main parameters of T-bonds.
Treasury Bonds: Issuance Data
Reporting Date
# of Securities
o/w matured
Serial
Number
serial

2013-05-19
320
0

Issuance Date Maturity Date
First
2003-12-29
2013-06-18
Last
2013-03-06
2033-02-27

Instrument ID

Issuance
Date

Maturity
Date

Face Value

Coupon
Rate

iid

312
313
314
315
316
317
318
319
320

Tenor Coupon
(years) Frequency
tenor

idate

mdate

fval

coupon

BD0918251051
BD0923261103
BD0928271156
BD0933281208
BD0918291057
BD0923301107
BD0928311150
BD0933321202
BD0918331051

freq

5
10
15
20
5
10
15
20
5

2
2
2
2
2
2
2
2
2

2013-01-02
2013-01-09
2013-01-16
2013-01-23
2013-02-06
2013-02-13
2013-02-20
2013-02-27
2013-03-06

2018-01-02
2023-01-09
2028-01-16
2033-01-23
2018-02-06
2023-02-13
2028-02-20
2033-02-27
2018-03-06

100,000
100,000
100,000
100,000
100,000
100,000
100,000
100,000
100,000

11.62%
11.90%
12.20%
12.38%
11.72%
12.00%
12.30%
12.48%
11.82%
The Cash Flow Table contains the cash flow dates and amounts (principal and
coupon) for each bond of the portfolio, below shown for one bond in the last three
columns of the table. Data of the preceding columns is derived from the
Instruments table. Currently the Cash Flow Table contains 7173 records, cash
amounts of 320 bonds.
#flow dates and 7173
of records
Instrument ID
iid
BD0913011104
BD0913011104
BD0913011104
BD0913011104
BD0913011104
BD0913011104
BD0913011104
BD0913011104
BD0913011104
BD0913011104
BD0913011104
BD0913011104
BD0913011104
BD0913011104
BD0913011104
BD0913011104
BD0913011104
BD0913011104
BD0913011104
BD0913011104

Issuance
Date
idate

Maturity
Date

Tenor
(Years)

mdate
tenor
2003-12-29 2013-12-28
2003-12-29 2013-12-28
2003-12-29 2013-12-28
2003-12-29 2013-12-28
2003-12-29 2013-12-28
2003-12-29 2013-12-28
2003-12-29 2013-12-28
2003-12-29 2013-12-28
2003-12-29 2013-12-28
2003-12-29 2013-12-28
2003-12-29 2013-12-28
2003-12-29 2013-12-28
2003-12-29 2013-12-28
2003-12-29 2013-12-28
2003-12-29 2013-12-28
2003-12-29 2013-12-28
2003-12-29 2013-12-28
2003-12-29 2013-12-28
2003-12-29 2013-12-28
2003-12-29 2013-12-28

Face
Value
fval
10
10
10
10
10
10
10
10
10
10
10
10
10
10
10
10
10
10
10
10

Coupon
Coupon
Frequency Rate
cfreq

100,000
100,000
100,000
100,000
100,000
100,000
100,000
100,000
100,000
100,000
100,000
100,000
100,000
100,000
100,000
100,000
100,000
100,000
100,000
100,000

Cash Flow
Date

Principal

Coupon

couponrate cfdate
principal
coupon
2
8.50% 2004-06-29
0
2
8.50% 2004-12-29
0
2
8.50% 2005-06-29
0
2
8.50% 2005-12-29
0
2
8.50% 2006-06-29
0
2
8.50% 2006-12-29
0
2
8.50% 2007-06-29
0
2
8.50% 2007-12-29
0
2
8.50% 2008-06-29
0
2
8.50% 2008-12-29
0
2
8.50% 2009-06-29
0
2
8.50% 2009-12-29
0
2
8.50% 2010-06-29
0
2
8.50% 2010-12-29
0
2
8.50% 2011-06-29
0
2
8.50% 2011-12-29
0
2
8.50% 2012-06-29
0
2
8.50% 2012-12-29
0
2
8.50% 2013-06-29
0
2
8.50% 2013-12-29
100,000

4250.0000
4250.0000
4250.0000
4250.0000
4250.0000
4250.0000
4250.0000
4250.0000
4250.0000
4250.0000
4250.0000
4250.0000
4250.0000
4250.0000
4250.0000
4250.0000
4250.0000
4250.0000
4250.0000
4250.0000
The Transactions table contains the transactions (sales and buy backs) of
Treasury bonds. Input parameters are transaction settlement date, quantity,
settlement price (in % of face value) and an indication of whether the transaction is
settled with cash (for special Treasury bonds the value is zero: Treasury does not
receive any cash from the allocation).
Treasury Bonds: Transactions

Instrument
ID
iid
BD0918251051
BD0918291057
BD0918331051
BD0923261103
BD0923301107
BD0928271156
BD0928311150
BD0933281208
BD0933321202

Issuance
Date

Maturity Settlement
Date
Date

idate
mdate
sdate
qty
2013-01-02
2018-01-02 2013-01-02
2013-02-06
2018-02-06 2013-02-06
2013-03-06
2018-03-06 2013-03-06
2013-01-09
2023-01-09 2013-01-09
2013-02-13
2023-02-13 2013-02-13
2013-01-16
2028-01-16 2013-01-16
2013-02-20
2028-02-20 2013-02-20
2013-01-23
2033-01-23 2013-01-23
2013-02-27
2033-02-27 2013-02-27

Accrued
Interest
Quantity Settlement
Cash
% of
Placed Price (dirty) Trans? Face Value
price
70,000
70,000
75,000
70,000
70,000
10,000
10,000
10,000
10,000

iscash
100.00%
100.07%
100.00%
100.00%
100.00%
100.00%
100.00%
100.00%
100.00%

percaccr
1
0.00%
1
0.00%
1
0.00%
1
0.00%
1
0.00%
1
0.00%
1
0.00%
1
0.00%
1
0.00%

Clean
Price

Nominal
Allotment

Settlement
Amount

cleanpricenominal
value
100.00% 7,000,000,000
7,000,000,000
100.07% 7,000,000,000
7,004,829,461
100.00% 7,500,000,000
7,500,000,000
100.00% 7,000,000,000
7,000,000,000
100.00% 7,000,000,000
7,000,000,000
100.00% 1,000,000,000
1,000,000,000
100.00% 1,000,000,000
1,000,000,000
100.00% 1,000,000,000
1,000,000,000
100.00% 1,000,000,000
1,000,000,000
The Accounts table records changes in budget accounts (proceeds from sale,
principal and coupon payments, change in Treasury Single Account, change in the
nominal value of debt outstanding) for each day of the chosen accounting period.
Additional accounts (e.g. discount/premium) may be defined.

Accounting Table
date
proceeds
principal
2013-01-01
0
2013-01-02
7,000,000,000
2013-01-03
0
2013-01-04
0
2013-01-05
0
2013-01-06
0
2013-01-07
0
2013-01-08
0
2013-01-09
7,000,000,000
2013-01-10
0
2013-01-11
0

coupon
0
0
0
0
0
0
0
0
0
0
0

0.00
469,200,000.00
0.00
864,400,000.00
238,250,000.00
123,900,000.00
383,724,520.00
212,625,000.00
152,150,000.00
127,500,000.00
758,000,000.00

tsa

cnomdebt
0.00
6,530,800,000.00
0.00
-864,400,000.00
-238,250,000.00
-123,900,000.00
-383,724,520.00
-212,625,000.00
6,847,850,000.00
-127,500,000.00
-758,000,000.00

nomdebt
0
856,765,013,000
7,000,000,000
863,765,013,000
0
863,765,013,000
0
863,765,013,000
0
863,765,013,000
0
863,765,013,000
0
863,765,013,000
0
863,765,013,000
7,000,000,000
870,765,013,000
0
870,765,013,000
0
870,765,013,000
The Report table summarizes flow and stock data from Accounts for each
month (flows), respective end-of-month (stocks)

Report: Cash Flow and Debt by Month/End of Month
Month/
Proceeds from
End of Month Primary Placement

Principal
Due

Coupon Payment
Due

period
proceeds
principal
coupon
31/01/2013
16,000,000,000.00
0.00 5,951,799,520.00
28/02/2013
16,004,829,461.30
0.00 6,081,754,150.00
31/03/2013
7,500,000,000.00
0.00 6,758,142,500.00
30/04/2013
0.00
0.00 6,736,035,475.00
31/05/2013
0.00
0.00 6,408,999,850.00
30/06/2013
0.00
4,113,920,000.00 7,049,621,200.00
31/07/2013
0.00
4,027,384,000.00 6,907,826,220.00
31/08/2013
0.00
3,633,600,000.00 7,406,854,150.00
30/09/2013
0.00 13,000,000,000.00 9,091,662,500.00
31/10/2013
0.00
6,366,900,000.00 8,371,240,475.00
30/11/2013
0.00
4,236,396,000.00 6,471,053,800.00
31/12/2013
0.00
4,100,000,000.00 8,119,046,200.00

Change of
Treasury
Single Account

Nominal Bond
Debt Outstanding
by End of Month

tsa
Nominal Debt Outstanding
10,048,200,480.00
872,765,013,000
9,923,075,311.30
888,765,013,000
741,857,500.00
896,265,013,000
-6,736,035,475.00
896,265,013,000
-6,408,999,850.00
896,265,013,000
-11,163,541,200.00
892,151,093,000
-10,935,210,220.00
888,123,709,000
-11,040,454,150.00
884,490,109,000
-22,091,662,500.00
871,490,109,000
-14,738,140,475.00
865,123,209,000
-10,707,449,800.00
860,886,813,000
-12,219,046,200.00
856,786,813,000
A similar Report can be created by using Pivot Table technique with
Accounts as source data.

Years
2011

2012

2013

date
Qtr1
Qtr2
Qtr3
Qtr4
Qtr1
Qtr2
Qtr3
Qtr4
Qtr1
Qtr2
Qtr3
Qtr4

Values
Sum of proceeds Sum of principal Sum of coupon
38,600,000,000.00
0 9,917,318,670
42,850,000,000.00
0 9,490,935,525
25,500,000,000.00
0 13,912,578,670
41,250,000,000.00
0 11,427,323,025
48,750,000,000.00
0 12,835,033,670
66,910,000,000.00
0 13,464,073,025
55,000,000,000.00
0 17,836,417,870
48,500,000,000.00
0 20,331,565,475
39,504,829,461.30
0 18,791,696,170
0.00
4,113,920,000 20,194,656,525
0.00 20,660,984,000 23,406,342,870
0.00 14,703,296,000 22,961,340,475

Sum of tsa
28,682,681,330.00
33,359,064,475.00
11,587,421,330.00
29,822,676,975.00
35,914,966,330.00
53,445,926,975.00
37,163,582,130.00
28,168,434,525.00
20,713,133,291.30
-24,308,576,525.00
-44,067,326,870.00
-37,664,636,475.00
Debt indicators can also easily derived from the Transactions enhanced
Cash Flow Table - 1

As of Reporting Date
Reporting Date

2013-05-20

Nominal Amount of Debt Outstanding on Reporting Date

BDT

Principal and Coupon due within next 3 months following Reporting Date BDT
Principal and Coupon due within next 12 months following Reporting Date BDT
Average Time to Maturity on Reporting Date

(days)
(years)

896,265,013,000
33,139,205,570
145,757,305,240
2356
6.45
Debt indicators can also easily derived from the Transactions enhanced
Cash Flow Table - 2

Quarterly Debt Report (crore)
2012-12-31
Debt Outstanding
Flows:
Proceeds
Principal
Interest
Debt Service
Treasury Single Account

85,677

2013-03-31 2013-06-30 2013-09-30 2013-12-31
89,627

89,215

87,149

85,679

3,950.48
0.00
1,879.17
1,879.17
2,071.31

0.00
411.39
2,019.47
2,430.86
-2,430.86

0.00
2,066.10
2,340.63
4,406.73
-4,406.73

0.00
1,470.33
2,296.13
3,766.46
-3,766.46
Applying a Pivot Table with the Cash Flow Table as source data and
filtering out instruments the information on, including the individual cash
flow table for a single instrument can be queried.

Cash Flow Cash Flow Table
Dates
Values
Instrument ID
tenor
freq
rate
issuance
maturity
facevalue
cf date
Sum of principal Sum of coupon
BD0916211057
5
2
8.50% 2011-12-07 2016-12-06
100,000 2012-06-07
0
4250
2012-12-07
0
4250
2013-06-07
0
4250
2013-12-07
0
4250
2014-06-07
0
4250
2014-12-07
0
4250
2015-06-07
0
4250
2015-12-07
0
4250
2016-06-07
0
4250
2016-12-07
100000
4250
Applying a Pivot Table with the enhanced Cash Flow Table as source data
and filtering out instruments the information on, including the individual
amortization profile a single instrument can be queried.

Cash Flow Amortization Table
Dates

1 - PAID
0 - SCHEDULED

Instrument ID
tenor
freq
rate
issuance
maturity
facevalue
cf date
Sum of aprin
Sum of acoup Sum of status
BD0916211057
5
2
8.50% 2011-12-07 2016-12-06
100,000 2012-06-07
0.00 212,500,000.00
1
2012-12-07
0.00 212,500,000.00
1
2013-06-07
0.00 212,500,000.00
0
2013-12-07
0.00 212,500,000.00
0
2014-06-07
0.00 212,500,000.00
0
2014-12-07
0.00 212,500,000.00
0
2015-06-07
0.00 212,500,000.00
0
2015-12-07
0.00 212,500,000.00
0
2016-06-07
0.00 212,500,000.00
0
2016-12-07 5,000,000,000.00 212,500,000.00
0

More Related Content

What's hot

Buques de cemento
Buques de cementoBuques de cemento
Buques de cemento
Juan Gonzalez Hernandez
 
Intro to Bond Portfolio Construction
Intro to Bond Portfolio ConstructionIntro to Bond Portfolio Construction
Intro to Bond Portfolio Construction
Konstantin Yakunenko, PhD, CFA, CAIA
 
Ppt emotional i ntelligence
Ppt emotional i ntelligencePpt emotional i ntelligence
Ppt emotional i ntelligence
smritibhambra
 
Responding to crisis assessing situational crisis communication of the costa...
Responding to crisis  assessing situational crisis communication of the costa...Responding to crisis  assessing situational crisis communication of the costa...
Responding to crisis assessing situational crisis communication of the costa...
Tine Grarup
 
Treasury Risk Management by Dr. Emmanuel Moore ABOLO
Treasury Risk Management by Dr. Emmanuel Moore ABOLOTreasury Risk Management by Dr. Emmanuel Moore ABOLO
Treasury Risk Management by Dr. Emmanuel Moore ABOLO
Dr. Emmanuel ABOLO, fica,fnimn,ficn,sirm
 
relation of PPP and IRP
relation of PPP and IRPrelation of PPP and IRP
relation of PPP and IRP
Sumit Das
 
CAPITAL ADEQUACY RATIO ppt.pdf
CAPITAL ADEQUACY RATIO ppt.pdfCAPITAL ADEQUACY RATIO ppt.pdf
CAPITAL ADEQUACY RATIO ppt.pdf
PriyaKumari923812
 
Liquidity Management.pptx
Liquidity Management.pptxLiquidity Management.pptx
Liquidity Management.pptx
Paramesh P
 
Treasury role in International Banking and global scenario
Treasury role in International Banking and global scenarioTreasury role in International Banking and global scenario
Treasury role in International Banking and global scenario
Manish Kumar
 
Working capital ppt
Working capital pptWorking capital ppt
Working capital ppt
rohitsharma2418
 
Budgeting & Saving PowerPoint
Budgeting & Saving PowerPointBudgeting & Saving PowerPoint
Budgeting & Saving PowerPointemurfield
 

What's hot (12)

Buques de cemento
Buques de cementoBuques de cemento
Buques de cemento
 
Emotional quotient
Emotional quotientEmotional quotient
Emotional quotient
 
Intro to Bond Portfolio Construction
Intro to Bond Portfolio ConstructionIntro to Bond Portfolio Construction
Intro to Bond Portfolio Construction
 
Ppt emotional i ntelligence
Ppt emotional i ntelligencePpt emotional i ntelligence
Ppt emotional i ntelligence
 
Responding to crisis assessing situational crisis communication of the costa...
Responding to crisis  assessing situational crisis communication of the costa...Responding to crisis  assessing situational crisis communication of the costa...
Responding to crisis assessing situational crisis communication of the costa...
 
Treasury Risk Management by Dr. Emmanuel Moore ABOLO
Treasury Risk Management by Dr. Emmanuel Moore ABOLOTreasury Risk Management by Dr. Emmanuel Moore ABOLO
Treasury Risk Management by Dr. Emmanuel Moore ABOLO
 
relation of PPP and IRP
relation of PPP and IRPrelation of PPP and IRP
relation of PPP and IRP
 
CAPITAL ADEQUACY RATIO ppt.pdf
CAPITAL ADEQUACY RATIO ppt.pdfCAPITAL ADEQUACY RATIO ppt.pdf
CAPITAL ADEQUACY RATIO ppt.pdf
 
Liquidity Management.pptx
Liquidity Management.pptxLiquidity Management.pptx
Liquidity Management.pptx
 
Treasury role in International Banking and global scenario
Treasury role in International Banking and global scenarioTreasury role in International Banking and global scenario
Treasury role in International Banking and global scenario
 
Working capital ppt
Working capital pptWorking capital ppt
Working capital ppt
 
Budgeting & Saving PowerPoint
Budgeting & Saving PowerPointBudgeting & Saving PowerPoint
Budgeting & Saving PowerPoint
 

Similar to Excel Workbook for Treasury Bond Portfolio Management

lotte chilsung 005300 Algorithm Investment Report
lotte chilsung 005300 Algorithm Investment Reportlotte chilsung 005300 Algorithm Investment Report
lotte chilsung 005300 Algorithm Investment Report
알고리즘 기업분석 컨설팅-알기컨,algikeon
 
protec 053610 Algorithm Investment Report.pdf
protec 053610 Algorithm Investment Report.pdfprotec 053610 Algorithm Investment Report.pdf
protec 053610 Algorithm Investment Report.pdf
알고리즘 기업분석 컨설팅-알기컨,algikeon
 
Quantitative Analysis of Retail Sector Companies
Quantitative Analysis of Retail Sector CompaniesQuantitative Analysis of Retail Sector Companies
Quantitative Analysis of Retail Sector Companies
prashantbhati354
 
sk 034730 Algorithm Investment Report
sk 034730 Algorithm Investment Reportsk 034730 Algorithm Investment Report
sk 034730 Algorithm Investment Report
알고리즘 기업분석 컨설팅-알기컨,algikeon
 
dongsuh 026960 Algorithm Investment Report
dongsuh 026960 Algorithm Investment Reportdongsuh 026960 Algorithm Investment Report
dongsuh 026960 Algorithm Investment Report
알고리즘 기업분석 컨설팅-알기컨,algikeon
 
choheung 002600 Algorithm Investment Report
choheung 002600 Algorithm Investment Reportchoheung 002600 Algorithm Investment Report
choheung 002600 Algorithm Investment Report
알고리즘 기업분석 컨설팅-알기컨,algikeon
 
amogreentech 125210 Algorithm Investment Report
amogreentech 125210 Algorithm Investment Reportamogreentech 125210 Algorithm Investment Report
amogreentech 125210 Algorithm Investment Report
알고리즘 기업분석 컨설팅-알기컨,algikeon
 
samsung electronics 005930 Algorithm Investment Report
samsung electronics 005930 Algorithm Investment Reportsamsung electronics 005930 Algorithm Investment Report
samsung electronics 005930 Algorithm Investment Report
알고리즘 기업분석 컨설팅-알기컨,algikeon
 
datasolution 263800 Algorithm Investment Report
datasolution 263800 Algorithm Investment Reportdatasolution 263800 Algorithm Investment Report
datasolution 263800 Algorithm Investment Report
알고리즘 기업분석 컨설팅-알기컨,algikeon
 
sunjin 136490 Algorithm Investment Report
sunjin 136490 Algorithm Investment Reportsunjin 136490 Algorithm Investment Report
sunjin 136490 Algorithm Investment Report
알고리즘 기업분석 컨설팅-알기컨,algikeon
 
samyang foods 003230 Algorithm Investment Report
samyang foods 003230 Algorithm Investment Reportsamyang foods 003230 Algorithm Investment Report
samyang foods 003230 Algorithm Investment Report
알고리즘 기업분석 컨설팅-알기컨,algikeon
 
ccs 066790 Algorithm Investement Report
ccs 066790 Algorithm Investement Reportccs 066790 Algorithm Investement Report
ccs 066790 Algorithm Investement Report
알고리즘 기업분석 컨설팅-알기컨,algikeon
 
GuessBox Financial Model 2017
GuessBox Financial Model 2017GuessBox Financial Model 2017
GuessBox Financial Model 2017
GuessBox
 
hitejinro holdings 000140 Algorithm Investment Report
hitejinro holdings 000140 Algorithm Investment Reporthitejinro holdings 000140 Algorithm Investment Report
hitejinro holdings 000140 Algorithm Investment Report
알고리즘 기업분석 컨설팅-알기컨,algikeon
 
samsung engineering 028050 Algorithm Investment Report
samsung engineering 028050 Algorithm Investment Reportsamsung engineering 028050 Algorithm Investment Report
samsung engineering 028050 Algorithm Investment Report
알고리즘 기업분석 컨설팅-알기컨,algikeon
 
celltrion 068270 Algorithm Investment Report
celltrion 068270 Algorithm Investment Reportcelltrion 068270 Algorithm Investment Report
celltrion 068270 Algorithm Investment Report
알고리즘 기업분석 컨설팅-알기컨,algikeon
 
kakao 035720 Algorithm Investment Report
kakao 035720 Algorithm Investment Reportkakao 035720 Algorithm Investment Report
kakao 035720 Algorithm Investment Report
알고리즘 기업분석 컨설팅-알기컨,algikeon
 
NC soft 036570 Algorithm Investment Report
NC soft 036570 Algorithm Investment ReportNC soft 036570 Algorithm Investment Report
NC soft 036570 Algorithm Investment Report
알고리즘 기업분석 컨설팅-알기컨,algikeon
 
poongsan 103140 Algorithm Investment Report
poongsan 103140 Algorithm Investment Reportpoongsan 103140 Algorithm Investment Report
poongsan 103140 Algorithm Investment Report
알고리즘 기업분석 컨설팅-알기컨,algikeon
 
gs enc 006360 Algorithm Investment Report
gs enc 006360 Algorithm Investment Reportgs enc 006360 Algorithm Investment Report
gs enc 006360 Algorithm Investment Report
알고리즘 기업분석 컨설팅-알기컨,algikeon
 

Similar to Excel Workbook for Treasury Bond Portfolio Management (20)

lotte chilsung 005300 Algorithm Investment Report
lotte chilsung 005300 Algorithm Investment Reportlotte chilsung 005300 Algorithm Investment Report
lotte chilsung 005300 Algorithm Investment Report
 
protec 053610 Algorithm Investment Report.pdf
protec 053610 Algorithm Investment Report.pdfprotec 053610 Algorithm Investment Report.pdf
protec 053610 Algorithm Investment Report.pdf
 
Quantitative Analysis of Retail Sector Companies
Quantitative Analysis of Retail Sector CompaniesQuantitative Analysis of Retail Sector Companies
Quantitative Analysis of Retail Sector Companies
 
sk 034730 Algorithm Investment Report
sk 034730 Algorithm Investment Reportsk 034730 Algorithm Investment Report
sk 034730 Algorithm Investment Report
 
dongsuh 026960 Algorithm Investment Report
dongsuh 026960 Algorithm Investment Reportdongsuh 026960 Algorithm Investment Report
dongsuh 026960 Algorithm Investment Report
 
choheung 002600 Algorithm Investment Report
choheung 002600 Algorithm Investment Reportchoheung 002600 Algorithm Investment Report
choheung 002600 Algorithm Investment Report
 
amogreentech 125210 Algorithm Investment Report
amogreentech 125210 Algorithm Investment Reportamogreentech 125210 Algorithm Investment Report
amogreentech 125210 Algorithm Investment Report
 
samsung electronics 005930 Algorithm Investment Report
samsung electronics 005930 Algorithm Investment Reportsamsung electronics 005930 Algorithm Investment Report
samsung electronics 005930 Algorithm Investment Report
 
datasolution 263800 Algorithm Investment Report
datasolution 263800 Algorithm Investment Reportdatasolution 263800 Algorithm Investment Report
datasolution 263800 Algorithm Investment Report
 
sunjin 136490 Algorithm Investment Report
sunjin 136490 Algorithm Investment Reportsunjin 136490 Algorithm Investment Report
sunjin 136490 Algorithm Investment Report
 
samyang foods 003230 Algorithm Investment Report
samyang foods 003230 Algorithm Investment Reportsamyang foods 003230 Algorithm Investment Report
samyang foods 003230 Algorithm Investment Report
 
ccs 066790 Algorithm Investement Report
ccs 066790 Algorithm Investement Reportccs 066790 Algorithm Investement Report
ccs 066790 Algorithm Investement Report
 
GuessBox Financial Model 2017
GuessBox Financial Model 2017GuessBox Financial Model 2017
GuessBox Financial Model 2017
 
hitejinro holdings 000140 Algorithm Investment Report
hitejinro holdings 000140 Algorithm Investment Reporthitejinro holdings 000140 Algorithm Investment Report
hitejinro holdings 000140 Algorithm Investment Report
 
samsung engineering 028050 Algorithm Investment Report
samsung engineering 028050 Algorithm Investment Reportsamsung engineering 028050 Algorithm Investment Report
samsung engineering 028050 Algorithm Investment Report
 
celltrion 068270 Algorithm Investment Report
celltrion 068270 Algorithm Investment Reportcelltrion 068270 Algorithm Investment Report
celltrion 068270 Algorithm Investment Report
 
kakao 035720 Algorithm Investment Report
kakao 035720 Algorithm Investment Reportkakao 035720 Algorithm Investment Report
kakao 035720 Algorithm Investment Report
 
NC soft 036570 Algorithm Investment Report
NC soft 036570 Algorithm Investment ReportNC soft 036570 Algorithm Investment Report
NC soft 036570 Algorithm Investment Report
 
poongsan 103140 Algorithm Investment Report
poongsan 103140 Algorithm Investment Reportpoongsan 103140 Algorithm Investment Report
poongsan 103140 Algorithm Investment Report
 
gs enc 006360 Algorithm Investment Report
gs enc 006360 Algorithm Investment Reportgs enc 006360 Algorithm Investment Report
gs enc 006360 Algorithm Investment Report
 

Recently uploaded

NO1 Uk Divorce problem uk all amil baba in karachi,lahore,pakistan talaq ka m...
NO1 Uk Divorce problem uk all amil baba in karachi,lahore,pakistan talaq ka m...NO1 Uk Divorce problem uk all amil baba in karachi,lahore,pakistan talaq ka m...
NO1 Uk Divorce problem uk all amil baba in karachi,lahore,pakistan talaq ka m...
Amil Baba Dawood bangali
 
The new type of smart, sustainable entrepreneurship and the next day | Europe...
The new type of smart, sustainable entrepreneurship and the next day | Europe...The new type of smart, sustainable entrepreneurship and the next day | Europe...
The new type of smart, sustainable entrepreneurship and the next day | Europe...
Antonis Zairis
 
PF-Wagner's Theory of Public Expenditure.pptx
PF-Wagner's Theory of Public Expenditure.pptxPF-Wagner's Theory of Public Expenditure.pptx
PF-Wagner's Theory of Public Expenditure.pptx
GunjanSharma28848
 
how to sell pi coins effectively (from 50 - 100k pi)
how to sell pi coins effectively (from 50 - 100k  pi)how to sell pi coins effectively (from 50 - 100k  pi)
how to sell pi coins effectively (from 50 - 100k pi)
DOT TECH
 
Which Crypto to Buy Today for Short-Term in May-June 2024.pdf
Which Crypto to Buy Today for Short-Term in May-June 2024.pdfWhich Crypto to Buy Today for Short-Term in May-June 2024.pdf
Which Crypto to Buy Today for Short-Term in May-June 2024.pdf
Kezex (KZX)
 
NO1 Uk Black Magic Specialist Expert In Sahiwal, Okara, Hafizabad, Mandi Bah...
NO1 Uk Black Magic Specialist Expert In Sahiwal, Okara, Hafizabad,  Mandi Bah...NO1 Uk Black Magic Specialist Expert In Sahiwal, Okara, Hafizabad,  Mandi Bah...
NO1 Uk Black Magic Specialist Expert In Sahiwal, Okara, Hafizabad, Mandi Bah...
Amil Baba Dawood bangali
 
NO1 Uk Rohani Baba In Karachi Bangali Baba Karachi Online Amil Baba WorldWide...
NO1 Uk Rohani Baba In Karachi Bangali Baba Karachi Online Amil Baba WorldWide...NO1 Uk Rohani Baba In Karachi Bangali Baba Karachi Online Amil Baba WorldWide...
NO1 Uk Rohani Baba In Karachi Bangali Baba Karachi Online Amil Baba WorldWide...
Amil baba
 
Greek trade a pillar of dynamic economic growth - European Business Review
Greek trade a pillar of dynamic economic growth - European Business ReviewGreek trade a pillar of dynamic economic growth - European Business Review
Greek trade a pillar of dynamic economic growth - European Business Review
Antonis Zairis
 
Introduction to Indian Financial System ()
Introduction to Indian Financial System ()Introduction to Indian Financial System ()
Introduction to Indian Financial System ()
Avanish Goel
 
What website can I sell pi coins securely.
What website can I sell pi coins securely.What website can I sell pi coins securely.
What website can I sell pi coins securely.
DOT TECH
 
how to sell pi coins in all Africa Countries.
how to sell pi coins in all Africa Countries.how to sell pi coins in all Africa Countries.
how to sell pi coins in all Africa Countries.
DOT TECH
 
Webinar Exploring DORA for Fintechs - Simont Braun
Webinar Exploring DORA for Fintechs - Simont BraunWebinar Exploring DORA for Fintechs - Simont Braun
Webinar Exploring DORA for Fintechs - Simont Braun
FinTech Belgium
 
what is the future of Pi Network currency.
what is the future of Pi Network currency.what is the future of Pi Network currency.
what is the future of Pi Network currency.
DOT TECH
 
how can i use my minded pi coins I need some funds.
how can i use my minded pi coins I need some funds.how can i use my minded pi coins I need some funds.
how can i use my minded pi coins I need some funds.
DOT TECH
 
What price will pi network be listed on exchanges
What price will pi network be listed on exchangesWhat price will pi network be listed on exchanges
What price will pi network be listed on exchanges
DOT TECH
 
how to sell pi coins in South Korea profitably.
how to sell pi coins in South Korea profitably.how to sell pi coins in South Korea profitably.
how to sell pi coins in South Korea profitably.
DOT TECH
 
一比一原版BCU毕业证伯明翰城市大学毕业证成绩单如何办理
一比一原版BCU毕业证伯明翰城市大学毕业证成绩单如何办理一比一原版BCU毕业证伯明翰城市大学毕业证成绩单如何办理
一比一原版BCU毕业证伯明翰城市大学毕业证成绩单如何办理
ydubwyt
 
Economics and Economic reasoning Chap. 1
Economics and Economic reasoning Chap. 1Economics and Economic reasoning Chap. 1
Economics and Economic reasoning Chap. 1
Fitri Safira
 
what is the best method to sell pi coins in 2024
what is the best method to sell pi coins in 2024what is the best method to sell pi coins in 2024
what is the best method to sell pi coins in 2024
DOT TECH
 
how can I sell my pi coins for cash in a pi APP
how can I sell my pi coins for cash in a pi APPhow can I sell my pi coins for cash in a pi APP
how can I sell my pi coins for cash in a pi APP
DOT TECH
 

Recently uploaded (20)

NO1 Uk Divorce problem uk all amil baba in karachi,lahore,pakistan talaq ka m...
NO1 Uk Divorce problem uk all amil baba in karachi,lahore,pakistan talaq ka m...NO1 Uk Divorce problem uk all amil baba in karachi,lahore,pakistan talaq ka m...
NO1 Uk Divorce problem uk all amil baba in karachi,lahore,pakistan talaq ka m...
 
The new type of smart, sustainable entrepreneurship and the next day | Europe...
The new type of smart, sustainable entrepreneurship and the next day | Europe...The new type of smart, sustainable entrepreneurship and the next day | Europe...
The new type of smart, sustainable entrepreneurship and the next day | Europe...
 
PF-Wagner's Theory of Public Expenditure.pptx
PF-Wagner's Theory of Public Expenditure.pptxPF-Wagner's Theory of Public Expenditure.pptx
PF-Wagner's Theory of Public Expenditure.pptx
 
how to sell pi coins effectively (from 50 - 100k pi)
how to sell pi coins effectively (from 50 - 100k  pi)how to sell pi coins effectively (from 50 - 100k  pi)
how to sell pi coins effectively (from 50 - 100k pi)
 
Which Crypto to Buy Today for Short-Term in May-June 2024.pdf
Which Crypto to Buy Today for Short-Term in May-June 2024.pdfWhich Crypto to Buy Today for Short-Term in May-June 2024.pdf
Which Crypto to Buy Today for Short-Term in May-June 2024.pdf
 
NO1 Uk Black Magic Specialist Expert In Sahiwal, Okara, Hafizabad, Mandi Bah...
NO1 Uk Black Magic Specialist Expert In Sahiwal, Okara, Hafizabad,  Mandi Bah...NO1 Uk Black Magic Specialist Expert In Sahiwal, Okara, Hafizabad,  Mandi Bah...
NO1 Uk Black Magic Specialist Expert In Sahiwal, Okara, Hafizabad, Mandi Bah...
 
NO1 Uk Rohani Baba In Karachi Bangali Baba Karachi Online Amil Baba WorldWide...
NO1 Uk Rohani Baba In Karachi Bangali Baba Karachi Online Amil Baba WorldWide...NO1 Uk Rohani Baba In Karachi Bangali Baba Karachi Online Amil Baba WorldWide...
NO1 Uk Rohani Baba In Karachi Bangali Baba Karachi Online Amil Baba WorldWide...
 
Greek trade a pillar of dynamic economic growth - European Business Review
Greek trade a pillar of dynamic economic growth - European Business ReviewGreek trade a pillar of dynamic economic growth - European Business Review
Greek trade a pillar of dynamic economic growth - European Business Review
 
Introduction to Indian Financial System ()
Introduction to Indian Financial System ()Introduction to Indian Financial System ()
Introduction to Indian Financial System ()
 
What website can I sell pi coins securely.
What website can I sell pi coins securely.What website can I sell pi coins securely.
What website can I sell pi coins securely.
 
how to sell pi coins in all Africa Countries.
how to sell pi coins in all Africa Countries.how to sell pi coins in all Africa Countries.
how to sell pi coins in all Africa Countries.
 
Webinar Exploring DORA for Fintechs - Simont Braun
Webinar Exploring DORA for Fintechs - Simont BraunWebinar Exploring DORA for Fintechs - Simont Braun
Webinar Exploring DORA for Fintechs - Simont Braun
 
what is the future of Pi Network currency.
what is the future of Pi Network currency.what is the future of Pi Network currency.
what is the future of Pi Network currency.
 
how can i use my minded pi coins I need some funds.
how can i use my minded pi coins I need some funds.how can i use my minded pi coins I need some funds.
how can i use my minded pi coins I need some funds.
 
What price will pi network be listed on exchanges
What price will pi network be listed on exchangesWhat price will pi network be listed on exchanges
What price will pi network be listed on exchanges
 
how to sell pi coins in South Korea profitably.
how to sell pi coins in South Korea profitably.how to sell pi coins in South Korea profitably.
how to sell pi coins in South Korea profitably.
 
一比一原版BCU毕业证伯明翰城市大学毕业证成绩单如何办理
一比一原版BCU毕业证伯明翰城市大学毕业证成绩单如何办理一比一原版BCU毕业证伯明翰城市大学毕业证成绩单如何办理
一比一原版BCU毕业证伯明翰城市大学毕业证成绩单如何办理
 
Economics and Economic reasoning Chap. 1
Economics and Economic reasoning Chap. 1Economics and Economic reasoning Chap. 1
Economics and Economic reasoning Chap. 1
 
what is the best method to sell pi coins in 2024
what is the best method to sell pi coins in 2024what is the best method to sell pi coins in 2024
what is the best method to sell pi coins in 2024
 
how can I sell my pi coins for cash in a pi APP
how can I sell my pi coins for cash in a pi APPhow can I sell my pi coins for cash in a pi APP
how can I sell my pi coins for cash in a pi APP
 

Excel Workbook for Treasury Bond Portfolio Management

  • 1. Excel Workbook for Treatment of a large Treasury Bond Portfolio By Werner Riecke
  • 2. The Cash Flow Table for all T-bonds is generated based on parameters of the Instruments table. All transactions (first primary placement, re-opening, buy back) are recorded in the Transactions table. Accounts table keeps track of daily changes in government securities related budget accounts. Reports table(s) provide stock and flow data on governments securities for selected time periods. Cash Flow Table Transactions Instruments Accounts Reports
  • 3. On March 6, 2013 Bangladesh Bank Debt Management Department kept 320 issued, not yet matured (“active”) Treasury bonds in its files. Instruments table keeps track of the main parameters of T-bonds. Treasury Bonds: Issuance Data Reporting Date # of Securities o/w matured Serial Number serial 2013-05-19 320 0 Issuance Date Maturity Date First 2003-12-29 2013-06-18 Last 2013-03-06 2033-02-27 Instrument ID Issuance Date Maturity Date Face Value Coupon Rate iid 312 313 314 315 316 317 318 319 320 Tenor Coupon (years) Frequency tenor idate mdate fval coupon BD0918251051 BD0923261103 BD0928271156 BD0933281208 BD0918291057 BD0923301107 BD0928311150 BD0933321202 BD0918331051 freq 5 10 15 20 5 10 15 20 5 2 2 2 2 2 2 2 2 2 2013-01-02 2013-01-09 2013-01-16 2013-01-23 2013-02-06 2013-02-13 2013-02-20 2013-02-27 2013-03-06 2018-01-02 2023-01-09 2028-01-16 2033-01-23 2018-02-06 2023-02-13 2028-02-20 2033-02-27 2018-03-06 100,000 100,000 100,000 100,000 100,000 100,000 100,000 100,000 100,000 11.62% 11.90% 12.20% 12.38% 11.72% 12.00% 12.30% 12.48% 11.82%
  • 4. The Cash Flow Table contains the cash flow dates and amounts (principal and coupon) for each bond of the portfolio, below shown for one bond in the last three columns of the table. Data of the preceding columns is derived from the Instruments table. Currently the Cash Flow Table contains 7173 records, cash amounts of 320 bonds. #flow dates and 7173 of records Instrument ID iid BD0913011104 BD0913011104 BD0913011104 BD0913011104 BD0913011104 BD0913011104 BD0913011104 BD0913011104 BD0913011104 BD0913011104 BD0913011104 BD0913011104 BD0913011104 BD0913011104 BD0913011104 BD0913011104 BD0913011104 BD0913011104 BD0913011104 BD0913011104 Issuance Date idate Maturity Date Tenor (Years) mdate tenor 2003-12-29 2013-12-28 2003-12-29 2013-12-28 2003-12-29 2013-12-28 2003-12-29 2013-12-28 2003-12-29 2013-12-28 2003-12-29 2013-12-28 2003-12-29 2013-12-28 2003-12-29 2013-12-28 2003-12-29 2013-12-28 2003-12-29 2013-12-28 2003-12-29 2013-12-28 2003-12-29 2013-12-28 2003-12-29 2013-12-28 2003-12-29 2013-12-28 2003-12-29 2013-12-28 2003-12-29 2013-12-28 2003-12-29 2013-12-28 2003-12-29 2013-12-28 2003-12-29 2013-12-28 2003-12-29 2013-12-28 Face Value fval 10 10 10 10 10 10 10 10 10 10 10 10 10 10 10 10 10 10 10 10 Coupon Coupon Frequency Rate cfreq 100,000 100,000 100,000 100,000 100,000 100,000 100,000 100,000 100,000 100,000 100,000 100,000 100,000 100,000 100,000 100,000 100,000 100,000 100,000 100,000 Cash Flow Date Principal Coupon couponrate cfdate principal coupon 2 8.50% 2004-06-29 0 2 8.50% 2004-12-29 0 2 8.50% 2005-06-29 0 2 8.50% 2005-12-29 0 2 8.50% 2006-06-29 0 2 8.50% 2006-12-29 0 2 8.50% 2007-06-29 0 2 8.50% 2007-12-29 0 2 8.50% 2008-06-29 0 2 8.50% 2008-12-29 0 2 8.50% 2009-06-29 0 2 8.50% 2009-12-29 0 2 8.50% 2010-06-29 0 2 8.50% 2010-12-29 0 2 8.50% 2011-06-29 0 2 8.50% 2011-12-29 0 2 8.50% 2012-06-29 0 2 8.50% 2012-12-29 0 2 8.50% 2013-06-29 0 2 8.50% 2013-12-29 100,000 4250.0000 4250.0000 4250.0000 4250.0000 4250.0000 4250.0000 4250.0000 4250.0000 4250.0000 4250.0000 4250.0000 4250.0000 4250.0000 4250.0000 4250.0000 4250.0000 4250.0000 4250.0000 4250.0000 4250.0000
  • 5. The Transactions table contains the transactions (sales and buy backs) of Treasury bonds. Input parameters are transaction settlement date, quantity, settlement price (in % of face value) and an indication of whether the transaction is settled with cash (for special Treasury bonds the value is zero: Treasury does not receive any cash from the allocation). Treasury Bonds: Transactions Instrument ID iid BD0918251051 BD0918291057 BD0918331051 BD0923261103 BD0923301107 BD0928271156 BD0928311150 BD0933281208 BD0933321202 Issuance Date Maturity Settlement Date Date idate mdate sdate qty 2013-01-02 2018-01-02 2013-01-02 2013-02-06 2018-02-06 2013-02-06 2013-03-06 2018-03-06 2013-03-06 2013-01-09 2023-01-09 2013-01-09 2013-02-13 2023-02-13 2013-02-13 2013-01-16 2028-01-16 2013-01-16 2013-02-20 2028-02-20 2013-02-20 2013-01-23 2033-01-23 2013-01-23 2013-02-27 2033-02-27 2013-02-27 Accrued Interest Quantity Settlement Cash % of Placed Price (dirty) Trans? Face Value price 70,000 70,000 75,000 70,000 70,000 10,000 10,000 10,000 10,000 iscash 100.00% 100.07% 100.00% 100.00% 100.00% 100.00% 100.00% 100.00% 100.00% percaccr 1 0.00% 1 0.00% 1 0.00% 1 0.00% 1 0.00% 1 0.00% 1 0.00% 1 0.00% 1 0.00% Clean Price Nominal Allotment Settlement Amount cleanpricenominal value 100.00% 7,000,000,000 7,000,000,000 100.07% 7,000,000,000 7,004,829,461 100.00% 7,500,000,000 7,500,000,000 100.00% 7,000,000,000 7,000,000,000 100.00% 7,000,000,000 7,000,000,000 100.00% 1,000,000,000 1,000,000,000 100.00% 1,000,000,000 1,000,000,000 100.00% 1,000,000,000 1,000,000,000 100.00% 1,000,000,000 1,000,000,000
  • 6. The Accounts table records changes in budget accounts (proceeds from sale, principal and coupon payments, change in Treasury Single Account, change in the nominal value of debt outstanding) for each day of the chosen accounting period. Additional accounts (e.g. discount/premium) may be defined. Accounting Table date proceeds principal 2013-01-01 0 2013-01-02 7,000,000,000 2013-01-03 0 2013-01-04 0 2013-01-05 0 2013-01-06 0 2013-01-07 0 2013-01-08 0 2013-01-09 7,000,000,000 2013-01-10 0 2013-01-11 0 coupon 0 0 0 0 0 0 0 0 0 0 0 0.00 469,200,000.00 0.00 864,400,000.00 238,250,000.00 123,900,000.00 383,724,520.00 212,625,000.00 152,150,000.00 127,500,000.00 758,000,000.00 tsa cnomdebt 0.00 6,530,800,000.00 0.00 -864,400,000.00 -238,250,000.00 -123,900,000.00 -383,724,520.00 -212,625,000.00 6,847,850,000.00 -127,500,000.00 -758,000,000.00 nomdebt 0 856,765,013,000 7,000,000,000 863,765,013,000 0 863,765,013,000 0 863,765,013,000 0 863,765,013,000 0 863,765,013,000 0 863,765,013,000 0 863,765,013,000 7,000,000,000 870,765,013,000 0 870,765,013,000 0 870,765,013,000
  • 7. The Report table summarizes flow and stock data from Accounts for each month (flows), respective end-of-month (stocks) Report: Cash Flow and Debt by Month/End of Month Month/ Proceeds from End of Month Primary Placement Principal Due Coupon Payment Due period proceeds principal coupon 31/01/2013 16,000,000,000.00 0.00 5,951,799,520.00 28/02/2013 16,004,829,461.30 0.00 6,081,754,150.00 31/03/2013 7,500,000,000.00 0.00 6,758,142,500.00 30/04/2013 0.00 0.00 6,736,035,475.00 31/05/2013 0.00 0.00 6,408,999,850.00 30/06/2013 0.00 4,113,920,000.00 7,049,621,200.00 31/07/2013 0.00 4,027,384,000.00 6,907,826,220.00 31/08/2013 0.00 3,633,600,000.00 7,406,854,150.00 30/09/2013 0.00 13,000,000,000.00 9,091,662,500.00 31/10/2013 0.00 6,366,900,000.00 8,371,240,475.00 30/11/2013 0.00 4,236,396,000.00 6,471,053,800.00 31/12/2013 0.00 4,100,000,000.00 8,119,046,200.00 Change of Treasury Single Account Nominal Bond Debt Outstanding by End of Month tsa Nominal Debt Outstanding 10,048,200,480.00 872,765,013,000 9,923,075,311.30 888,765,013,000 741,857,500.00 896,265,013,000 -6,736,035,475.00 896,265,013,000 -6,408,999,850.00 896,265,013,000 -11,163,541,200.00 892,151,093,000 -10,935,210,220.00 888,123,709,000 -11,040,454,150.00 884,490,109,000 -22,091,662,500.00 871,490,109,000 -14,738,140,475.00 865,123,209,000 -10,707,449,800.00 860,886,813,000 -12,219,046,200.00 856,786,813,000
  • 8. A similar Report can be created by using Pivot Table technique with Accounts as source data. Years 2011 2012 2013 date Qtr1 Qtr2 Qtr3 Qtr4 Qtr1 Qtr2 Qtr3 Qtr4 Qtr1 Qtr2 Qtr3 Qtr4 Values Sum of proceeds Sum of principal Sum of coupon 38,600,000,000.00 0 9,917,318,670 42,850,000,000.00 0 9,490,935,525 25,500,000,000.00 0 13,912,578,670 41,250,000,000.00 0 11,427,323,025 48,750,000,000.00 0 12,835,033,670 66,910,000,000.00 0 13,464,073,025 55,000,000,000.00 0 17,836,417,870 48,500,000,000.00 0 20,331,565,475 39,504,829,461.30 0 18,791,696,170 0.00 4,113,920,000 20,194,656,525 0.00 20,660,984,000 23,406,342,870 0.00 14,703,296,000 22,961,340,475 Sum of tsa 28,682,681,330.00 33,359,064,475.00 11,587,421,330.00 29,822,676,975.00 35,914,966,330.00 53,445,926,975.00 37,163,582,130.00 28,168,434,525.00 20,713,133,291.30 -24,308,576,525.00 -44,067,326,870.00 -37,664,636,475.00
  • 9. Debt indicators can also easily derived from the Transactions enhanced Cash Flow Table - 1 As of Reporting Date Reporting Date 2013-05-20 Nominal Amount of Debt Outstanding on Reporting Date BDT Principal and Coupon due within next 3 months following Reporting Date BDT Principal and Coupon due within next 12 months following Reporting Date BDT Average Time to Maturity on Reporting Date Average Time to Maturity on Reporting Date (days) (years) 896,265,013,000 33,139,205,570 145,757,305,240 2356 6.45
  • 10. Debt indicators can also easily derived from the Transactions enhanced Cash Flow Table - 2 Quarterly Debt Report (crore) 2012-12-31 Debt Outstanding Flows: Proceeds Principal Interest Debt Service Treasury Single Account 85,677 2013-03-31 2013-06-30 2013-09-30 2013-12-31 89,627 89,215 87,149 85,679 3,950.48 0.00 1,879.17 1,879.17 2,071.31 0.00 411.39 2,019.47 2,430.86 -2,430.86 0.00 2,066.10 2,340.63 4,406.73 -4,406.73 0.00 1,470.33 2,296.13 3,766.46 -3,766.46
  • 11. Applying a Pivot Table with the Cash Flow Table as source data and filtering out instruments the information on, including the individual cash flow table for a single instrument can be queried. Cash Flow Cash Flow Table Dates Values Instrument ID tenor freq rate issuance maturity facevalue cf date Sum of principal Sum of coupon BD0916211057 5 2 8.50% 2011-12-07 2016-12-06 100,000 2012-06-07 0 4250 2012-12-07 0 4250 2013-06-07 0 4250 2013-12-07 0 4250 2014-06-07 0 4250 2014-12-07 0 4250 2015-06-07 0 4250 2015-12-07 0 4250 2016-06-07 0 4250 2016-12-07 100000 4250
  • 12. Applying a Pivot Table with the enhanced Cash Flow Table as source data and filtering out instruments the information on, including the individual amortization profile a single instrument can be queried. Cash Flow Amortization Table Dates 1 - PAID 0 - SCHEDULED Instrument ID tenor freq rate issuance maturity facevalue cf date Sum of aprin Sum of acoup Sum of status BD0916211057 5 2 8.50% 2011-12-07 2016-12-06 100,000 2012-06-07 0.00 212,500,000.00 1 2012-12-07 0.00 212,500,000.00 1 2013-06-07 0.00 212,500,000.00 0 2013-12-07 0.00 212,500,000.00 0 2014-06-07 0.00 212,500,000.00 0 2014-12-07 0.00 212,500,000.00 0 2015-06-07 0.00 212,500,000.00 0 2015-12-07 0.00 212,500,000.00 0 2016-06-07 0.00 212,500,000.00 0 2016-12-07 5,000,000,000.00 212,500,000.00 0