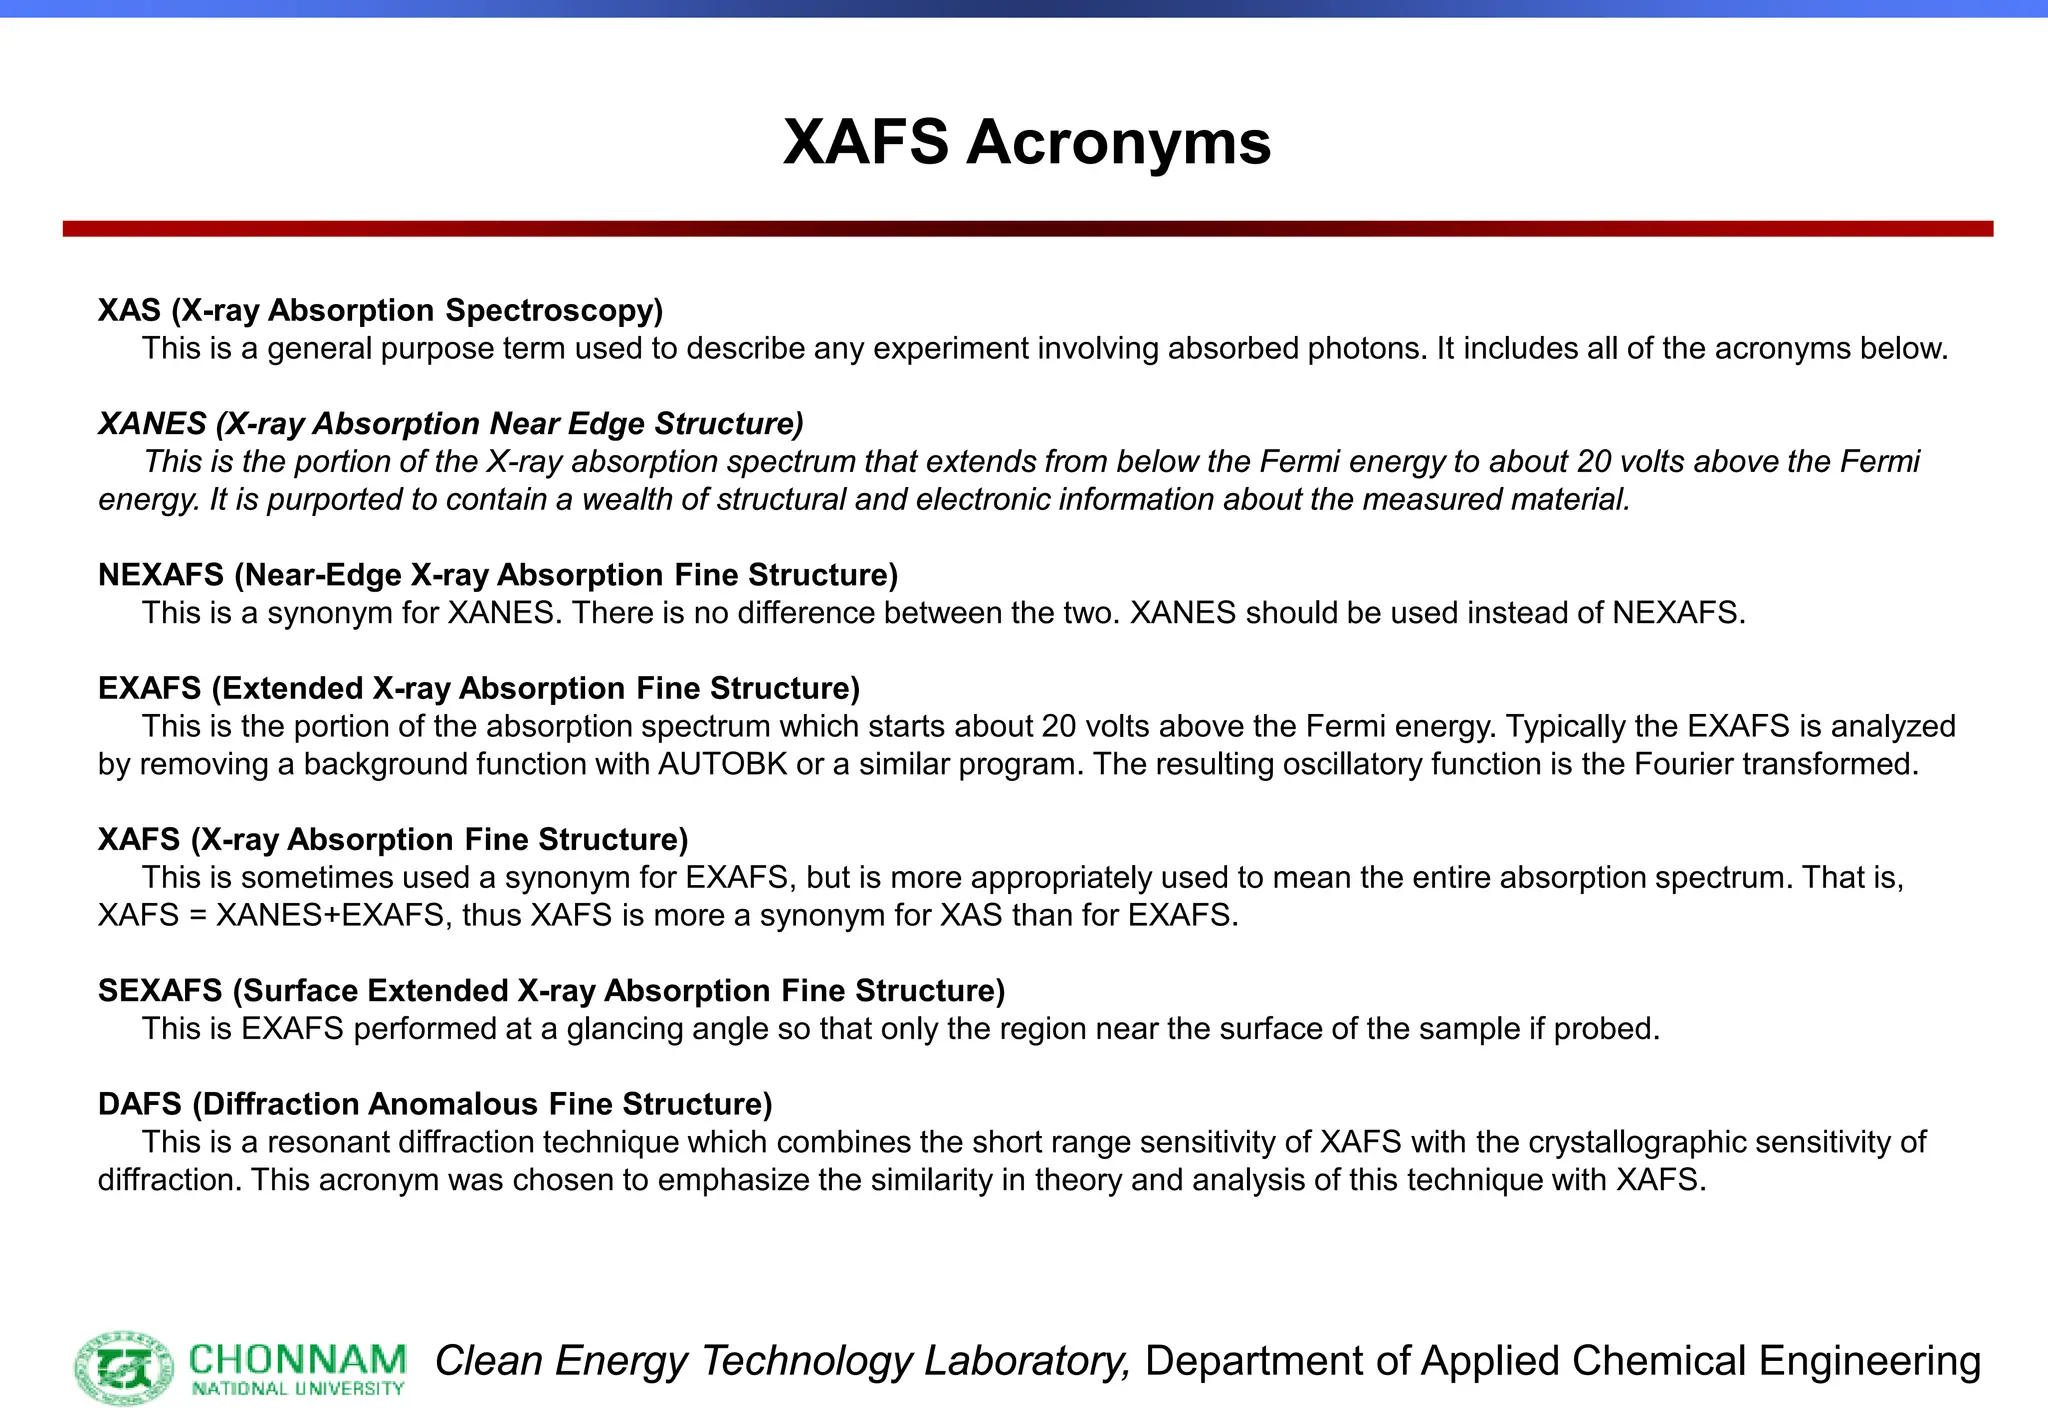
EXAFS (Extended X-ray Absorption Fine Structure)
This is the portion of the absorption spectrum which starts about 20 volts above the Fermi energy. Typically the EXAFS is analyzed
by removing a background function with AUTOBK or a similar program. The resulting oscillatory function is the Fourier transformed.
![Clean Energy Technology Laboratory, Department of Applied Chemical Engineering
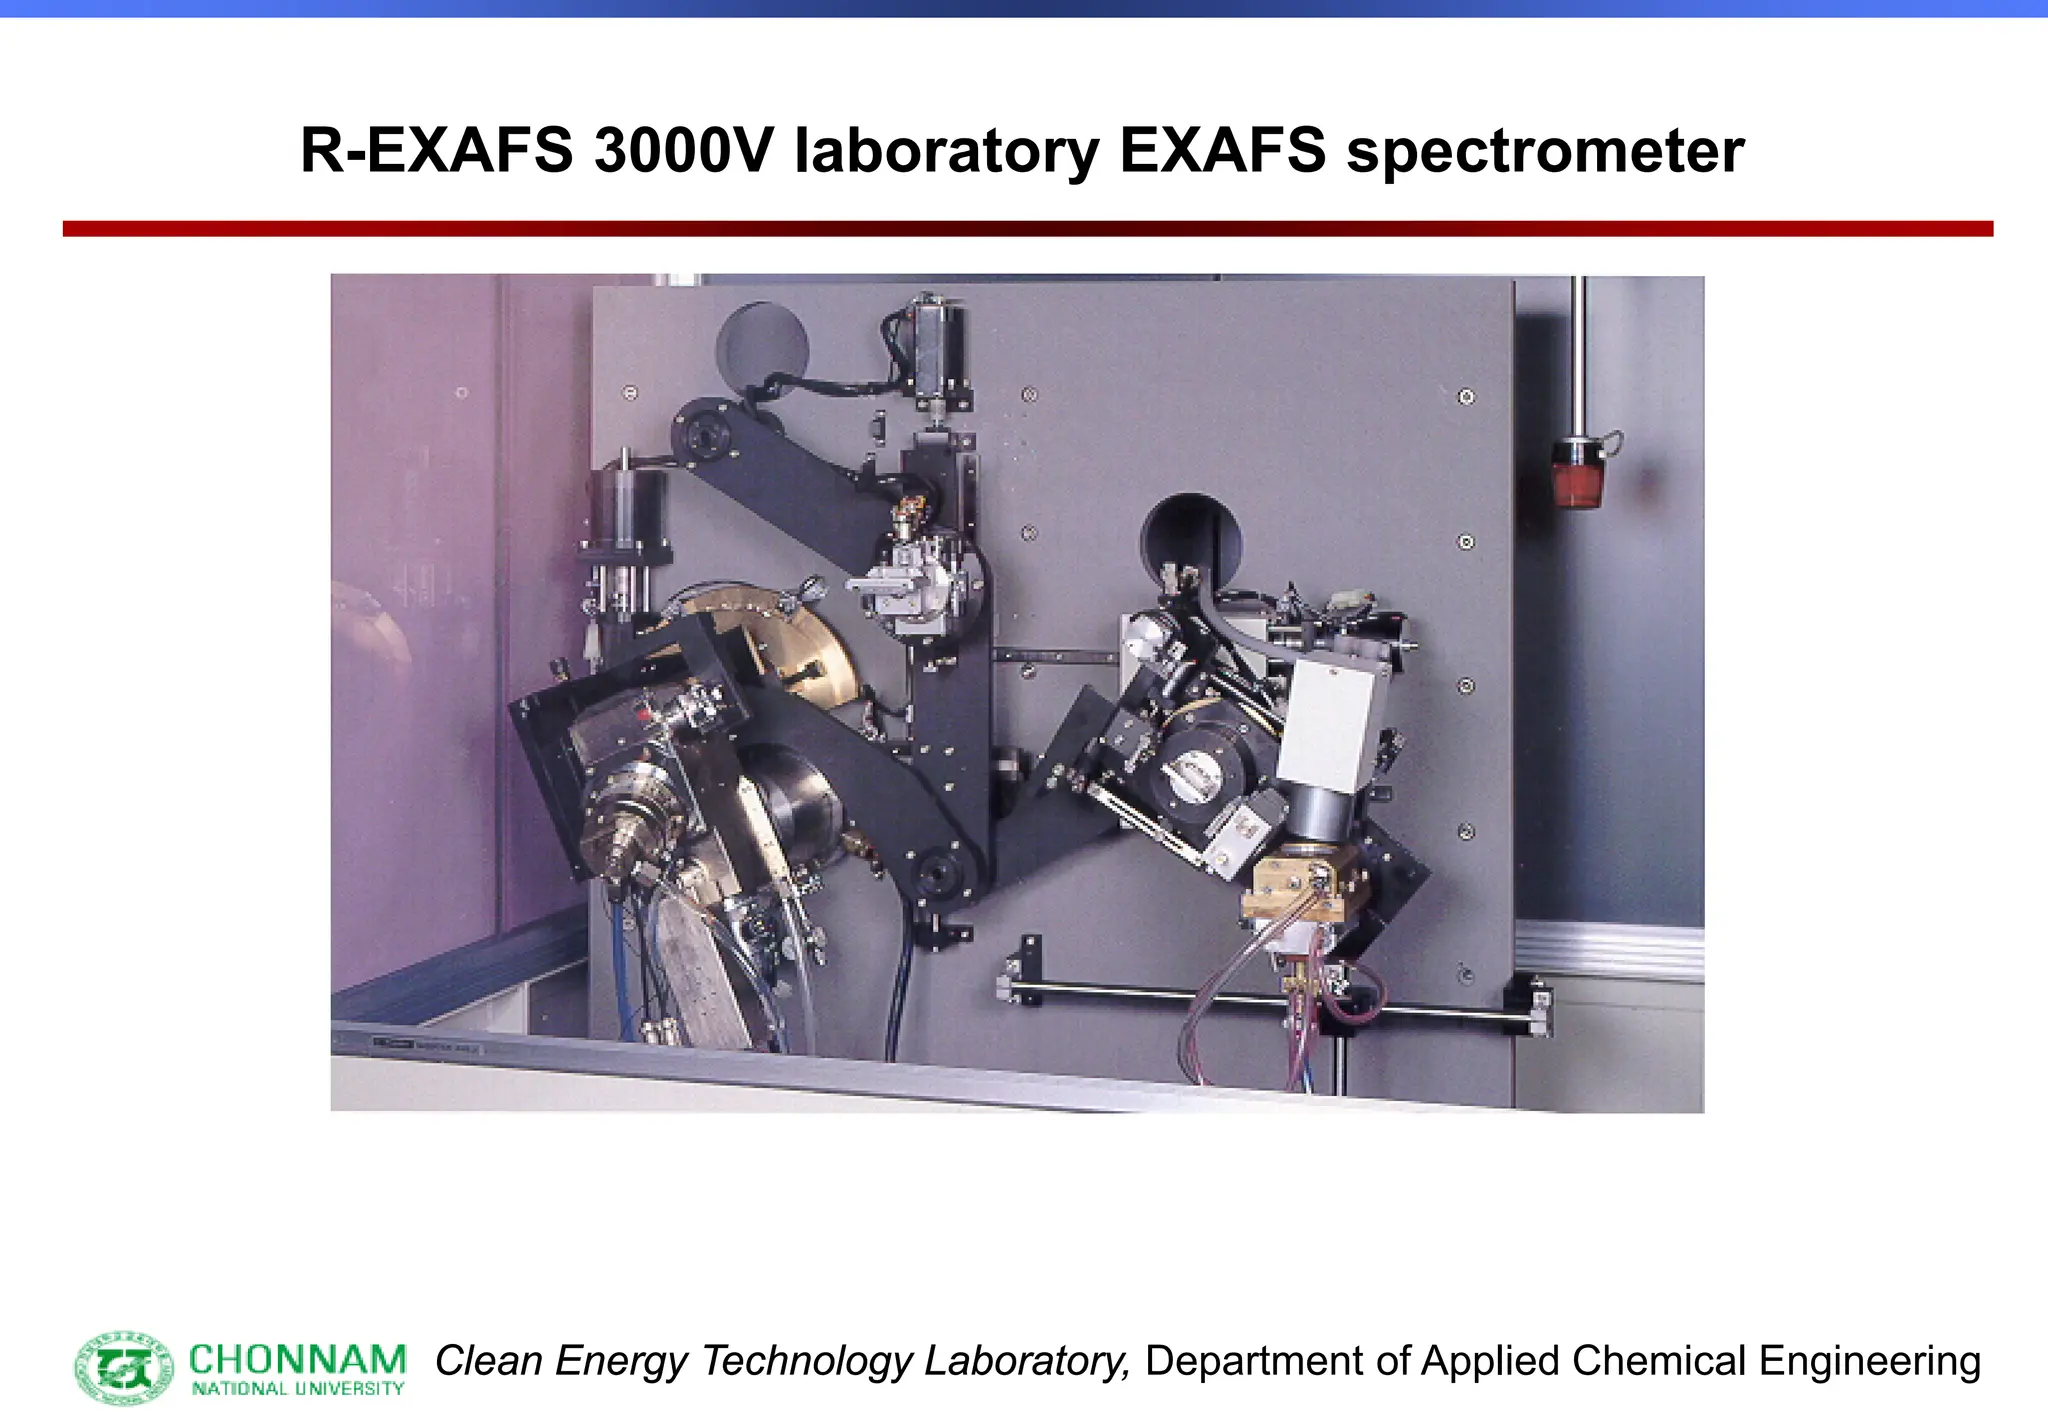
Why laboratory EXAFS spectrometer ?
[1] Ease of experiments
[2] Unlimited use of instrument
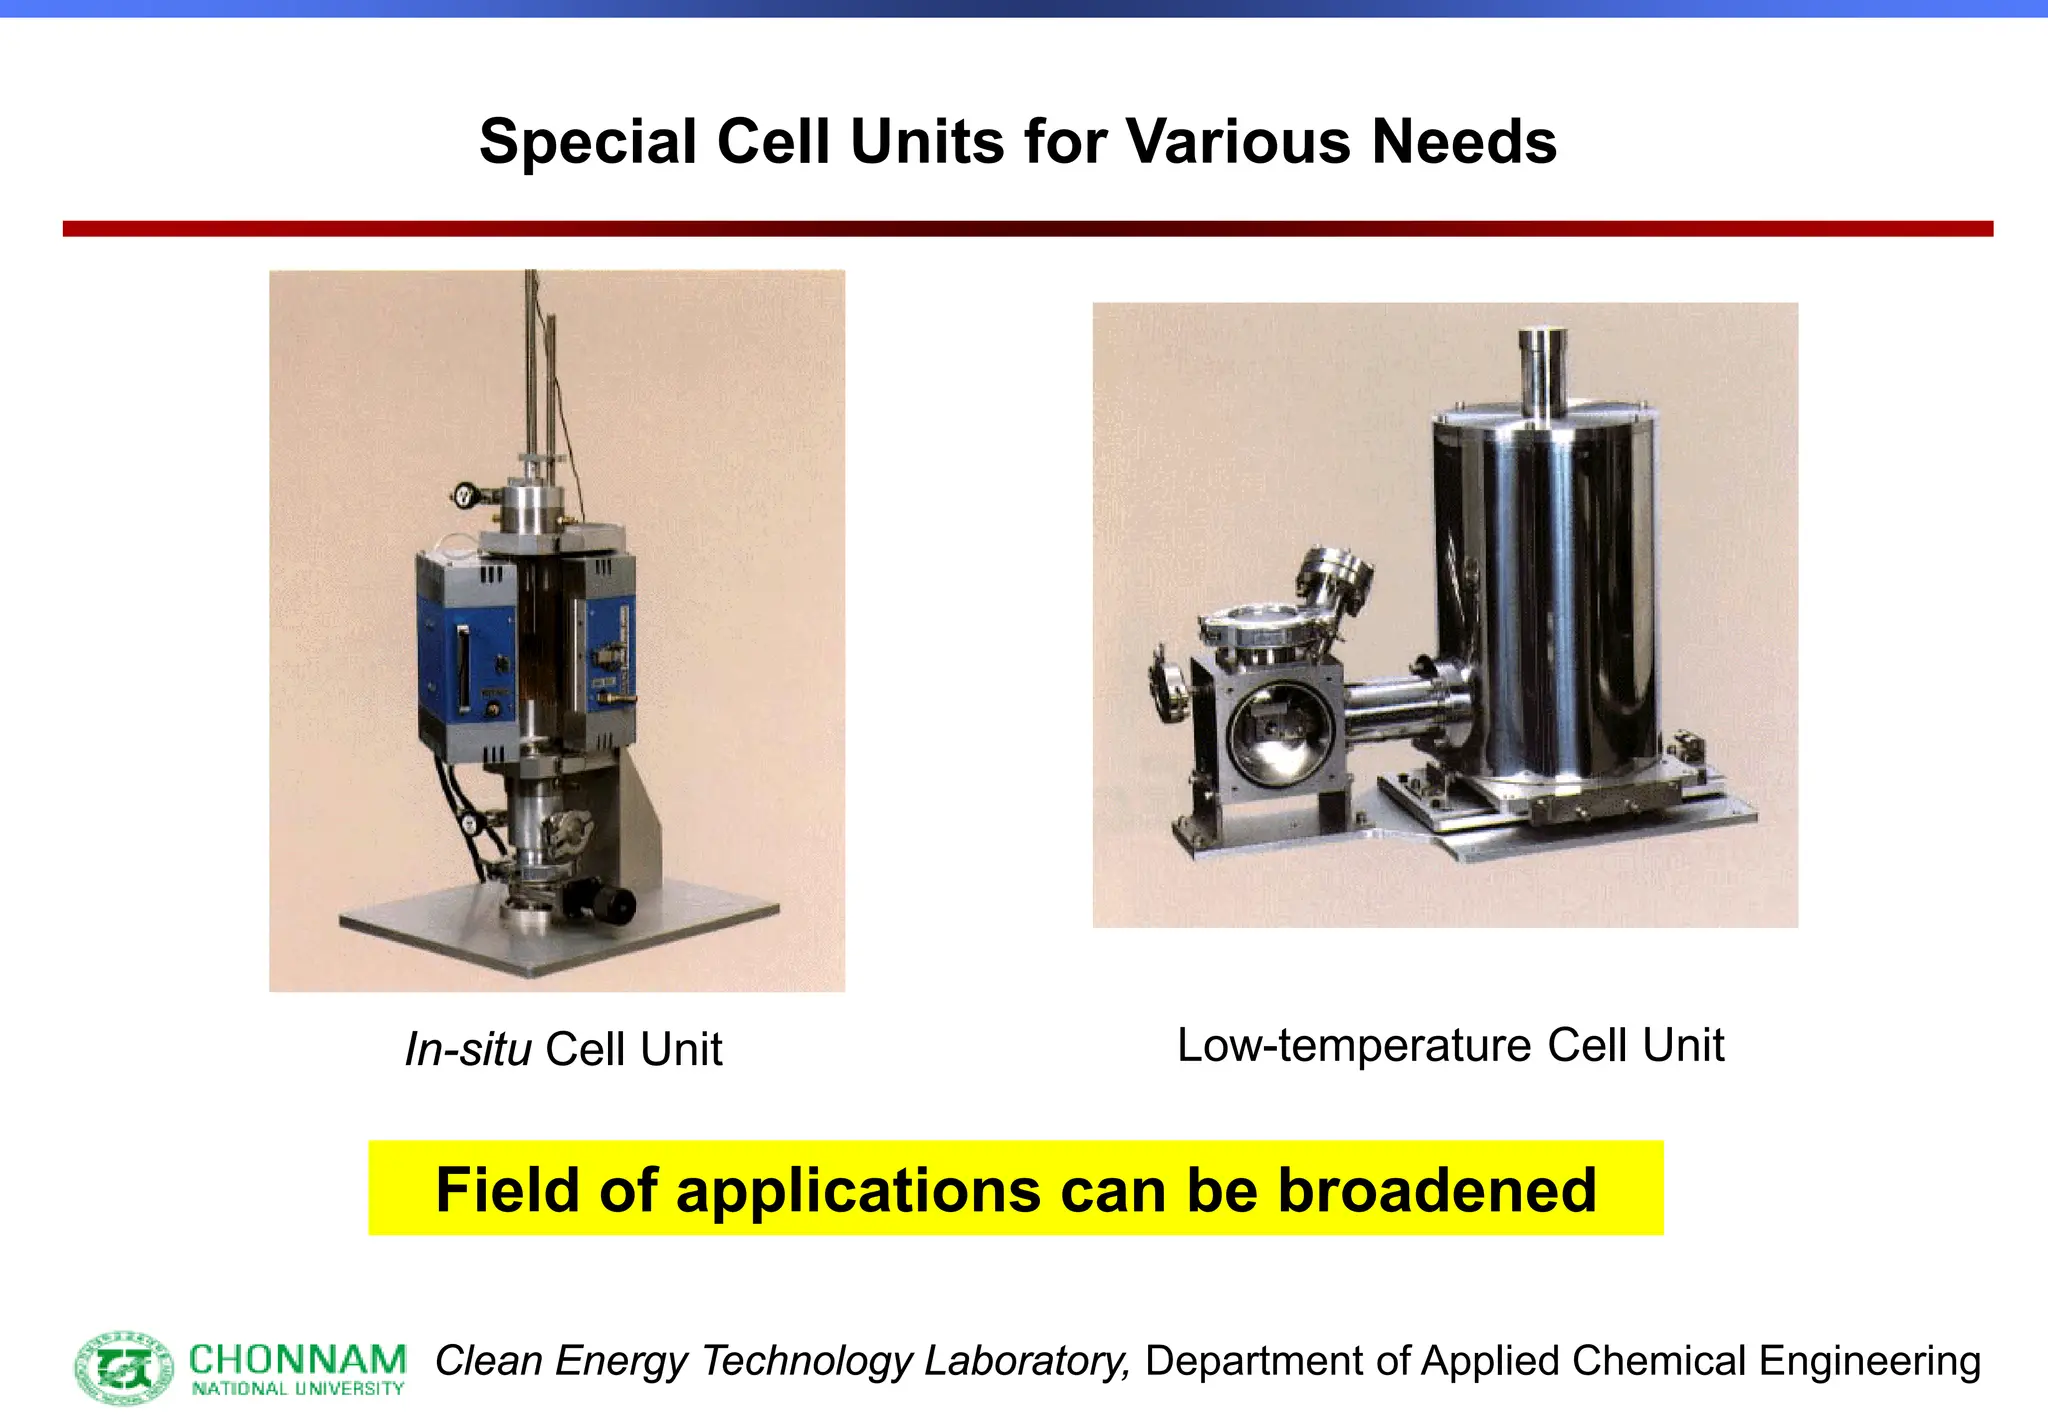
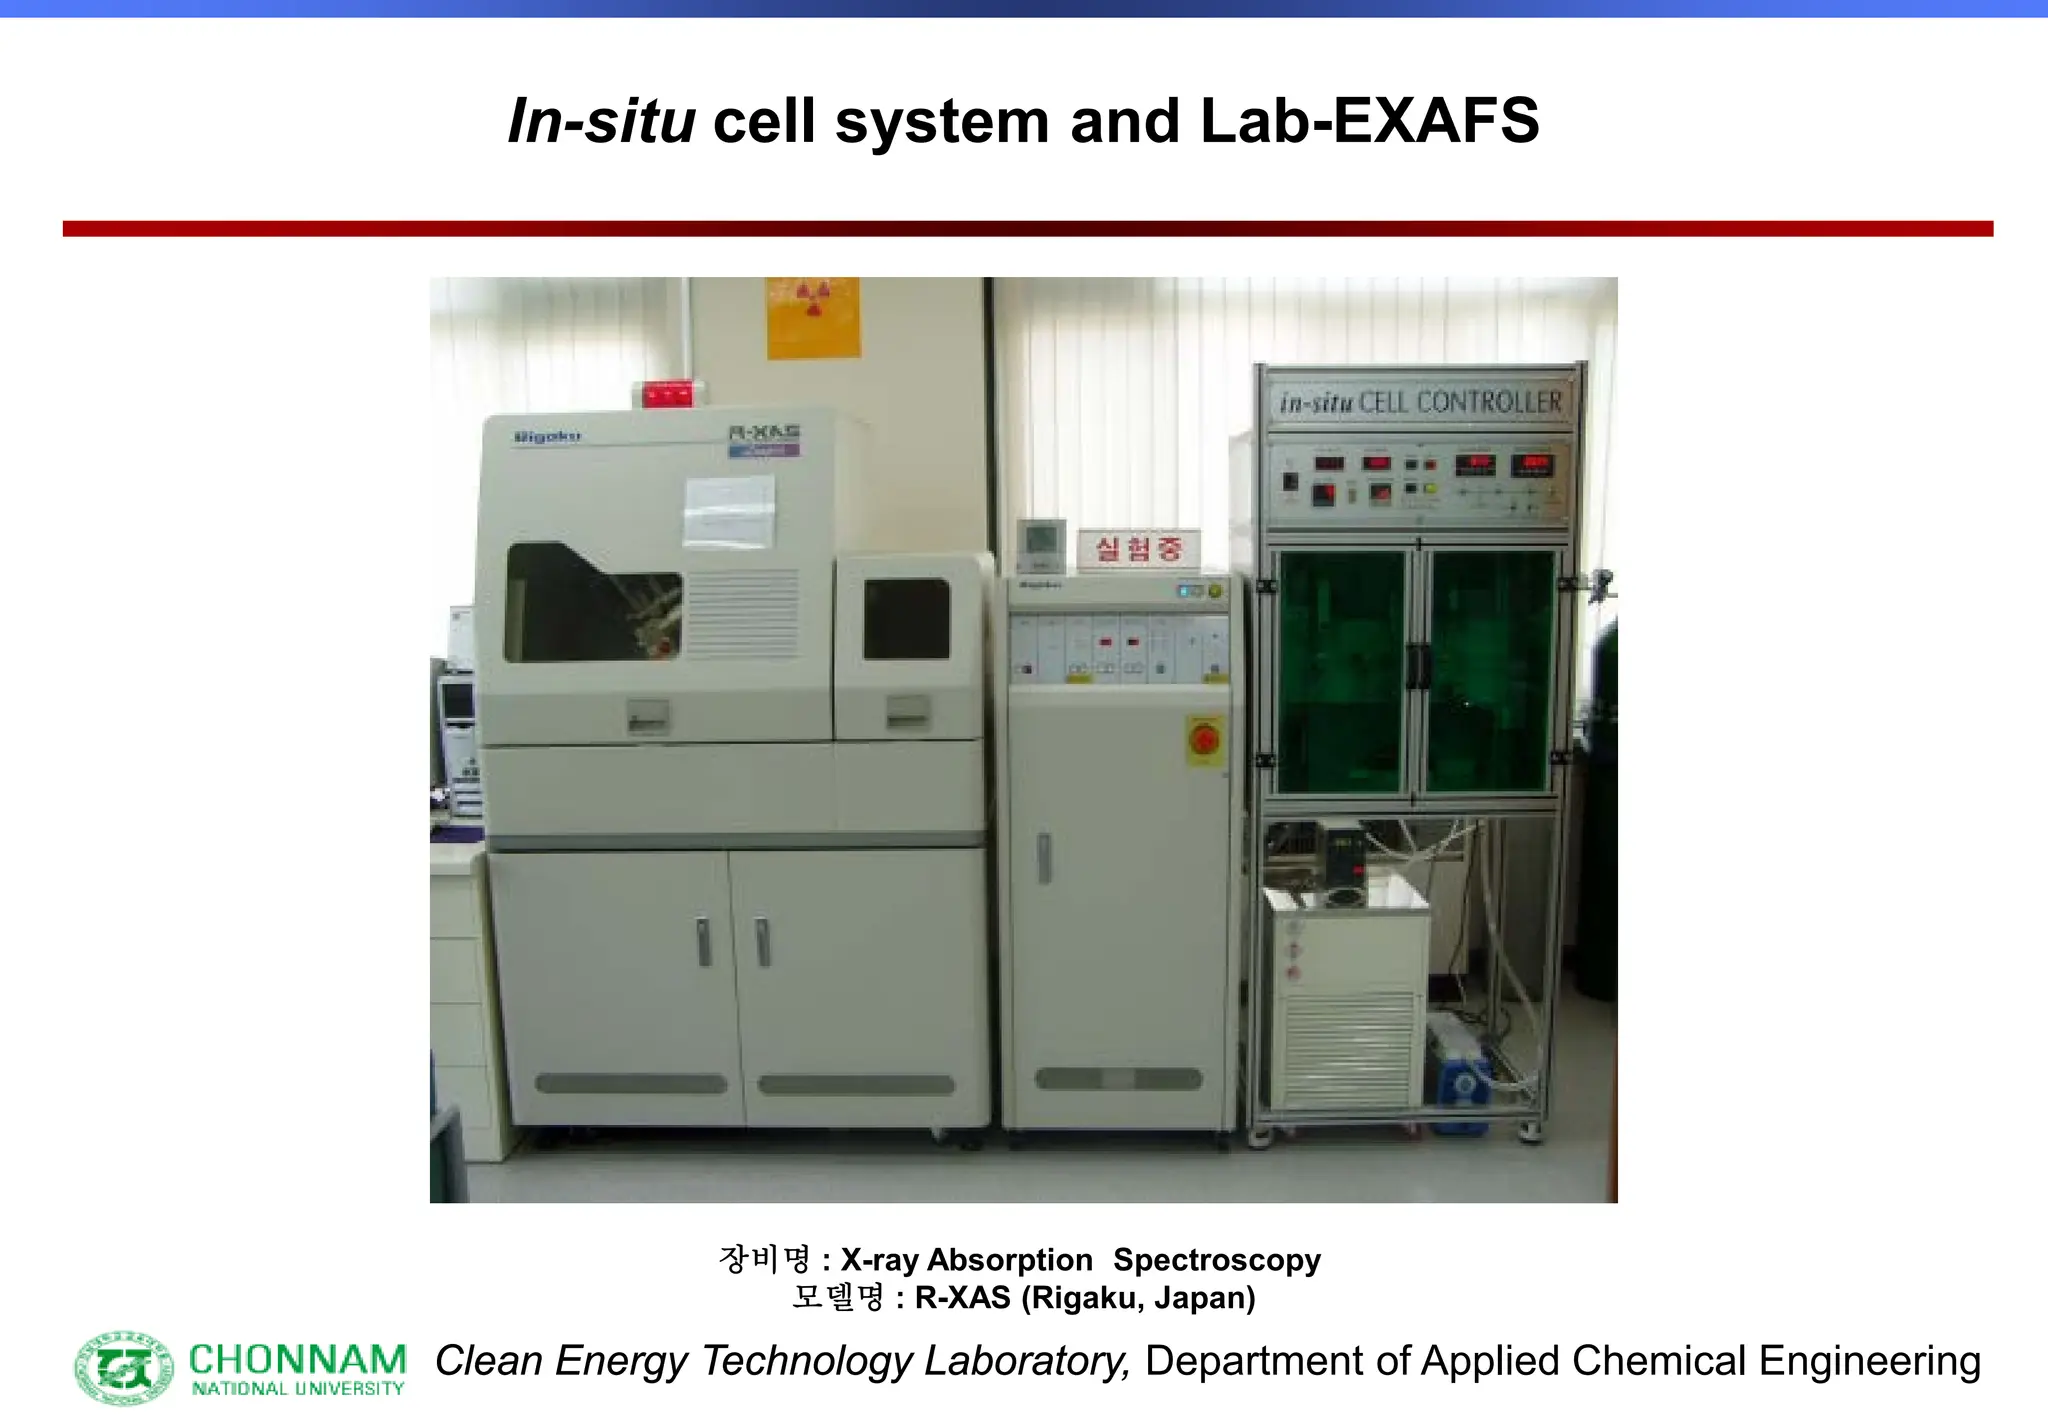
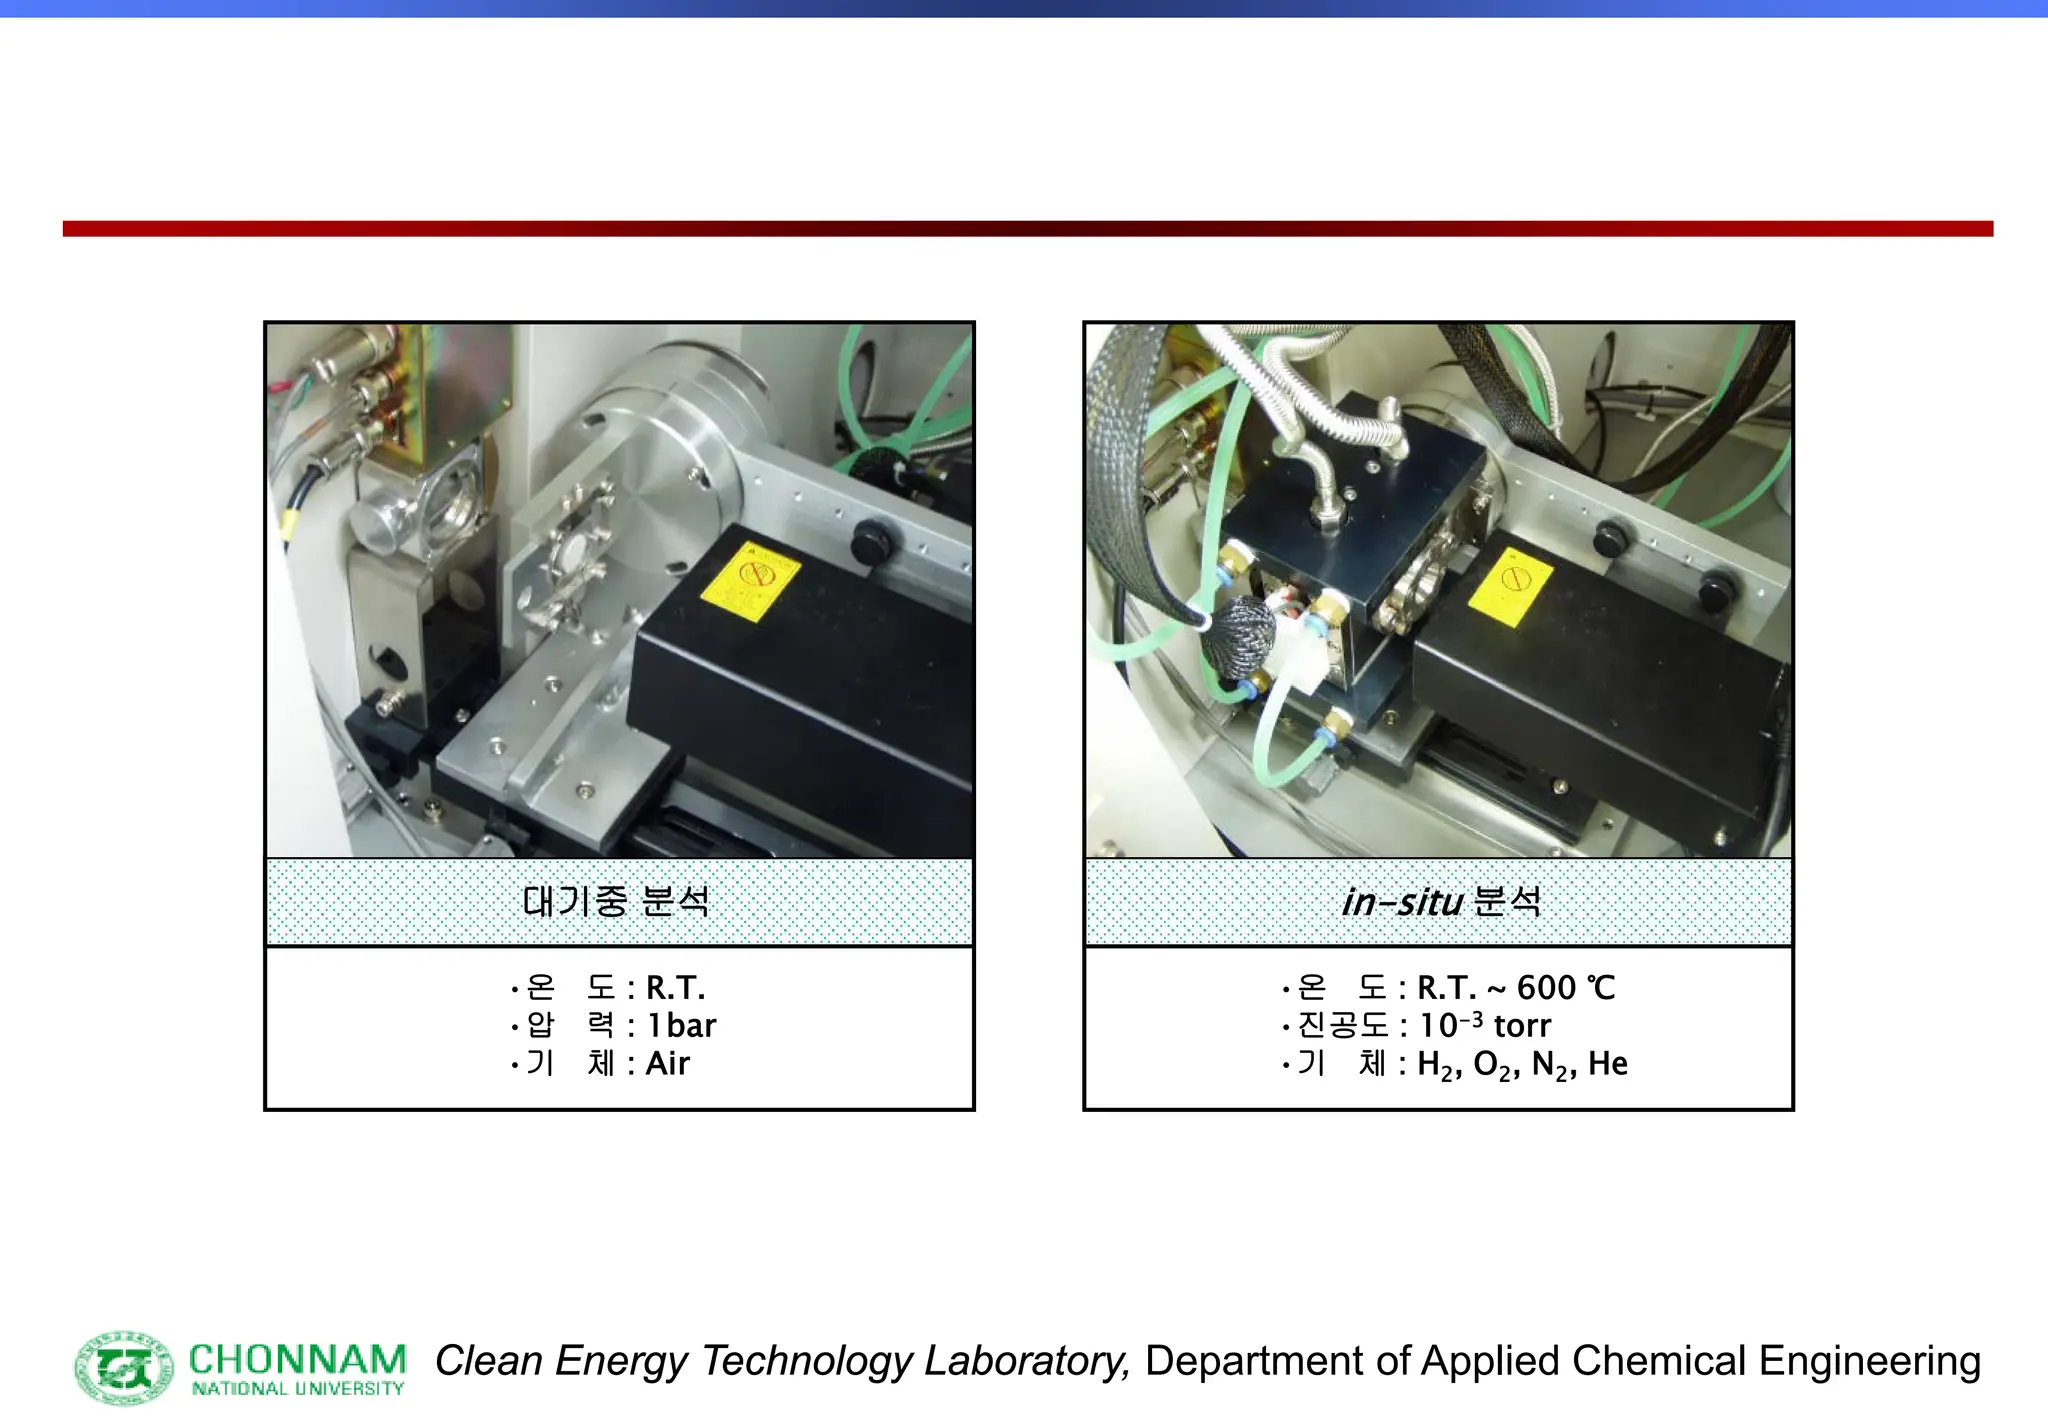
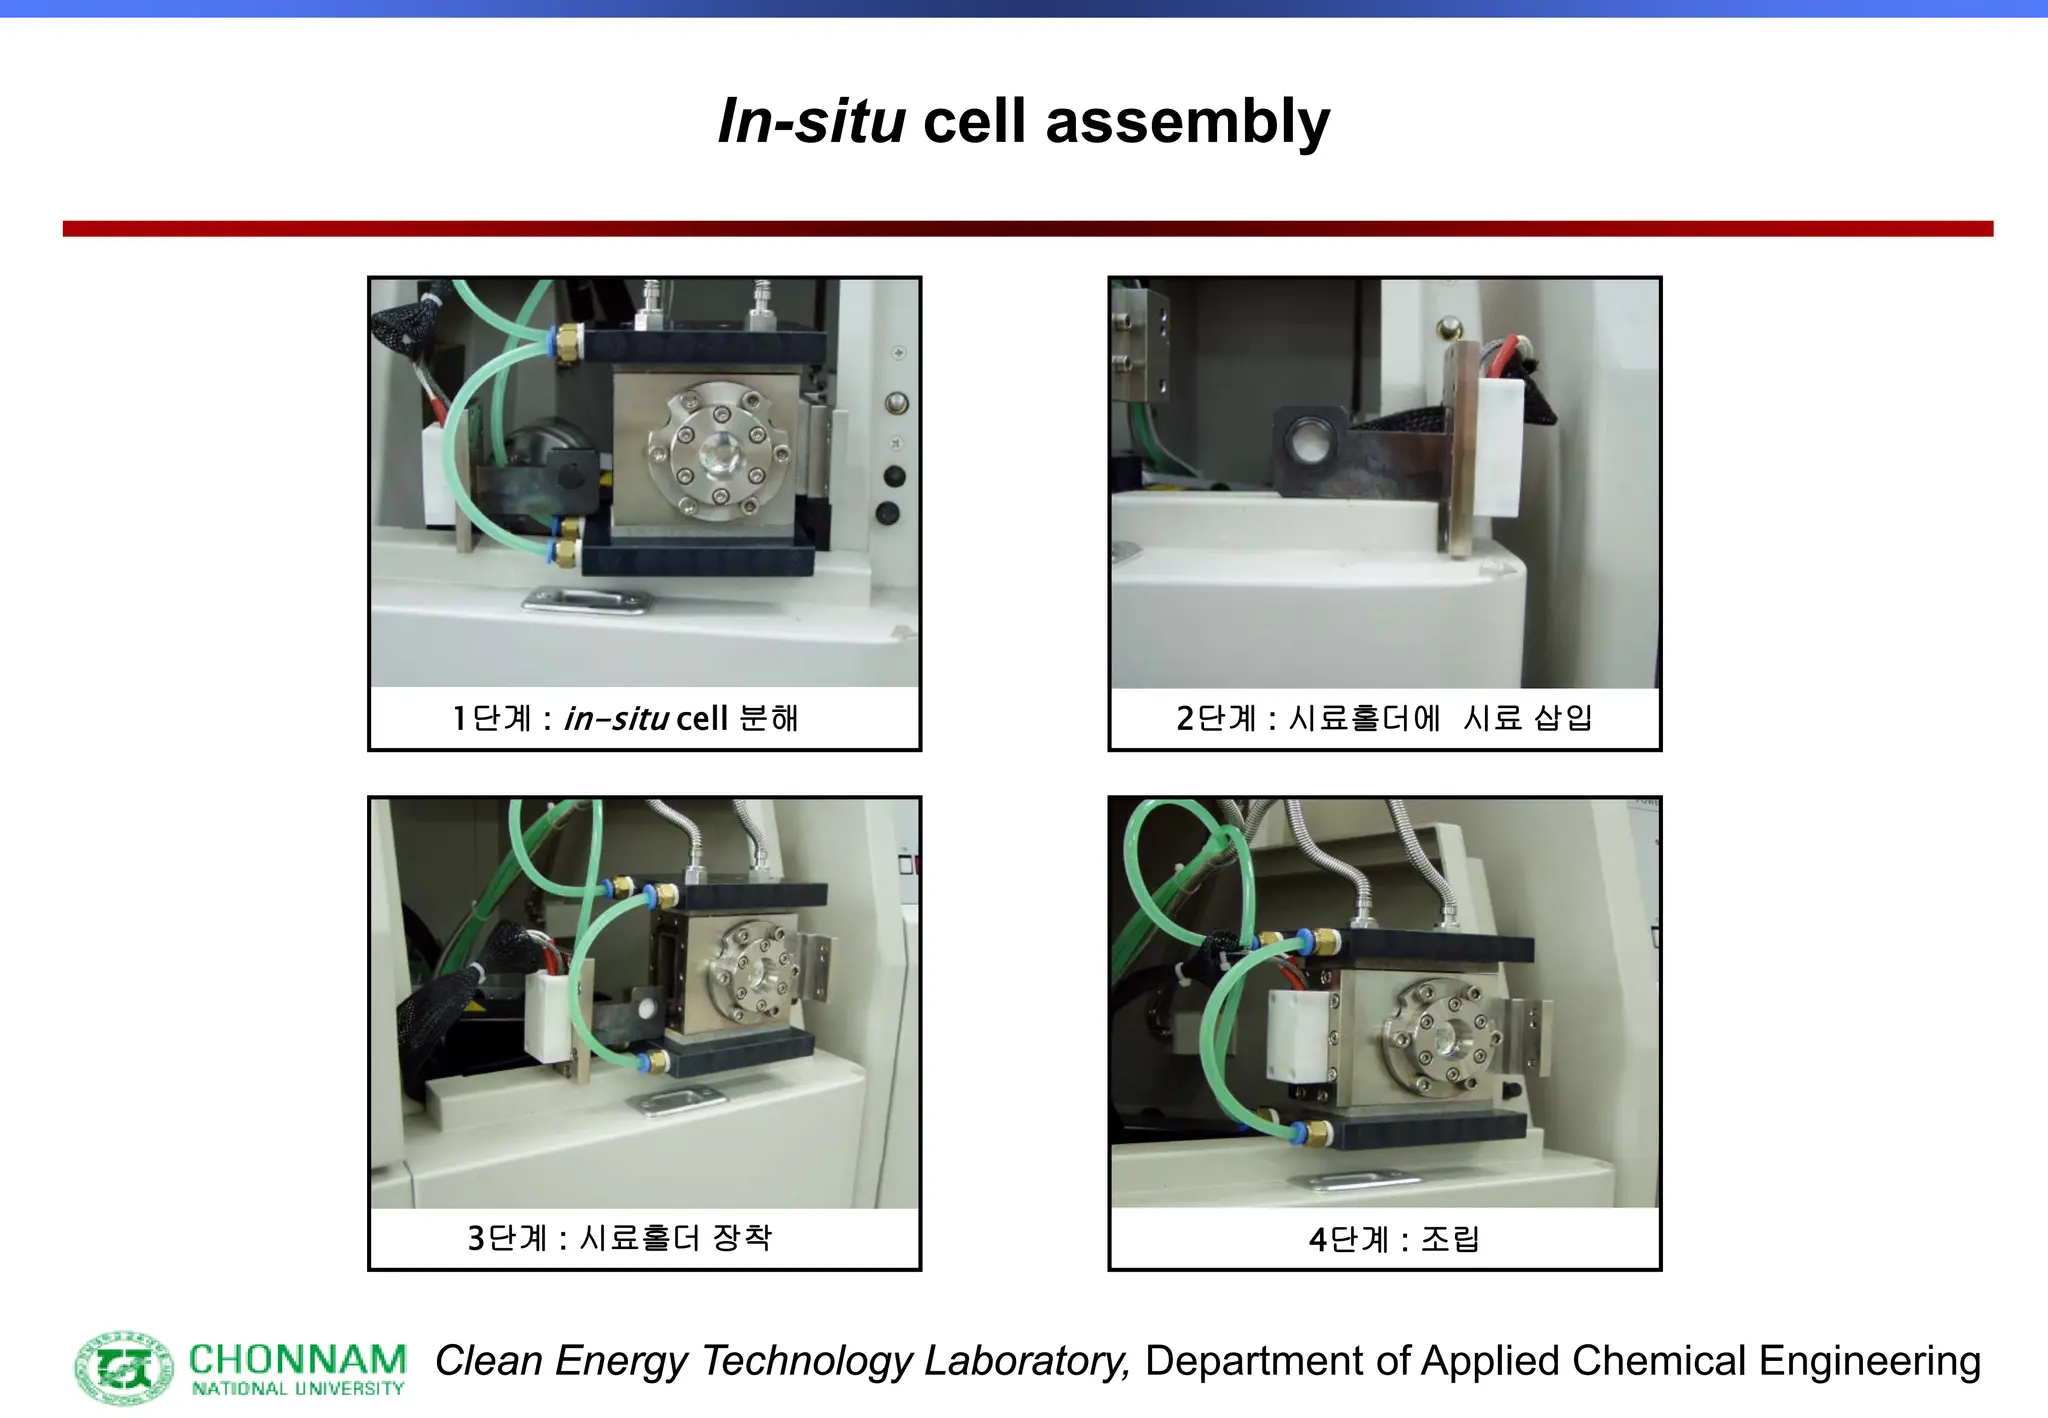
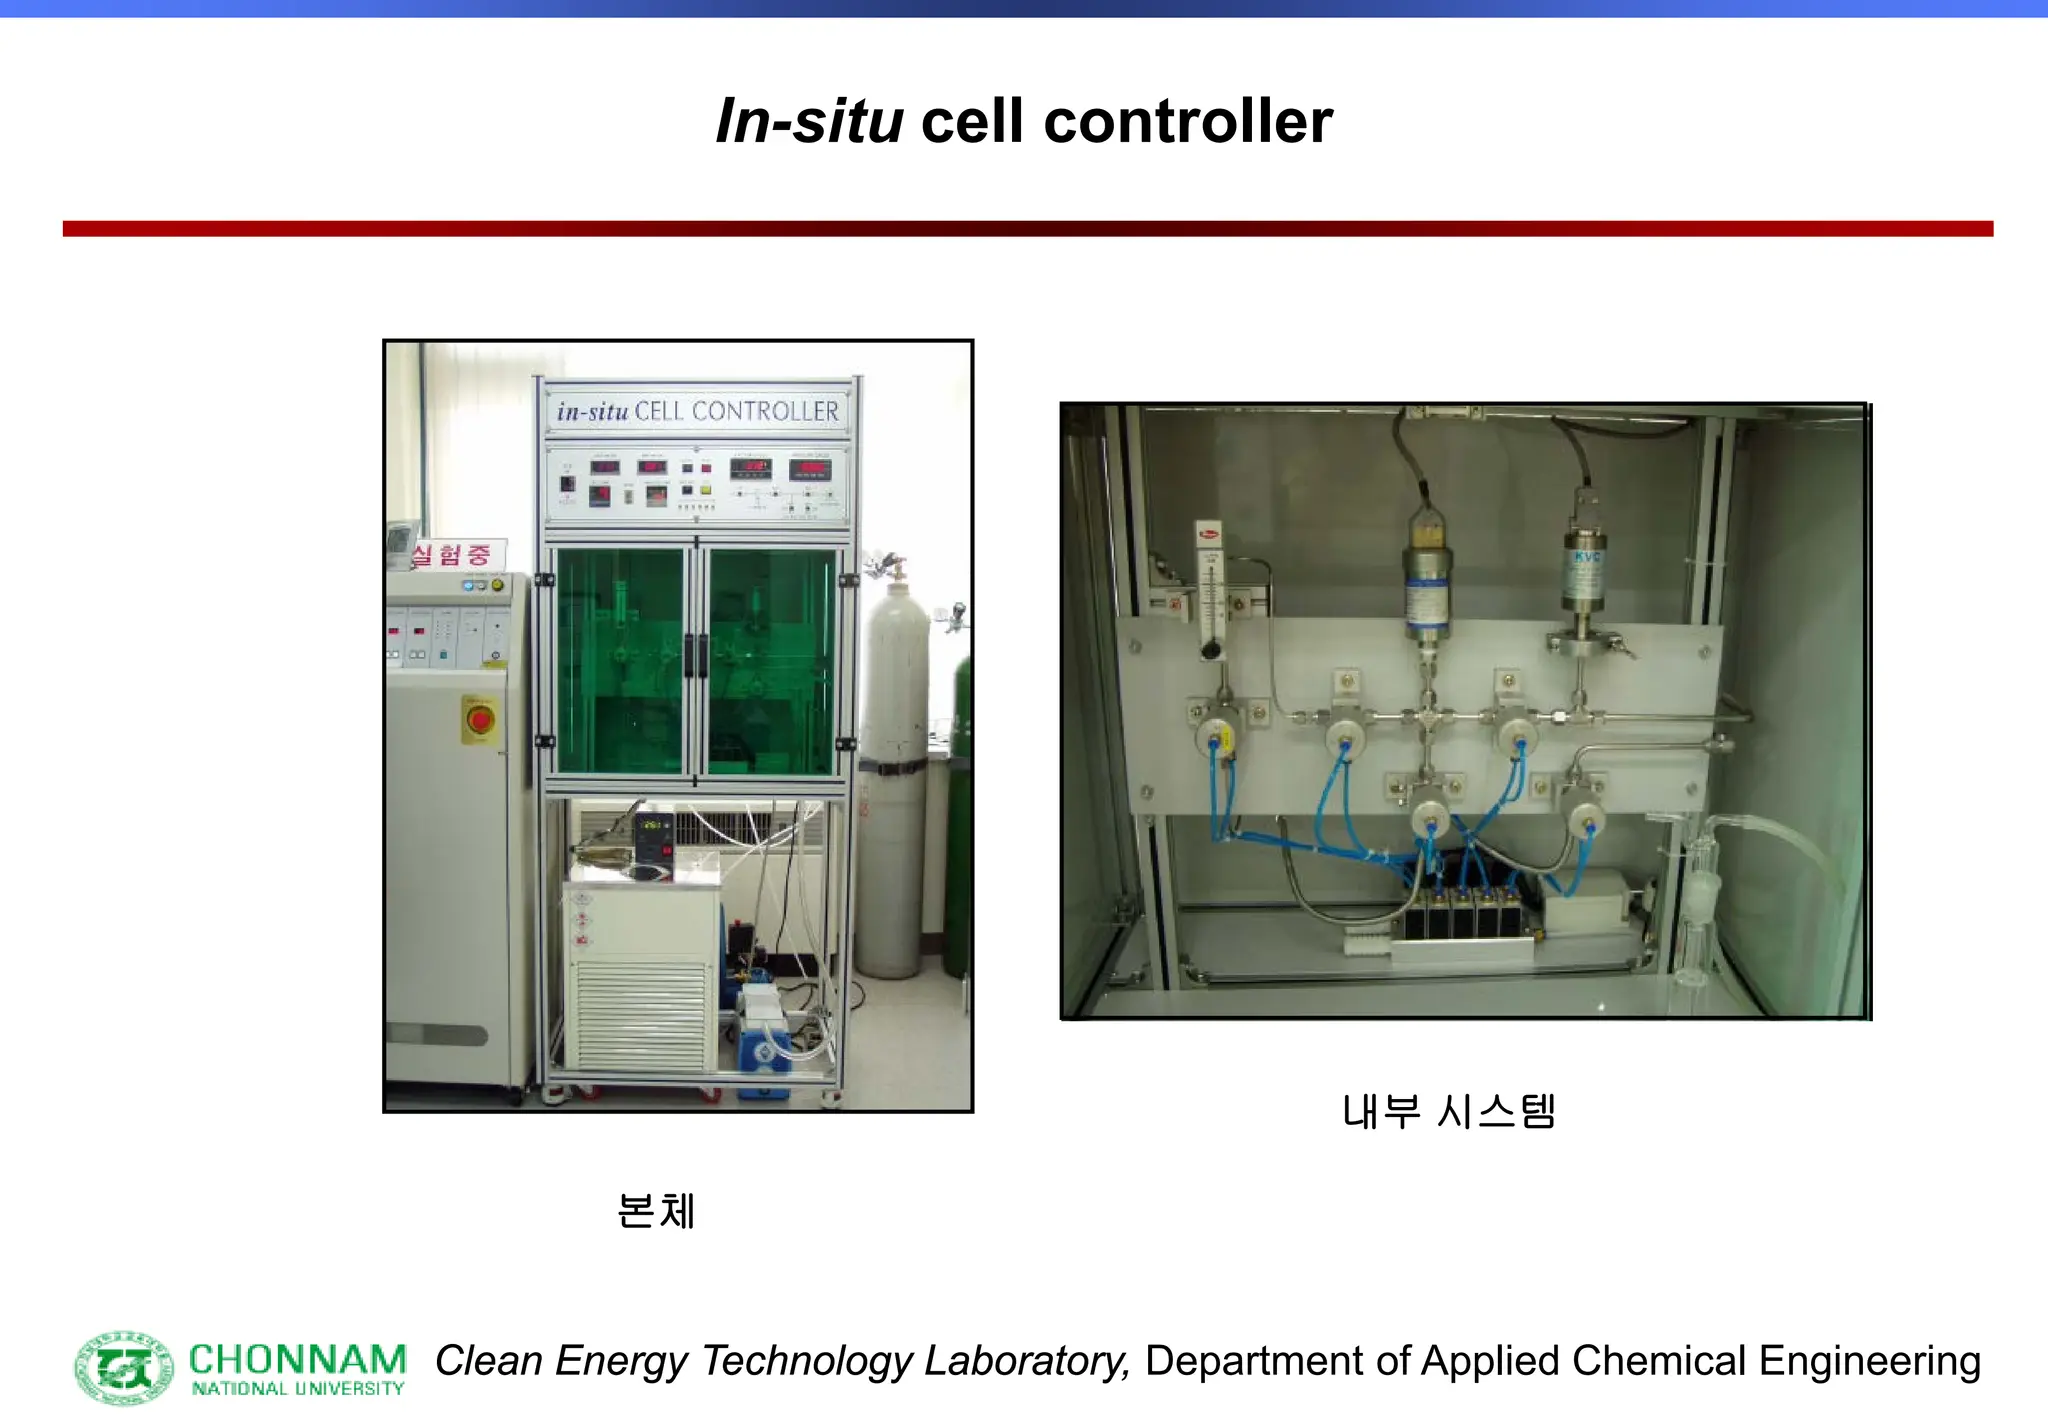
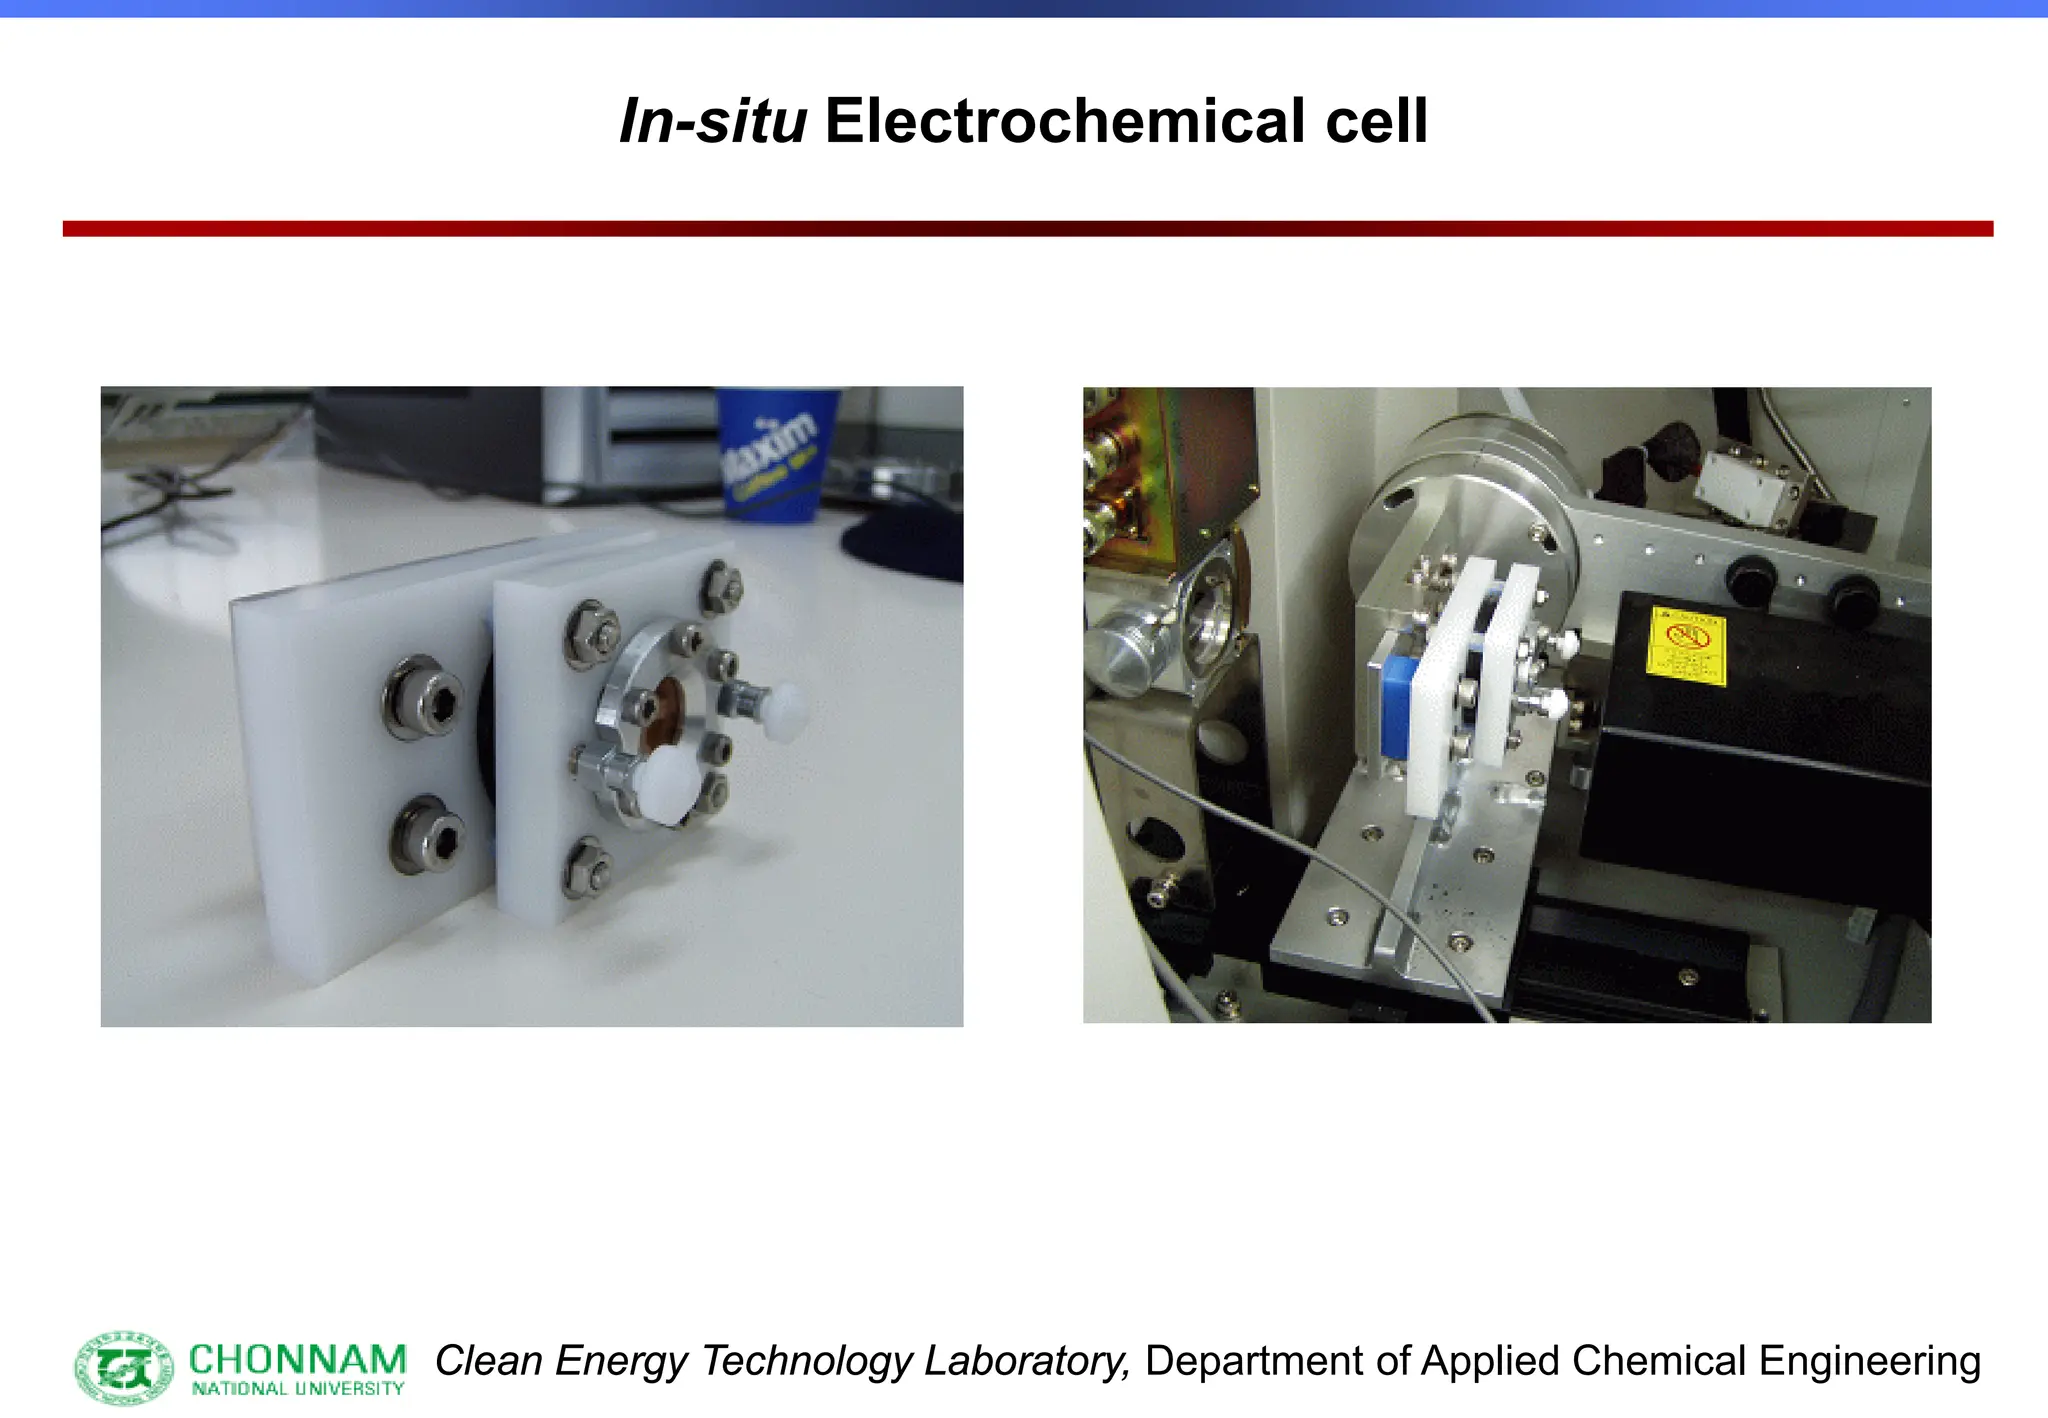
[3] Special samples, in-situ etc.
[1] Synchrotronlike resolution, 3 eV of much low
intensity, 106 cps vs. 109 cps from SR
[2] S/N ~ 1000: EXAFS oscillation is less than 10% of
background (accuracy better than 0.1%)](https://image.slidesharecdn.com/xafsinst-250421081425-55fe2fa6/75/EXAFS-for-Structural-Characterization-Extended-X-ray-Absorption-Fine-Structure-9-2048.jpg)
![Clean Energy Technology Laboratory, Department of Applied Chemical Engineering
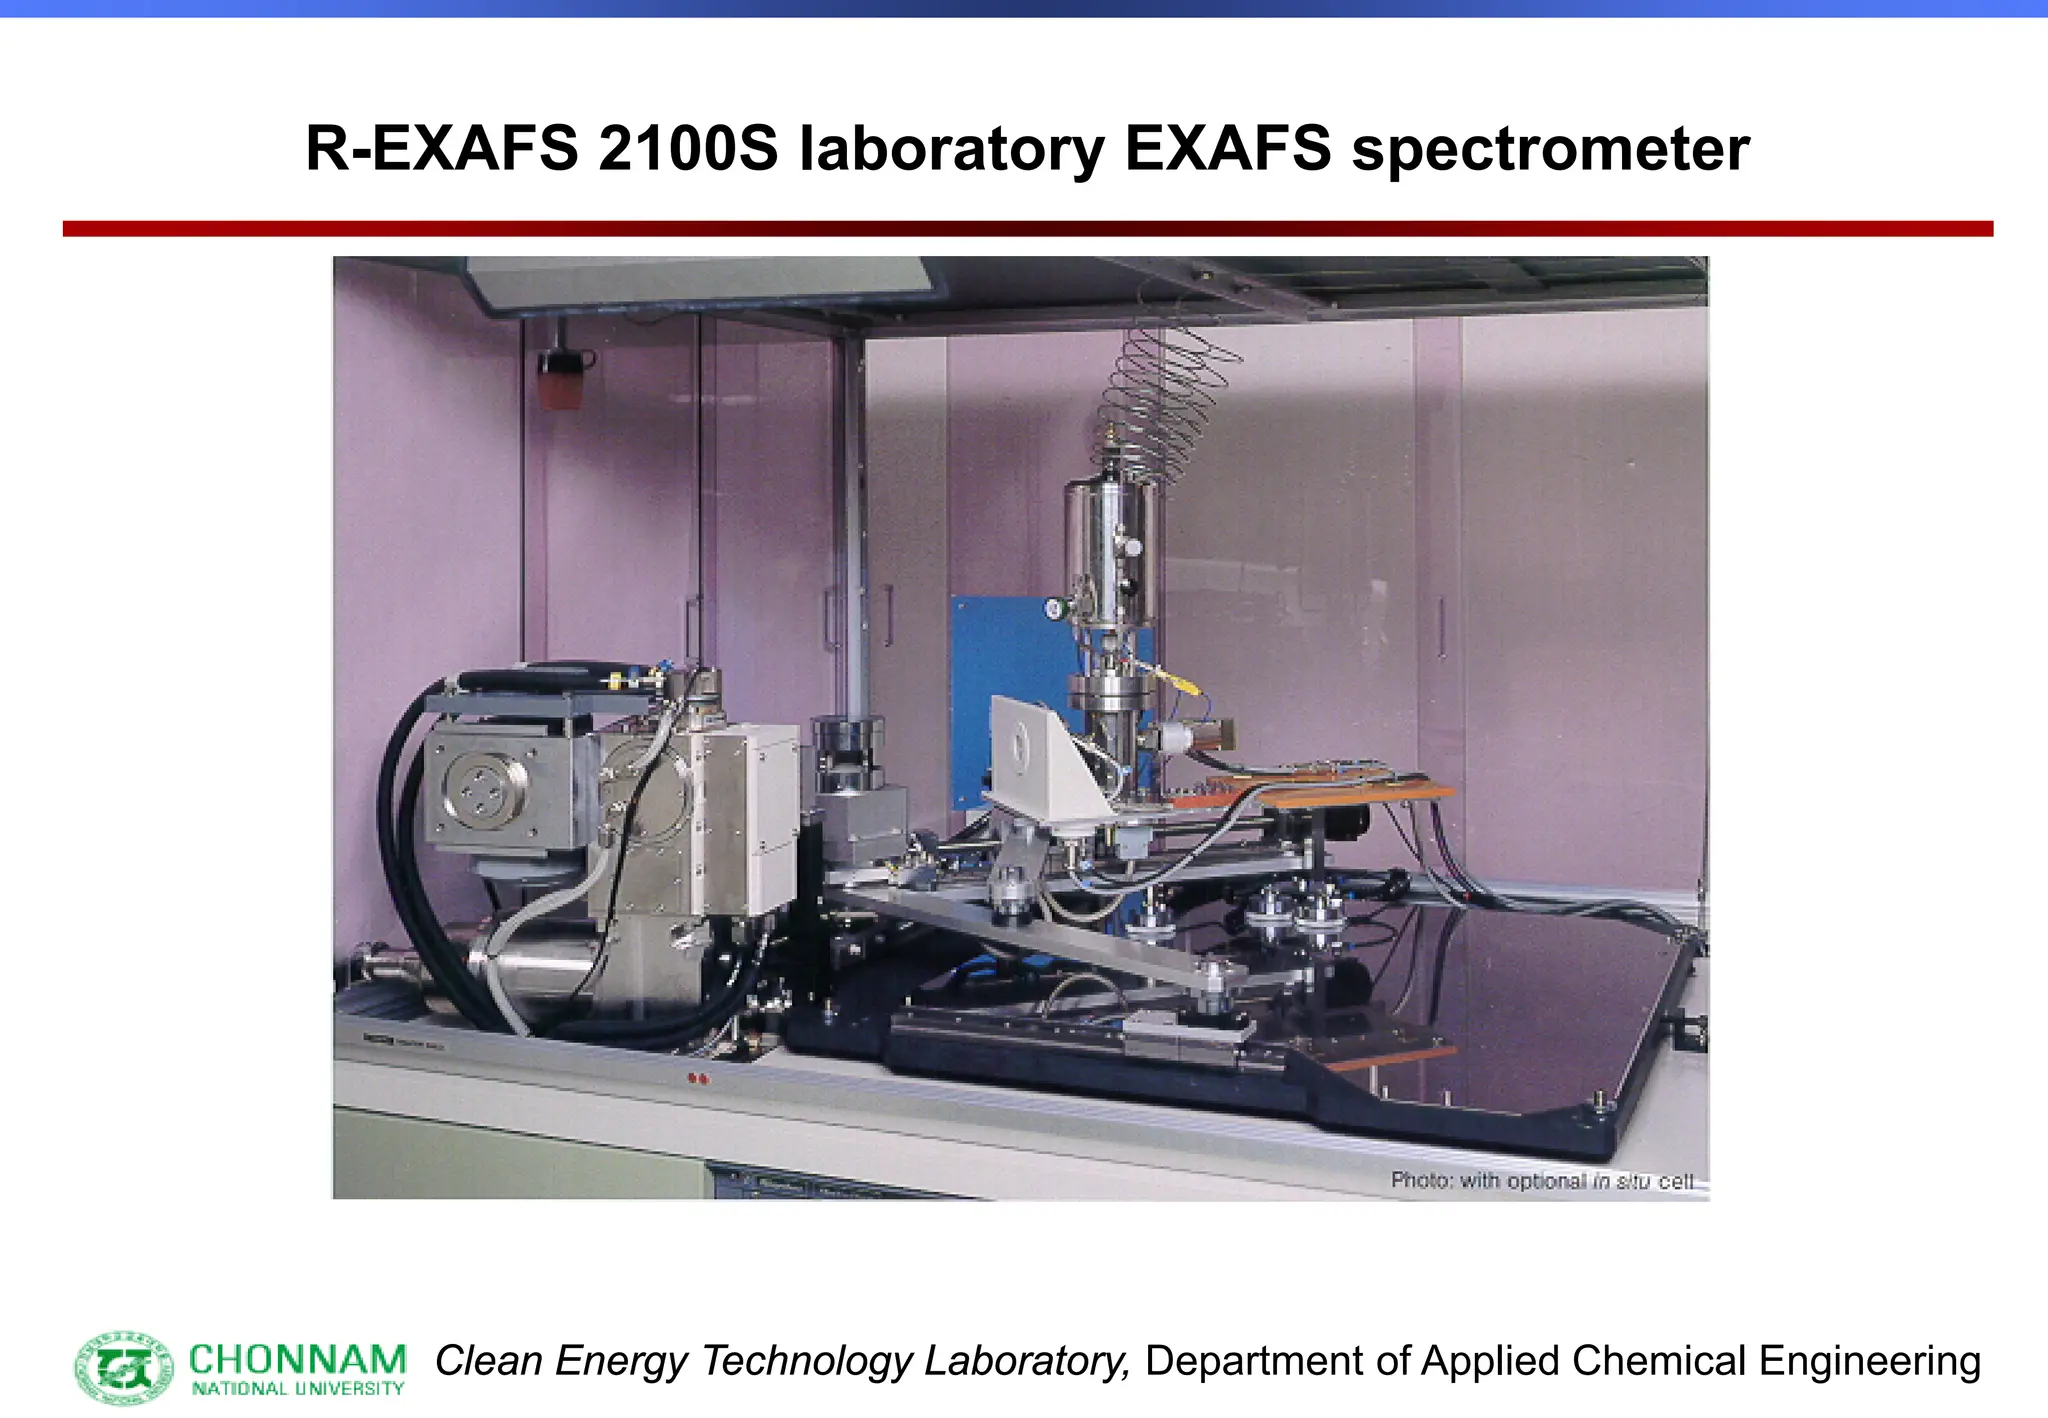
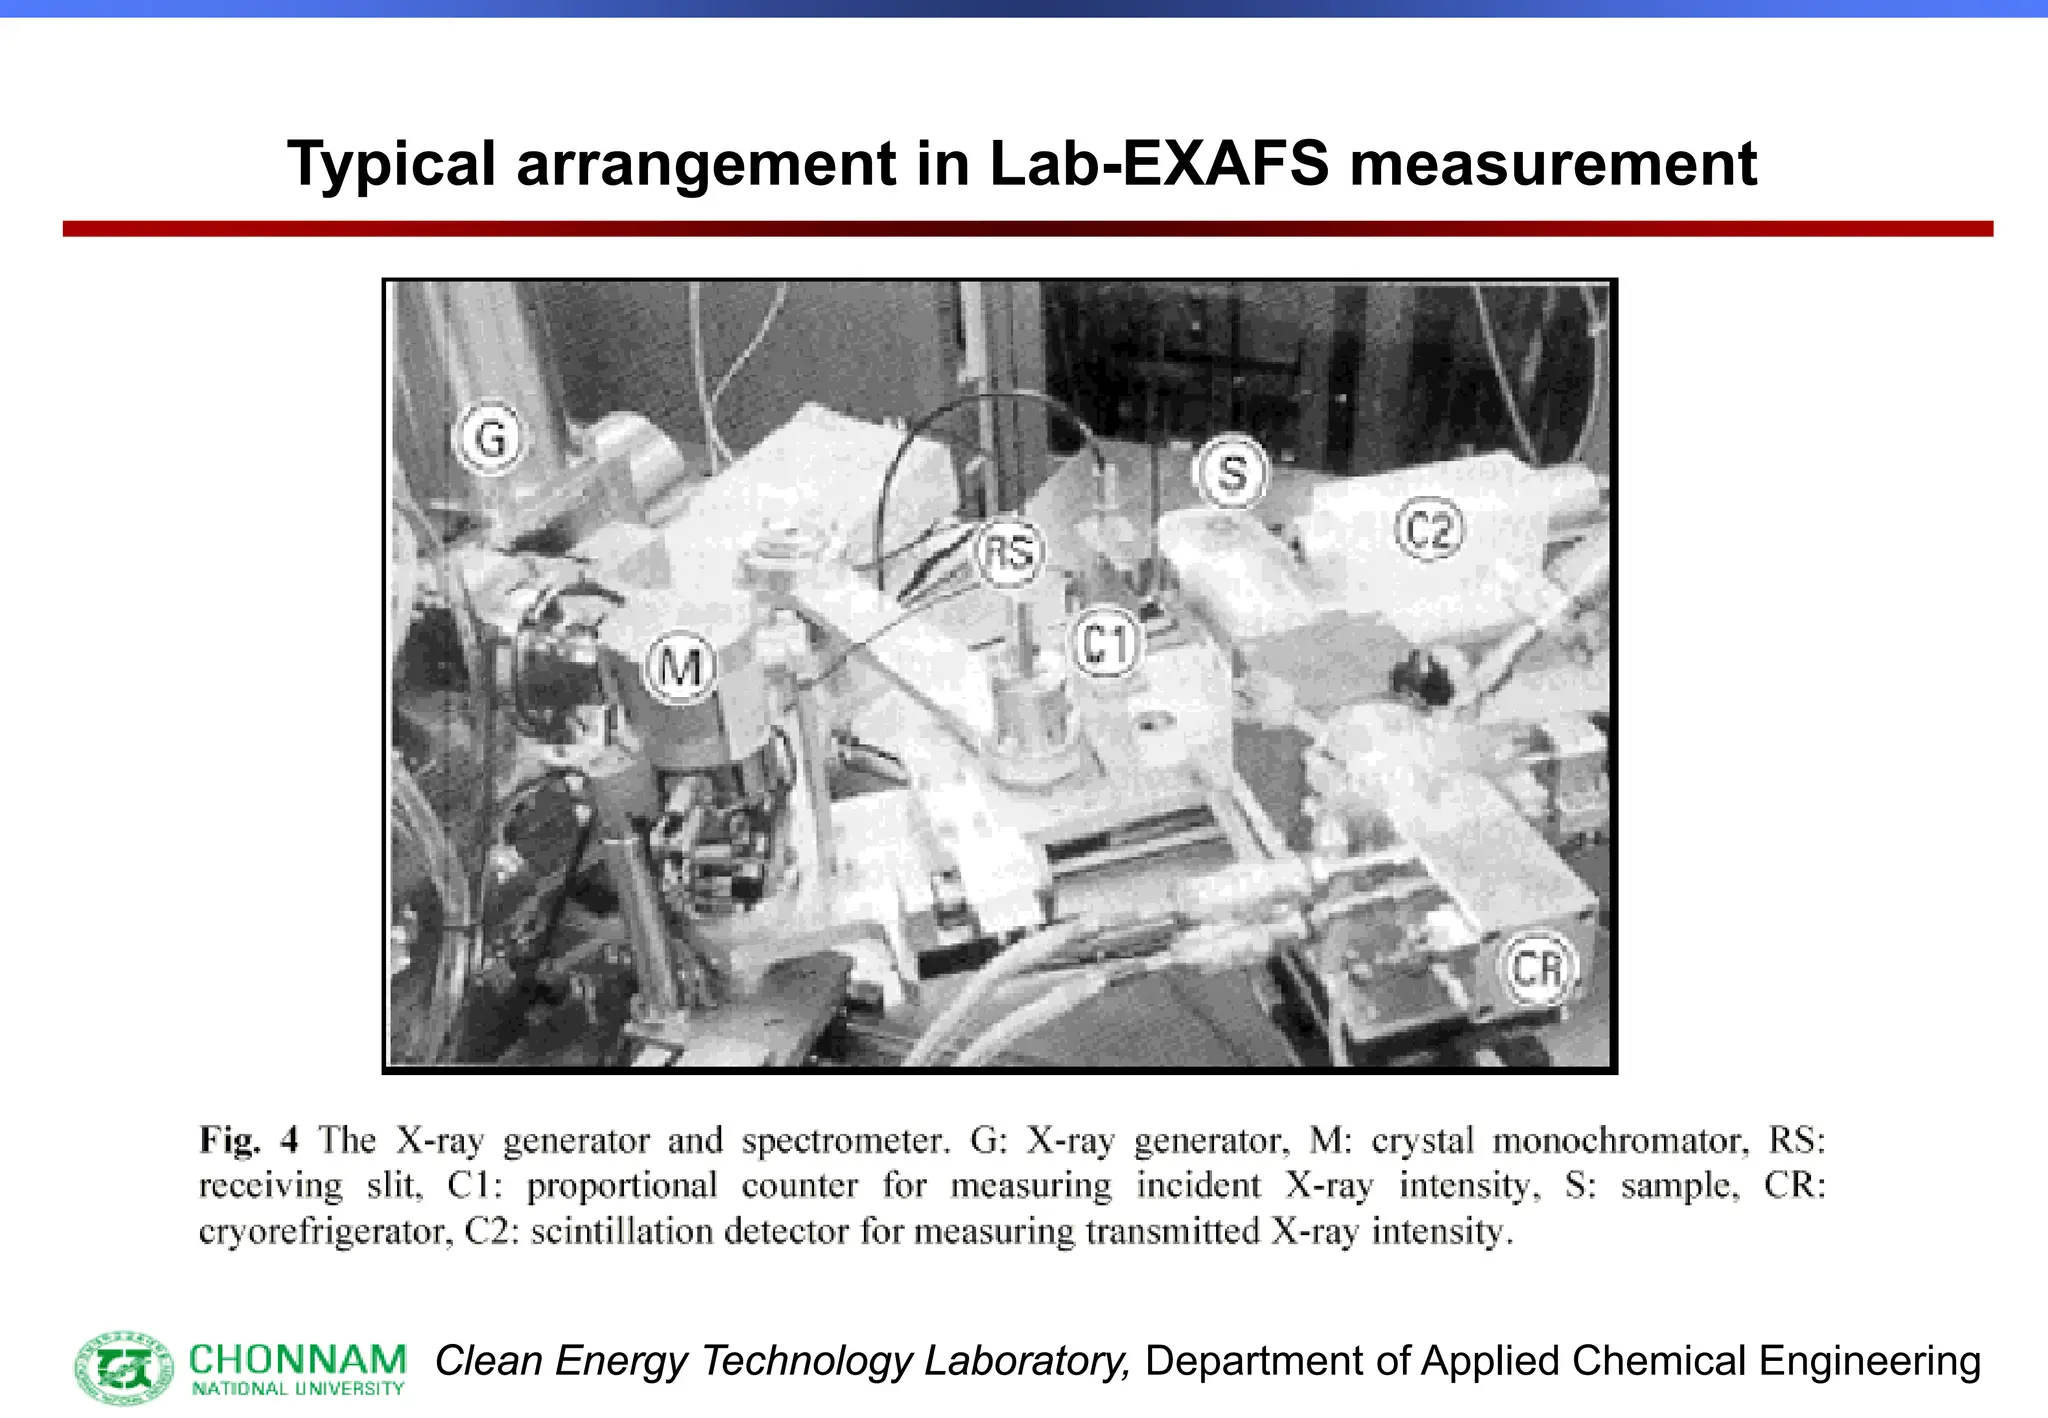
Main problems in EXAFS measurement
[1] low intensity of X-ray flux
[2] degradation of the spectrum by 2nd and 3rd harmonics
[3] effect of non-smooth spectra distribution
[1] an extremely high tube current, e.g. 1,000 mA
(100 mA)
[2] narrow line focus, e.g. 0.1 mm at 6 deg take off
[3] low tube voltage operation, 10 ~ 30 kV (~ 40 kV)
[4] LaB6 or other-tungsten filament](https://image.slidesharecdn.com/xafsinst-250421081425-55fe2fa6/75/EXAFS-for-Structural-Characterization-Extended-X-ray-Absorption-Fine-Structure-11-2048.jpg)
![Clean Energy Technology Laboratory, Department of Applied Chemical Engineering
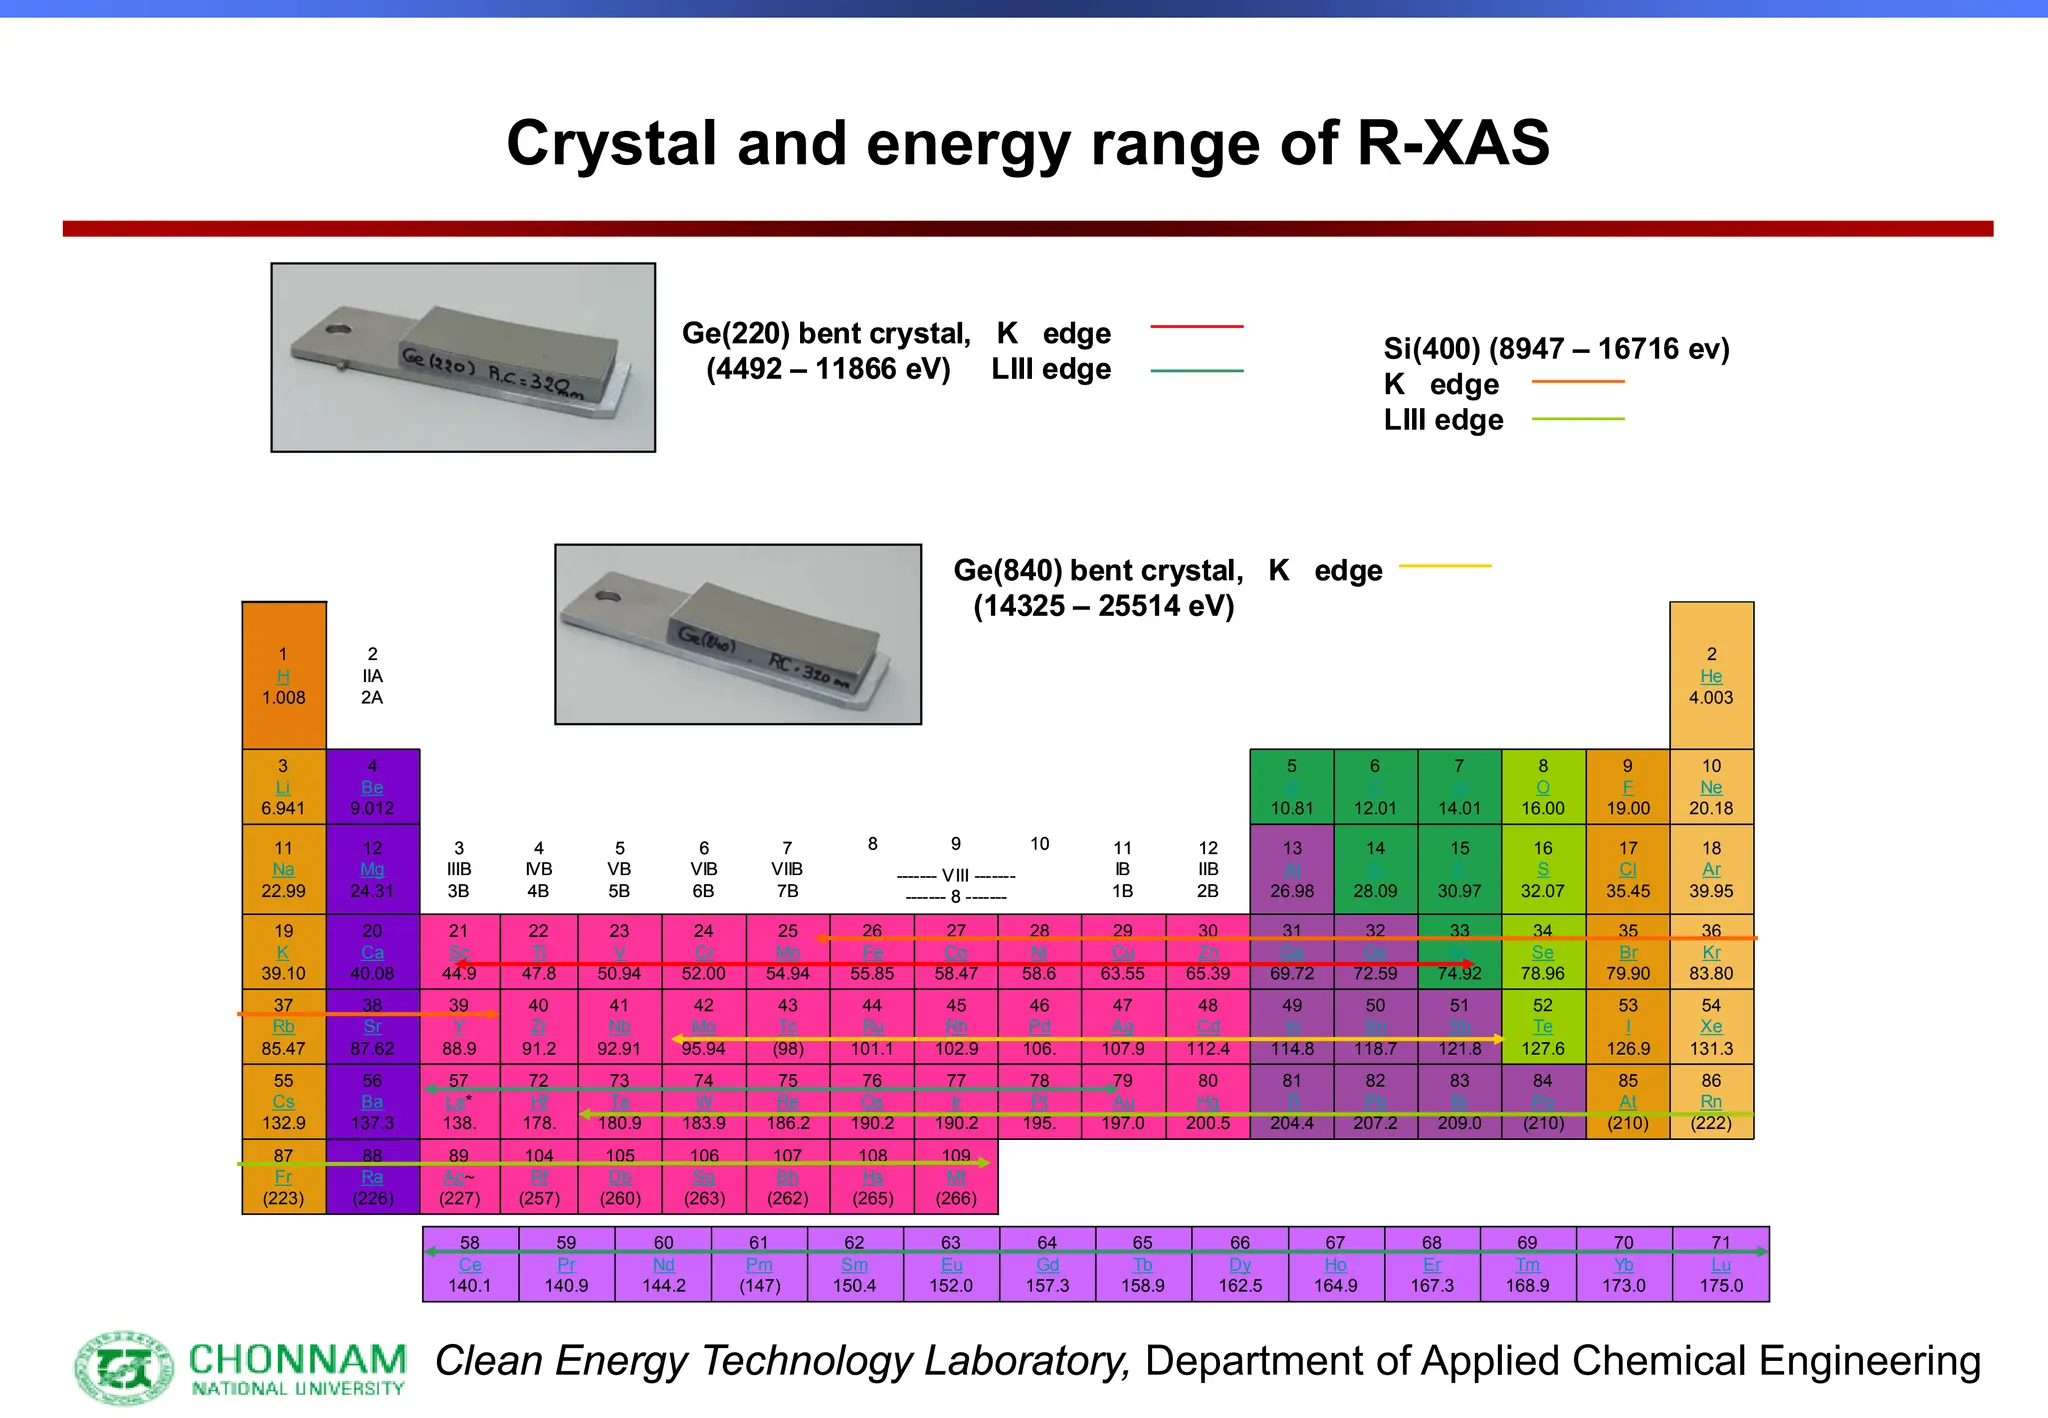
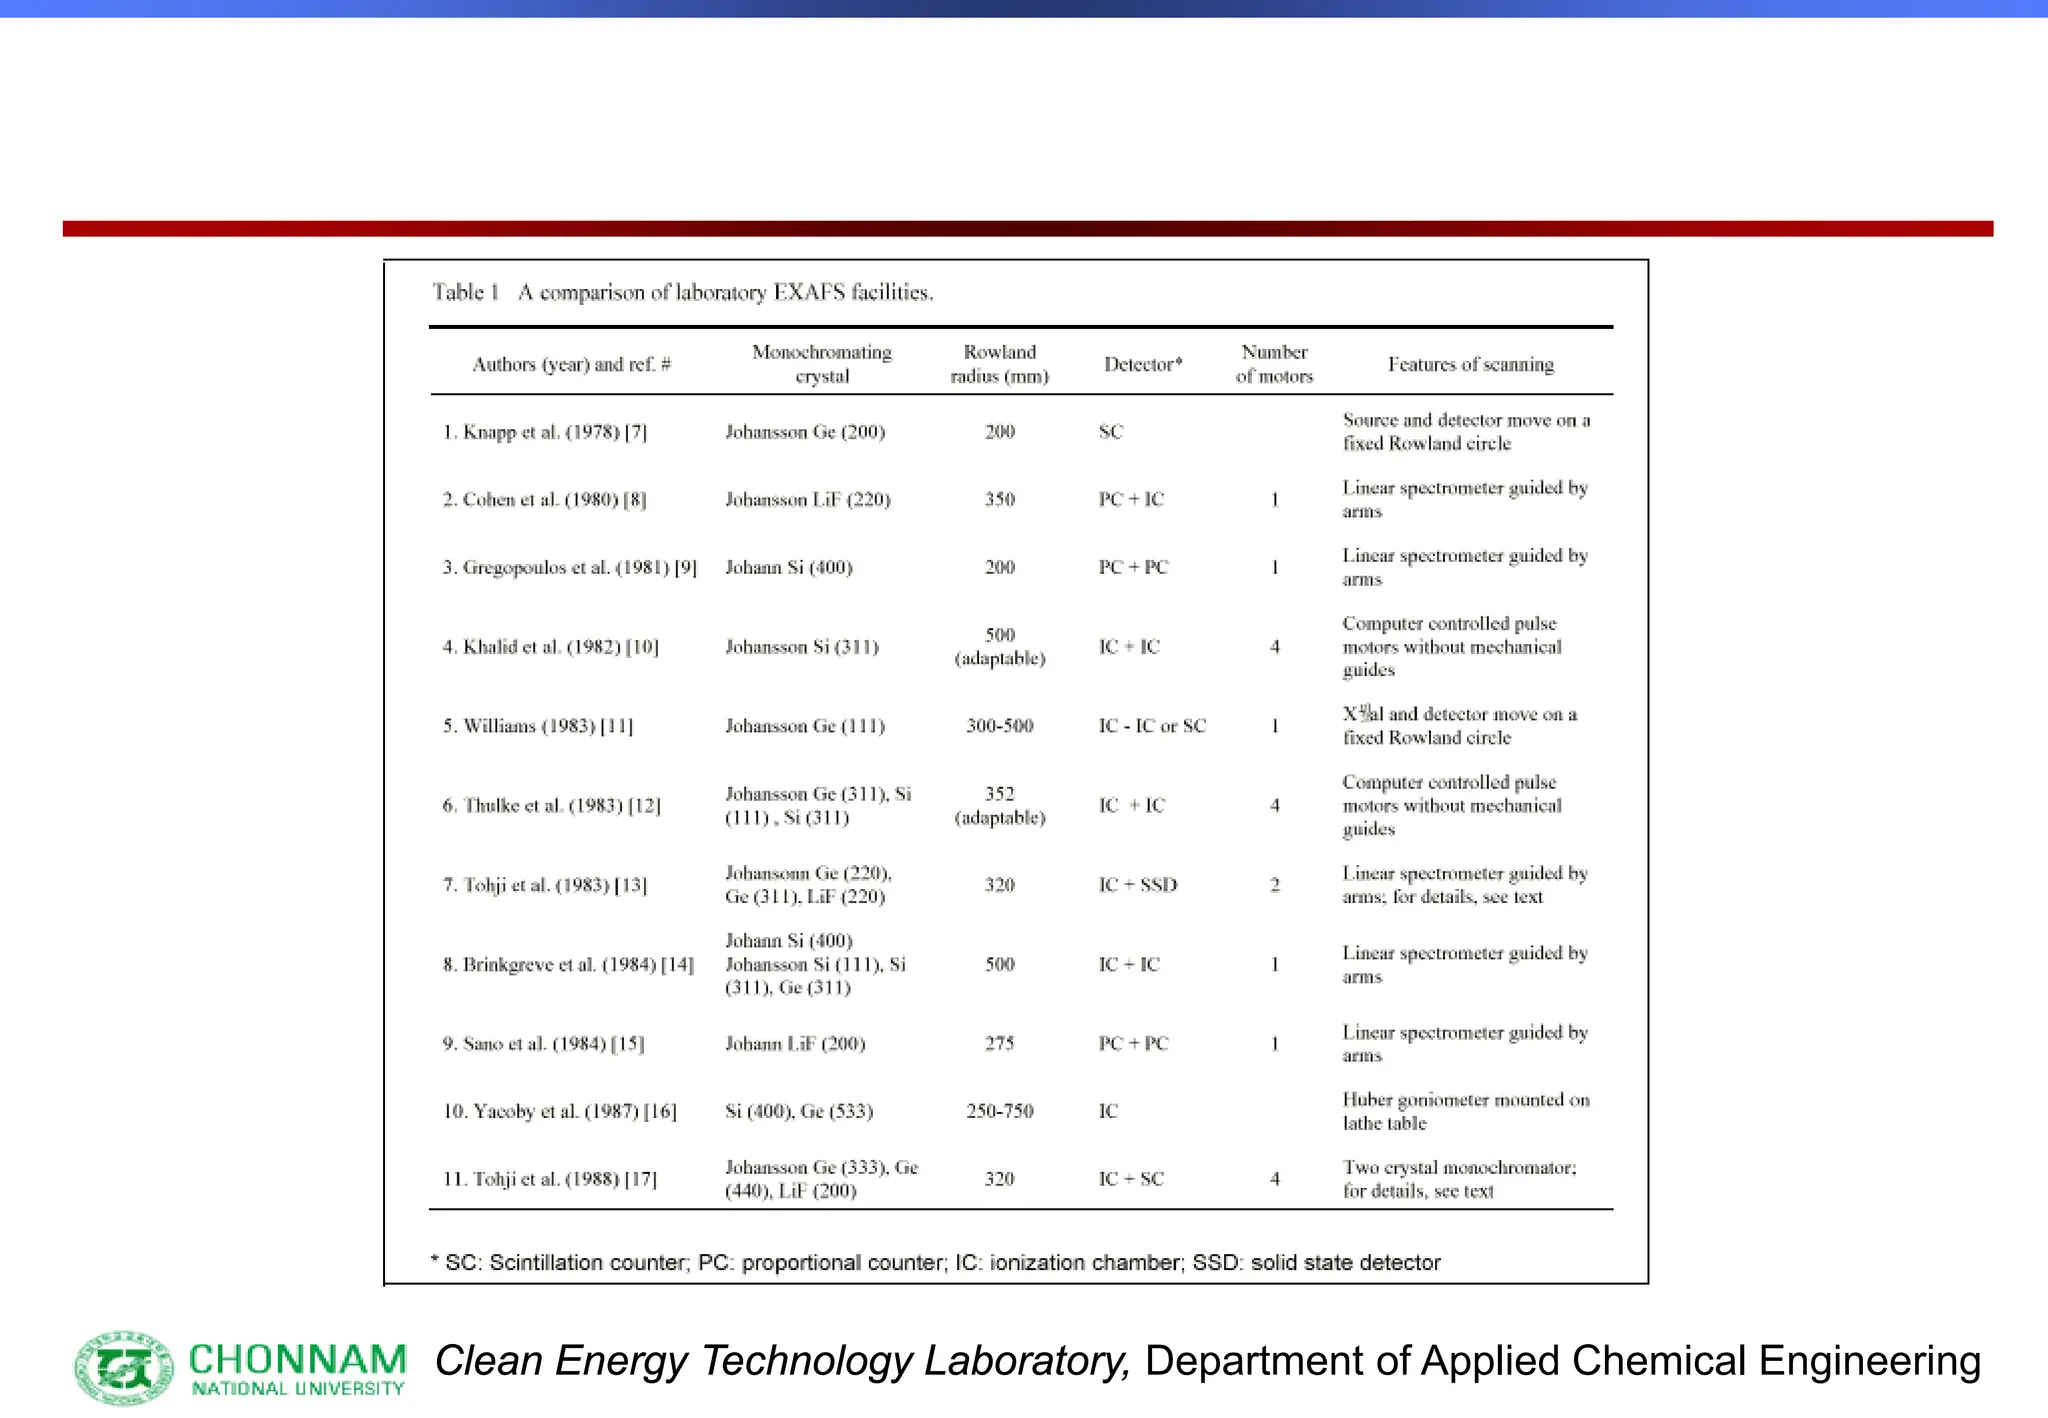
Type of monochromator crystals
[1] Effective utilization of X-rays
[2] Elimination of unnecessary X-rays originating
from different order reflections](https://image.slidesharecdn.com/xafsinst-250421081425-55fe2fa6/75/EXAFS-for-Structural-Characterization-Extended-X-ray-Absorption-Fine-Structure-15-2048.jpg)