2. A. Kumar et al. / Resources, Conservation and Recycling 122 (2017) 32–42 33
10. Current recycling technologies . . . . . . . . . . . . . . . . . . . . . . . . . . . . . . . . . . . . . . . . . . . . . . . . . . . . . . . . . . . . . . . . . . . . . . . . . . . . . . . . . . . . . . . . . . . . . . . . . . . . . . . . . . . . . . . . . . . . . . . . . . 40
10.1. Pre-processing . . . . . . . . . . . . . . . . . . . . . . . . . . . . . . . . . . . . . . . . . . . . . . . . . . . . . . . . . . . . . . . . . . . . . . . . . . . . . . . . . . . . . . . . . . . . . . . . . . . . . . . . . . . . . . . . . . . . . . . . . . . . . . . . . . . 40
10.1.1. Dismantling . . . . . . . . . . . . . . . . . . . . . . . . . . . . . . . . . . . . . . . . . . . . . . . . . . . . . . . . . . . . . . . . . . . . . . . . . . . . . . . . . . . . . . . . . . . . . . . . . . . . . . . . . . . . . . . . . . . . . . . . . . . . 40
10.1.2. Shredding/comminution . . . . . . . . . . . . . . . . . . . . . . . . . . . . . . . . . . . . . . . . . . . . . . . . . . . . . . . . . . . . . . . . . . . . . . . . . . . . . . . . . . . . . . . . . . . . . . . . . . . . . . . . . . . . . . . 40
10.1.3. Mechanical separation/enrichment. . . . . . . . . . . . . . . . . . . . . . . . . . . . . . . . . . . . . . . . . . . . . . . . . . . . . . . . . . . . . . . . . . . . . . . . . . . . . . . . . . . . . . . . . . . . . . . . . . . .40
10.2. End-processing. . . . . . . . . . . . . . . . . . . . . . . . . . . . . . . . . . . . . . . . . . . . . . . . . . . . . . . . . . . . . . . . . . . . . . . . . . . . . . . . . . . . . . . . . . . . . . . . . . . . . . . . . . . . . . . . . . . . . . . . . . . . . . . . . . .40
10.2.1. Pyro-metallurgy . . . . . . . . . . . . . . . . . . . . . . . . . . . . . . . . . . . . . . . . . . . . . . . . . . . . . . . . . . . . . . . . . . . . . . . . . . . . . . . . . . . . . . . . . . . . . . . . . . . . . . . . . . . . . . . . . . . . . . . . 40
10.2.2. Hydro-metallurgy . . . . . . . . . . . . . . . . . . . . . . . . . . . . . . . . . . . . . . . . . . . . . . . . . . . . . . . . . . . . . . . . . . . . . . . . . . . . . . . . . . . . . . . . . . . . . . . . . . . . . . . . . . . . . . . . . . . . . . 40
10.2.3. Bio-metallurgy . . . . . . . . . . . . . . . . . . . . . . . . . . . . . . . . . . . . . . . . . . . . . . . . . . . . . . . . . . . . . . . . . . . . . . . . . . . . . . . . . . . . . . . . . . . . . . . . . . . . . . . . . . . . . . . . . . . . . . . . . 41
11. Conclusion . . . . . . . . . . . . . . . . . . . . . . . . . . . . . . . . . . . . . . . . . . . . . . . . . . . . . . . . . . . . . . . . . . . . . . . . . . . . . . . . . . . . . . . . . . . . . . . . . . . . . . . . . . . . . . . . . . . . . . . . . . . . . . . . . . . . . . . . . . . . . . . 41
References . . . . . . . . . . . . . . . . . . . . . . . . . . . . . . . . . . . . . . . . . . . . . . . . . . . . . . . . . . . . . . . . . . . . . . . . . . . . . . . . . . . . . . . . . . . . . . . . . . . . . . . . . . . . . . . . . . . . . . . . . . . . . . . . . . . . . . . . . . . . . . . . 41
1. Introduction
Electronic waste is a growing concern around the world.
With technological advancements, industries have moved towards
greater automation, which has increased the electrical and elec-
tronic equipment usage. Electrical and electronics products have
become common in the daily life of the average consumer, fre-
quently used in manufacturing and other industries. At the same
time, the development of advanced, faster and more reliable com-
puting and processing technologies has led to a decreased product
life cycle driving consumers to purchase newer and more current
in terms of technology products while discarding older products.
All these developments have in turn led to an exponential increase
in e-waste generation. According to Balde et al. (2015), the total e-
waste generated worldwide was estimated at approximately 41.8
million tonnes in 2014 (5.9 kg/inhabitant).
Namias (2013) suggested that the electronic waste contains up
to 60 metals including copper, gold, silver, palladium and platinum.
Recovery of these metals from the e-waste could reduce the total
global demand for new metal production to some extent. E-waste
recycling also helps to reduce the amount of material disposed of
in the landfills. Even with all the potential benefits only 15% of the
global e-waste is fully recycled (Heacock et al., 2015).
2. Definition and categories
Any electrical and electronic product that had been discarded
is considered as an electronic waste or referred to in short as e-
waste. A well-rounded definition is very important to have in order
to formulate policies and disposal standards. Solving the e-waste
problem (SteP) is an international initiative that works on devel-
oping solutions for the e-waste issue around the globe. According
to Step Initiative (2014),
“E-waste is a term used to cover items of all types of electrical and
electronic equipment (EEE) and its part that have been discarded
by the owner as waste without intention of re-use.”
Balde et al. (2015) divided the electronic waste into six distinct
categories:
1. Temperature exchange equipment: refrigerators, freezers, air
conditioner, heat pump;
2. Screens & monitors: televisions, monitors, laptops, notebooks,
tablets;
3. Lamps: fluorescent lamps, LED lamps, high-intensity discharge
lamps;
4. Large equipment: washing machines, clothes dryers, electric
stoves, large printing machines, copying machines, photovoltaic
panels;
5. Small equipment: vacuum cleaners, toasters, microwaves, ven-
tilation equipment, scales, calculators, radio, electric shavers,
kettles, camera, toys, electronic tools, medical devices, small
monitoring and control equipment;
6. Small IT and telecommunication equipment: mobile phones,
GPS, pocket calculators, routers, personal computers, printers,
telephones.
Based on the European Union Directive, Widmer et al. (2005)
and Gaidajis et al. (2010) have also included medical devices, toys,
leisure and sports equipment and automatic dispensers as e-waste.
However, these equipment are no longer included in the European
Union Directive (The European Commission, 2012).
3. Objectives and methodology
The major objective of this review paper is to analyze the
influence of electronic waste on the society and environment and
establish the major factors affecting the generation of electronic
waste around the world. The secondary objectives and adopted
approaches are listed below.
• Collecting data for e-waste generation. The report published by
the United Nations University was used here to gather data
related to e-waste generation.
• Analyzing the factors affecting e-waste generation. The data
reported by United Nations University was combined with the
economic and population data from World Bank to establish the
correlation between various indices.
• Analyzing the future trend of e-waste: To study the future trends,
the electronic and electrical equipment sales data were collected
as well as the estimated life of various products.
• Understanding the benefits and reasons for recycling. The bene-
fits analysis of e-waste recycling was performed using values of
materials present in the e-waste and environmental and public
health issues associated with the hazardous materials present in
e-waste.
Along with these objectives, the current practices to deal with
e-waste and most common recycling methods adopted are also pre-
sented in this paper along with the benefits and issues associated
with these processes.
4. Statistics
Balde et al. (2015) estimated that the total e-waste produced
around the world was 41.8 million tonnes in 2014 and expected
to rise to approximately 50 million tonnes by 2018. The estimated
annual growth rate for the e-waste stream is 3–5% (Cucchiella et al.,
2015). This rate is about three times faster than other waste streams
(Singh et al., 2016). The amount of e-waste in different categories
is provided in Table 1.
Table 1 shows that the small and large equipment, temperature
exchange equipment and screens/monitors are the major contrib-
3. 34 A. Kumar et al. / Resources, Conservation and Recycling 122 (2017) 32–42
Table 1
E-waste in different categories.
Categories Amount (in million tonnes)
Temperature exchange equipment 7.0
Screens & monitors 6.3
Lamps 1.0
Large equipment 11.8
Small equipment 12.8
Small IT and telecommunication equipment 3.0
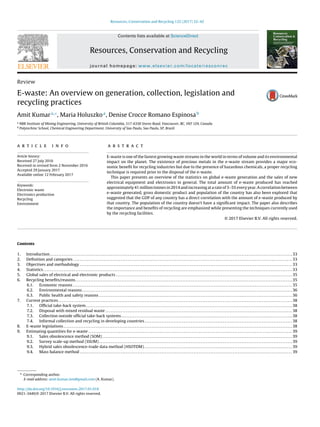
Fig. 1. Estimated PV panel waste (Weckend et al., 2016).
Table 2
Total e-waste categorized by continents.
Continents Amount (in million tonnes) Amount (kg/inh.)
Africa 1.9 1.7
Americas (north & south) 11.7 12.2
Asia 16.0 3.7
Europe 11.6 15.6
Oceania (Australia) 0.6 15.2
utors to the electronic waste stream. Photovoltaic panels are a new
type of waste added to the e-waste category. The total amount of
global PV waste stream is expected to reach 43,500–250,000 met-
ric tons by the end of 2016 and will reach 5.5–6 million tonnes by
2050 (Weckend et al., 2016). Fig. 1 shows the expected growth in
waste PV panels. This shows that the e-waste stream is a rapidly
evolving waste streams due to the development of newer products.
Similarly, the vast majority of CRT screens are expected to be col-
lected within next 10 years and it will gradually decrease (Singh
et al., 2016).
The amount of electronic waste generated by continents and per
inhabitants is listed in Table 2. It confirms the fact that e-waste is
a concern all over the world but definitely, it is concentrated in the
regions where economic development is the greatest.
The e-waste data provided by Balde et al. (2015) is combined
with the GDP and population data obtained from World bank
database (2014) in order to correlate the total e-waste generated
in 50 countries with the highest gross domestic product (GDP) and
with the highest population as shown in Figs. 2 and 3. Fig. 4 shows
the correlation between the e-waste and GDP per inhabitant.
Fig. 2 shows a linear relationship between the GDP and the
amount of e-waste generated in a country whereas Fig. 3 suggests
that there is no significant correlation or trend between the popu-
lation and the amount of e-waste produced by the country.
The two outliers in Fig. 2 are the United States and China. These
two countries have significantly higher than any other country
GDP ($17,419.0 billion and $10,360.1 billion) and also generate
high amounts of e-waste (7072 and 6033 kt) due to their strong
economic development and larger population. In Fig. 3, the three
outliers are the United States, China, and India. As mentioned ear-
lier, USA and China have high GDP and high share in e-waste
R² = 0.9583
R² = 0.0563
0
5
10
15
20
25
30
0
1,000
2,000
3,000
4,000
5,000
6,000
7,000
8,000
9,000
0 5,000 10,000 15,000 20,000
E-wasteperinhabitant(inkg)
Totale-waste(inkt)
GDP (in billion dollars)
Total e-waste E-waste/inh.
China
USA
Fig. 2. Total e-waste and e-waste/inh. vs. GDP.
R² = 0.3897
R² = 0.0504
0
5
10
15
20
25
30
0
1,000
2,000
3,000
4,000
5,000
6,000
7,000
8,000
0 200 400 600 800 1,000 1,200 1,400 1,600
E-wasteperinhabitant(inkg)
Totale-waste(inkt)
Population (in millions)
Total e-waste E-waste/inh.
China
USA
India
Fig. 3. Total e-waste and e-waste/inh. vs. population.
R² = 0.0113
R² = 0.8327
0
5
10
15
20
25
30
35
40
0
1,000
2,000
3,000
4,000
5,000
6,000
7,000
8,000
0 20,000 40,000 60,000 80,000 1,00,000 1,20,000
E-wasteperinhabitant(inkg)
Totale-waste(inkt)
GDP per capita (in dollars)
Total e-waste E-waste/inh.
Fig. 4. Total e-waste and e-waste/inh. vs. GDP per capita.
generation. On the other hand, the larger population in India is
responsible for an increased share of total e-waste generation
(1641 kt), but relatively low e-waste generation per inhabitant due
to its lower GDP.
Fig. 4 indicates that the electronic waste generated per inhabi-
tant in any country is correlated with the per capita income of the
inhabitants which suggests that the amount of electronic waste
generated by every inhabitant increases with the increase in their
individual wealth hence purchasing power.
In summary, Figs. 2–4 suggest that a country with higher GDP
is most likely to have a higher e-waste generation, on the other
hand, a country with larger population doesn’t necessarily produce
significantly larger amount of e-waste if the purchasing power and
GDP is lower.
As an example, a comparison of e-waste generation in India and
China is shown in Table 3. It shows that both the countries have the
similar population but China has higher GDP and higher GDP per
capita which in turns boosts the total e-waste generation.
With the increasing purchasing power of the residents in the
developing countries, it is expected that the total e-waste genera-
4. A. Kumar et al. / Resources, Conservation and Recycling 122 (2017) 32–42 35
Table 3
E-waste generation comparison in India and China.
Units India China
Population million $ 1295.3 1364.3
GDP billion $ 2066.9 10,360.1
GDP per capita $ 1595.7 7593.9
Total e-waste generation kt 1641 6033
E-waste generation per capita kg 1.3 4.4
Table 4
Number of EEE units sold.
Items Units (in millions) Source Year
Android phones 1675.45 StatisticBrain (2015) 2015
iPhone 6 19.75 StatisticBrain (2015) 2015
Total smartphones 12,444.89 Gartner (2014) 2015
Laptop & desktop 238.5 StatisticBrain (2015) 2016
LCD TV 5.79 StatisticBrain (2015) 2015
Plasma TV 0.63 StatisticBrain (2015) 2015
CRT TV 0.55 StatisticBrain (2015) 2015
Total TV 7.08 StatisticBrain (2015) 2015
Printers 106,000 StatisticBrain (2015) 2014
e-book reader 20.2 StatisticBrain (2015) 2015
Home appliances 583 Statista (2016) 2013
Electric ovens 0.733 (USA) Statista (2016) 2015
Refrigerator 11.13 (USA) Statista (2016) 2013
Automatic washers 9.68 (USA) Statista (2016) 2013
Table 5
Estimated lifespan of EEE (Ely, 2014).
Items Average life (years)
Flat panel TV 7.4
Digital camera 6.5
DVD player or recorder 6.0
Desktop computer 5.9
Blue-ray player 5.8
Video game console 5.7
Laptop/notebook 5.5
Tablet 5.1
Cellphones (not smartphones) 4.7
Smartphones 4.6
tion for countries like China, India and Brazil will soon surpass the
developed countries (Li et al., 2015).
5. Global sales of electrical and electronic products
The global sales data for various electronics and home appli-
ances are shown in Table 4 (Gartner, 2014; Statista, 2016;
StatisticBrain, 2015).
The life expectancy of electronic products listed by Ely (2014)
is shown in Table 5. Tables 4 and 5 suggest that all the phones and
laptops/desktops sold in the year 2014–15 will contribute to the
e-waste stream within 4–5 years. According to Robinson (2009),
one billion computers will be discarded in next five years. Another
study by Ala-Kurikka (2015) suggested that more than 60% of the
replaced televisions were still functioning in 2012 most probably
due to the technology change from CRT TVs to LCD and LED TVs
which indicates that replacement period for consumer electron-
ics is short due to the rapidly changing industry and technological
advancements. With the development of newer technology, older
technology gets obsolete and report to the waste stream.
6. Recycling benefits/reasons
There are three main benefits/reasons for recycling a) economic
benefits b) environmental benefits and c) public health and safety
benefits.
Table 6
Value of materials present in e-waste stream (Balde et al., 2015).
Material Amount (kt) Value (million Euros)
Iron/steel 16,500 9000
Copper 1900 10,600
Aluminum 220 3200
Gold 0.3 10,400
Silver 1.0 580
Palladium 0.1 1800
Plastics 8600 12,300
Fig. 5. Potential revenue from e-waste streams (Cucchiella et al., 2015).
6.1. Economic reasons
From 2005–2014, the global demand for copper, tin, and silver
in electronics application has been increasing while the demand for
gold has been relatively stable (Golev et al., 2016). Electronic waste
contains up to 60 different metals including some valuable and pre-
cious metals such as copper, gold, silver, palladium, aluminum and
iron (Namias, 2013). An estimate provided by Balde et al. (2015) as
shown in Table 6 evaluated the estimated value of e-waste at D 48
billion.
The printed circuit board represents the most valuable part of
e-waste accounting for over 40% of the total e-waste metal value
(Golev et al., 2016). BullionStreet (2012) summarized that 320 t of
gold and 7500 t of silver is consumed by the electronic industry
every year and urban mining of e-waste could generate $21 bil-
lion each year. Cucchiella et al. (2015) showed that the notebooks,
tablets, and smartphones are the most valuable categories for the
e-waste stream due to the presence of a larger concentration of pre-
cious and critical metals. Almost 3–6% of the total e-waste is printed
circuit boards which contain a significant proportion of valuable
metals like gold, silver, gold and palladium. Golev et al. (2016) also
concluded that more than 80% of gold and PGMs and over 70% of
silver are locked in screens, monitors, and small It equipment. Fig. 5
shows the potential revenue per kg and per unit for some e-waste
streams. The potential revenue from the printed circuit boards is
$21,200/t.
At the same time, the concentration of metal in the e-waste
stream is significantly higher than the conventional mining oper-
ations. Studies have shown that the global ore grade are declining
and mines are forced to excavate more complex and fine-grained
ore deposits to meet the global metal demand (Lèbre and Corder,
2015). Table 7 shows the concentration of metals in various elec-
tronics items (Namias, 2013) and an average grade of metal in
the ores excavated from mines (Desjardins, 2014; Investing News
Network, 2016; McLeod, 2014; Vincic, 2015). The palladium grade
is based on the average mill head grade at North American Palla-
dium Ltd. in 2014. Table 7 clearly shows that the average grade
in electronics for copper, gold, silver and palladium is significantly
higher than that of an orebody extracted by the conventional min-
ing operation.
5. 36 A. Kumar et al. / Resources, Conservation and Recycling 122 (2017) 32–42
Table 7
Metal concentration in electronics and ore (Desjardins, 2014; Investing News
Network, 2016; McLeod, 2014; Namias, 2013; Vincic, 2015).
Product Copper
(% by wt)
Silver
(ppm)
Gold
(ppm)
Palladium
(ppm)
Television board 10 280 20 10
PC board 20 1000 250 110
Mobile phone 13 3500 340 130
Portable audio scrap 21 150 10 4
DVD player scrap 5 115 15 4
Average electronics 13.8 1009 127 51.6
Ore/mine 0.6 215.5 1.01 2.7
Table 8
Metals present in mobile phones and run of mine ore (Electronics TakeBack
Coalition, 2014).
Amount (kg) Mobile phones Run of mine ore
Gold 24 1 million units ∼ 148.4 t 23,762.4 t of gold ore
Silver 250 1160.1 t of silver ore
Palladium 9 3333.3 t of palladium ore
Copper 9000 1500.0 t of copper ore
An estimate provided by Electronics TakeBack Coalition (2014)
regarding the amount of various metals that can be recovered from
recycling 1 million cell phones is shown in Table 8. It also shows
the amount of run of mine ore that needs to be processed in order
to obtain the same amount of metal based on the average metal
grade shown in Table 7. It shows that the amount of run of mine
ore that needs to be processed to obtain the same amount of metals
is 10–160 times more than that of the waste mobile phones. The
data assumes 100% recovery in both mobile phones and run of mine
ore.
E-waste also provides a better opportunity for an already scarce
natural element such as gallium (annual production ∼215 t) and
indium (annual production ∼1100 t). Both these metals have an
estimated life of 20 years before it completely runs out (Li et al.,
2015).
From an economic point of view, the e-waste industry is
also capable of creating additional jobs. 296 more jobs for every
10,000 t of material disposed of can be created by computer reuse
(Electronics TakeBack Coalition, 2014). In Guiyu, China, informal
e-waste recycling provided jobs to almost 100,000 people as e-
waste recyclers (Heacock et al., 2015). With the similar throughput,
300–600 new treatment facilities will have to be developed in China
to deal with the total generated e-waste from 2020 to 30 that can
potentially provide jobs to 30,000 people (Zeng et al., 2016).
6.2. Environmental reasons
The recycling industry plays a key role in environmental pro-
tection by keeping the hazardous waste out of the landfills thus
reducing the risks associated with disposal. The e-waste stream
contains many hazardous materials such as mercury, cadmium,
lead, chromium, poly/brominated flame retardants, ozone deplet-
ing chemicals such as CFC etc. (Balde et al., 2015). Disposal of these
chemicals/metals in the landfill or by incineration produce harmful
effects to the environment. Well controlled and regulated landfill
and incineration might provide a temporary solution to the global
e-waste problem but not viable in the longer term especially for the
countries with the scarcity of landmasses such as Japan and Europe
and it also reduce the possibility of resource recovery.
On the other hand, recycling e-waste will reduce the total
global demand for new metal production, which helps to reduce
the greenhouse gas emissions. According to Electronics TakeBack
Coalition (2014), it requires 240 kg of fossil fuels, 22 kg of chemicals
and 1.5 t of water to produce one computer with monitor.
Table 9
Recycled material energy saving over virgin materials (Cui and Forssberg, 2003).
Materials Energy saving (%)
Aluminum 95
Copper 85
Iron and steel 74
Lead 65
Zinc 60
Paper 64
Plastics >80
Recycling metals from e-waste provide significant energy sav-
ing compared to virgin materials as shown in Table 9. This energy
saving then directly has a direct impact on the greenhouse gas
emissions due to new metal production.
For example, recycling 10 kg aluminum not only provides a 90%
energy saving but also prevents the creation of 13 kg of baux-
ite residue, 20 kg of CO2 gas and 0.11 kg of SO2 gas (Electronics
TakeBack Coalition, 2014). Similarly, recycling iron and steel pro-
vides 74% of energy saving, 86% reduction in air pollution, 40%
reduction in water use, 76% in reduction in water pollution, 97%
reduction in mining wastes and 90% saving in virgin materials use
(Cui and Forssberg, 2003). Van Eygen et al. (2016) showed that recy-
cling of desktops and laptops provides 80 and 87% resource saving
respectively as shown in Fig. 6.
6.3. Public health and safety reasons
As indicated earlier, the e-waste stream contains hazardous
metals and chemicals. It not only poses a threat to the environment
but also to the public health and safety. Garlapati (2016) presented
a list of hazardous components and chemicals present in e-waste
as shown in Table 10.
Table 11 shows the effect of the various hazardous material
present in e-waste on the human health (Brigden et al., 2005). Balde
et al. (2015) also concluded that the hazardous materials from the
e-waste can impair mental development, kidney, and liver damage
and have carcinogens released into the air causing lung damage.
A typical recovery method in informal sector for recovering cop-
per from the cables is to burn polyvinyl chloride in open air and
acid/caustic leaching of printed circuit boards to obtain precious
metals (Velis and Mavropoulos, 2016). These methods, disposal
of these chemicals/metals in landfills or by incineration produce
harmful effects to the environment and life can be exposed to these
chemicals through water, air, soil, dust or food (Heacock et al.,
2015). The amount of cadmium present in a cell phone battery have
a potential to contaminate 600m3 of water (Garlapati, 2016).
Scruggs et al. (2016) showed that the consumers can be exposed
to the hazardous chemical while using the electronics products.
Decabromodiphenylether, a common flame retardant in electron-
ics casing, form polybrominated dibenzofurans when exposed to
normal sunlight and accumulate in household and office dust and
can eventually end up in the water supplies.
Brigden et al. (2005) also showed the elevated levels of
these hazardous materials in different e-waste processing facil-
ities and workshops in China and India. For example, the
discharge channel sediments near Guiyu to Nanyang road
and Chendiandian to Guiyu road in China had elevated lev-
els of copper (9500–45900 mg/kg), lead (4500–44300 mg/kg),
tin (4600–33000 mg/kg), antimony (1390–2150 mg/kg), nickel
(150–2060 mg/kg) and cadmium (13–85 mg/kg) which was
400–600 times higher than that is expected from uncontami-
nated river sediments. Similarly, a sample from the final spent acid
wastes from an acid processing/leaching facility in Mandoli Indus-
trial area (New Delhi, India) showed elevated levels of antimony
(68 mg/l), copper (240 mg/l), lead (20 mg/l), nickel (478 mg/l), tin
6. A. Kumar et al. / Resources, Conservation and Recycling 122 (2017) 32–42 37
Fig. 6. Resource savings from recycling of desktops and laptops.
Table 10
Hazardous components and chemicals in e-waste.
Components Substance Occurrence in e-waste
Halogenated
Compound
Polychlorinated biphenyls Condensers, transformers
Polybrominated biphenyls Fire retardants for
plasticsPolychlorinated diphenyl ether
Chlorofluorocarbon Cooling unit, insulation foam
Polyvinyl chloride Cable Insulation
Radio-active substances Americium Medical equipment, fire detectors, active sensing element in smoke detectors
Heavy and other metals Arsenic Light emitting diodes
Barium Getters in CRT screens
Beryllium Power supply boxes contains silicon controlled rectifiers and x-ray lenses
Cadmium Rechargeable Ni-Cd batteries, fluorescent layer in CRT screens, printer inks and toners
Chromium VI Data tapes, floppy disk
Lead CRT screens, batteries, printed circuit boards
Lithium Li-batteries
Mercury Fluorescent lamps, alkaline batteries
Nickel Rechargeable Ni-Cd batteries, electron gun in CRT screens
Rare earth elements Fluorescent layer
Selenium Older photocopying machines
Zinc sulphide Interior of CRT screens
Others Toner dust Toner cartridges for laser printer/copiers
Table 11
Harmful effects of hazardous materials.
Materials Effect on human health
Antimony Severe skin problems and other health effects
Cadmium Damage to kidneys and bone structure, accumulate in body over time
Lead Highly toxic for human, plants and animals, irreversible effects on nervous system especially in children,
accumulate in body over time
Mercury Highly toxic, damage to central nervous systems and kidneys, get converted to organic methylated form that
is highly bio-accumulative
Nonylphenol Cause intersex in fish, build up in food chain, damage DNA and sperm function in humans
Polybrominated diphenyl ether Interfere with growth hormones and sexual development, effect on immune systems, interfere with brain
development in animals
Polychlorinated biphenyls Suppression of immune system, liver damage, cancer promotion, damage to nervous system, behavioral
changes and damage to male and female reproductive system
Polychlorinated naphthalene Toxicity to wildlife and possibly humans, impacts on skin, liver, nervous systems and reproductive system
Triphenyl phosphate Toxic to aquatic life, strong inhibitor of key enzyme system in human blood, can cause contact dermatitis and
possible endocrine disruptor
(340 mg/l) and zinc (2710 mg/l) along with phthalate esters and
chlorophenols. These elevated levels of hazardous metals show the
importance of proper recycling techniques and safer recycling facil-
ities that can reduce the risks related to the environmental and
public health and safety issues. Similar results were obtained from
formal recycling sites with elevated content of nickel, copper, lead,
zinc and cadmium in Philippines (Yoshida et al., 2016).
Scruggs et al. (2016) suggested that goal of Strategic Approach
to International Chemicals Management of ensuring the delivery of
the chemical information to all the stakeholders in the electronic
7. 38 A. Kumar et al. / Resources, Conservation and Recycling 122 (2017) 32–42
products management chain including governments, chemical pro-
ducers, manufacturers, brand owners, consumers, recyclers and
waste handlers is yet not achieved. It was recommended that a list
of chemicals used in the product and reporting information should
be identified and streamlined software to enable automated data
exchange should be implemented. The materials tracking in the
product chain is also important to identify the bottleneck in the
product chain.
7. Current practices
According to Widmer et al. (2005), about 70% of heavy metals in
US landfills comes from e-waste. Balde et al. (2015) classified the
current practices adopted to deal with e-waste into four categories.
7.1. Official take-back system
This method is mostly observed in developed countries where
e-waste is collected by municipalities (curbside collection, munici-
pal collection points), retailers or commercial pick-up services and
then sent for further processing to different centers.
7.2. Disposal with mixed residual waste
This practice is mostly observed in developing countries where
e-waste is disposed of with the household waste that goes to land-
fills or incineration and has a very low chance of separation. In
the end, it adds up to the toxic leaching in a landfill or harmful
emissions in the air if incinerated.
7.3. Collection outside official take-back systems
This practice is mostly observed in developed countries where
e-waste is collected by individual waste dealers or companies and
then sent to metal recycling, plastic recycling or exported. An esti-
mated 50%–80% of total e-waste is shipped from the USA to the
developing countries (Namias, 2013). According to Cucchiella et al.
(2015) almost 50% of the e-waste generate by the developed coun-
tries is illegally is exported to China and a significant quantity
also goes to India, Pakistan, Vietnam, Philippines, Malaysia, Nigeria,
Ghana and possibly Mexico and Brazil. WorldLoop (2013) showed
the known and suspected destination of e-waste as shown in Fig. 7.
Golev et al. (2016) suggested that the e-waste collection system
in Australia and other developed countries doesn’t allow feasible
material recovery within domestic borders that results in massive
exports of e-waste for processing to developing countries. Adop-
tion of better technological advancements, small scale recycling
and controlled landfilling will be viable options to decrease the ille-
gal processing and exports. Designing modular recycling system
and infrastructure should be able to boost the e-waste recycling
rate around the world (Li et al., 2015).
7.4. Informal collection and recycling in developing countries
Mostly observed in developing countries where self-employed
people engaged in collection and recycling of e-waste collect the
e-waste. The collection is mostly door-to-door basis with unskilled
workers. If the collected waste does not have any value, then it
is dumped into the landfill or incinerated and this causes severe
damage to the environment and poses serious human health risks.
Informal recycling uses larger labor force and low-level technology
and includes junk shops or private individuals and generate low
levels of income (Yoshida et al., 2016).
Four scenarios of e-waste management were reviewed by
(2016) and a future outlook was proposed as shown in Fig. 8.
Fig. 8. Global scenario of e-waste management.
1. Local dumping: applies to the large part of the world where e-
waste is landfilled
2. Export and dump: e-waste is exported to developing countries
and dumped there
3. Low-level recovery: Mostly seen in developing countries and
provides jobs and saves energy and raw materials.
4. High-level recovery: It also saves energy and raw materials.
Additionally, it prevents illegal export to developing countries.
8. E-waste legislations
Legislation around the world is in place to develop and practice
the efficient and sustainable way of e-waste collection, recycling,
and transportation.
The European WEEE Directive in 2002 was developed to man-
age the end of life electronics in the European Union to improve
the collection and efficiency of the recycling chain whereas the
RoHS Directive restricted the use of certain hazardous substances
in the EEE production. The collection targets are defined as a fixed
amount per inhabitant (currently 4 kg). In 2016, the regulations
were changed and the collection target was defined as 45% of the
amount of EEE put on the market. In 2019, it will be increased to
65% of the EEE or 85% of the WEEE (Van Eygen et al., 2016). Van
Eygen et al. (2016) showed that the recycling targets of WEEE in the
European Union doesn’t promote the recovery of metals present in
minor amounts.
The Basal convention was designed in 1992 under United
Nations Environment program to monitor and control the trans-
boundary flow of hazardous wastes and their disposals. Several
international organizations such as Mobile Phone Partnership Ini-
tiative (MPPI), Solving the E-waste Problem (StEP), Partnership for
Action on Computing Equipment (PACE), National Electronics Prod-
uct Stewardship Initiative (NEPSI) WEEE Forum were launched to
control the e-waste problem (Widmer et al., 2005).
Japan launched the Home Appliance Recycling Law (HARL) and
Small Appliance Recycling Law to increase the recycling rate due
to the scarcity of land mass for solid waste disposal. Countries like
USA and Canada doesn’t have proper federal regulations to deal
with the e-waste issue rather than rely on policies imposed by the
provincial government for e-waste management (Li et al., 2015).
The extended producer responsibility and the eco-fee are a tool to
improve the e-waste collection and recycling in North America and
the European Union.
Australia have passed the National Waste Policy (2009) and
National Television and Computer Recycling Scheme (2011) to
improve the recycling rate but the e-waste management in
8. A. Kumar et al. / Resources, Conservation and Recycling 122 (2017) 32–42 39
Fig. 7. Known and suspected routes of e-waste dumping (WorldLoop, 2013).
Australia is not properly implemented, based on outdated targets
and it lags behind the international best practices (Gough, 2016).
China placed the extended producer responsibility practice in
2011 for WEEE recycling. India developed the “Guidelines for envi-
ronmentally sound management of e-waste” in 2008 to classify
the e-waste according to the components and compositions. The
e-waste management and handling guidelines were developed in
2011 for e-waste collection and recycling. In Indonesia, there is
no specific legislation for e-waste management but it is regulated
as the hazardous and toxic waste under the Republic of Indonesia
Act concerning Environmental protection and Management. Both
Indonesia and Philippines are in the process of finalizing their e-
waste legislation (Yoshida et al., 2016).
Zeng et al. (2017) pointed out the two major gap in the current
e-waste regulation: lack of proper concern on recovered materials
and no control on substances to avoid heavy metal entering into a
new product. It was suggested that knowledge base regarding the
environmental risk and ecotoxicology of these substances should
be illustrated and new development in the field of e-waste recycling
is needed to reduce the amount of toxic substances entering in the
downstream processes.
There are still challenges in the implementation of these rules
and regulations. The policies in place haven’t yet completely
stopped the trade of toxic e-waste. The Basel Action network (BAN)
tracked around 200 non-functional devices dropped off at various
recycling sites in the USA and 32.5% of the tracked equipment were
exported, 31% of the tracked equipment were likely to be illegal
shipment (Grossman, 2016). Since a major amount of e-waste from
developed countries ends up in developing nations, an interna-
tional technical cooperation and support program will be important
to achieve better management systems (Yoshida et al., 2016). The
manufacturers, recyclers, state and federal regulators and the pub-
lic need to work together to deal with the increasing volume of
e-waste (Singh et al., 2016).
9. Estimating quantities for e-waste
Most often data related to e-waste generation or collection
are not completely available for various regions. There are several
methods proposed to estimate the e-waste generation, collection,
recycling, domestic and transboundary flow.
9.1. Sales obsolescence method (SOM)
This model uses the sales data and lifespans of electronics
obtained through survey and trends in survey collection rates.
Uncertainty in data sets is incorporated using the Monte Carlo sim-
ulations (Miller et al., 2016). The sales data for a region over a time
period is collected and then the lifespan of electronics product is
evaluated based on use, storage, reuse data obtained from the sur-
vey over a time period. Then prediction for waste generation is
performed using sales data and lifespans. Tran et al. (2016) used
a similar approach to model the invisible TV inflow. The invisi-
ble inflow of electronic is the equipment that enters the market
without administratively registered. It was concluded that approx-
imately 20% of the total TV inflow in Vietnam was invisible in 2013.
The major uncertainties associated come from assumptions and
simplifications used for calculation. Additional and better data can
improve the model prediction.
9.2. Survey scale-up method (SSUM)
It uses survey data and census data to quantify the genera-
tion and collection of e-waste for a region. The estimates at the
national level are produced using scaling factors. The estimates for
the national level are scaled up using the data obtained from the
regional level. This is achieved by comparing the national popula-
tion to the surveyed population. Miller et al. (2016) showed that
the data obtained using SSUM method had a lower coefficient of
variation (3–6%) than the SOM (3–28%).
9.3. Hybrid sales obsolescence-trade data method (HSOTDM)
This is a modified SOM method that uses sales and survey data
for to estimate generation, survey collection rate to estimate collec-
tion and detailed trade data to estimate export (CEC, 2016). Since
the trade data for all types of electronics are readily available for
each year and also provides the estimates for the future including
the destination country, hence this method is more detailed.
9.4. Mass balance method
This method uses extrapolation of survey data to quantify the
electronic flows. It provides the ability to estimate several used
9. 40 A. Kumar et al. / Resources, Conservation and Recycling 122 (2017) 32–42
electronic products simultaneously with fewer data inputs. The
exports are calculated using mass balance hence it has higher
uncertainty and the export destination can’t be identified (CEC,
2016).
10. Current recycling technologies
There are two common steps used in the recycling of e-waste
around the world.
a Pre-processing that includes dismantling, shredding, mechanical
separation
b End-processing that includes pyro/hydro/bio metallurgical treat-
ment.
10.1. Pre-processing
This step usually deals with manual disassembly of electronic
devices, removing hazardous materials and separating various
streams such as metals, glass, and plastics. The remaining mate-
rial that can’t be manually separated is sent for shredding and then
separation of metals from plastics and glass is achieved by using
processes such as magnetic and gravity separation (Namias, 2013).
10.1.1. Dismantling
Dismantling process is mainly adopted to remove the hazardous
materials from the waste stream and then separating it manually
into metal, plastics and glass fractions. The waste fraction that can’t
be separated manually is usually shipped to a centralized loca-
tion for shredding and then use mechanical techniques to achieve
separation.
10.1.1.1. Benefits. Removal of hazardous materials, less dust issue,
higher grade material for end-processing, more job opportunities.
10.1.1.2. Issues. Hard to dismantle newer complex technologies,
time-consuming, higher spending on labor and transportation
cost, additional greenhouse gas emissions due to transportation,
increased risk of public health and safety.
10.1.2. Shredding/comminution
This step involves decreasing the particle size of the material for
subsequent processing. A number of equipment, metal shredders,
hammer mills and knife mills, are currently being used for crushing
and grinding the electronic waste (Schubert and Hoberg, 1997).
10.1.2.1. Benefits. Faster automated systems, reduced risk of public
health and safety, increased throughput, less volume for trans-
portation.
10.1.2.2. Issues. High dust issue, loss of material (up to 40%) as dust
(Namias, 2013), increased capital investment, decreased grade for
subsequent operation.
10.1.3. Mechanical separation/enrichment
This step is used to separate various streams from the shredded
material. Most of the units used in a recycling facility are operated
dry but some researchers have shown high efficiency with a wet
operation such as gravity concentration and flotation as well (Das
et al., 2009; Duan et al., 2009; Veit et al., 2014).
Magnetic separation is used to remove ferromagnetic materi-
als such as iron, steel, and rare earth metals. Density separators
such as air tables, air cyclones, and centrifugal separators are used
to recover base metals such as copper, gold, and silver from non-
metal fractions. Eddy current separators can be used to recover
Table 12
Leaching agents for hydrometallurgical treatment (Namias, 2013).
Metal Leaching agent
Base metals Nitric acid
Copper Sulphuric acid or aqua regia
Gold and silver Thiourea or cyanide
Palladium Hydrochloric acid or sodium chlorate
aluminum. Different sensors are also being developed/used to sepa-
rate various streams from each other. For example, infrared sensors
can be used to separate different plastics whereas optical sensors
can be used for glass (Kellner, 2008).
10.1.3.1. Benefits. Faster automated system, reduced public health
and safety issue, increased throughput, lesser mass/volume to
transport for final process, less energy intensive.
10.1.3.2. Issues. Higher capital investment, not suitable for small
recycling businesses, dust issue with dry systems, moisture
removal issue for wet systems.
10.2. End-processing
End-processing involves processes to recover valuable metals
from the concentrate obtained after pre-processing and mostly
used to recover and purify copper, gold, silver and palladium. The
most widely used processes are pyrometallurgy, hydrometallurgy,
and bio-metallurgy (Namias, 2013).
10.2.1. Pyro-metallurgy
The pyrometallurgical process involves melting the materi-
als/concentrate in a high-temperature furnace to obtain a mixture
of desired metals that are further purified mostly using electro-
refining. It is mostly used to recover copper, gold, silver and
palladium. Iron and aluminum usually get oxidized and report to
the slag (Namias, 2013).
10.2.1.1. Benefits. Higher/faster reaction rates due to high temper-
ature and easier separation of valuable and waste.
10.2.1.2. Issues. High energy requirement, generation of dioxins,
furans and volatile metals causing environmental and public health
and safety issue, loss of iron and aluminum in slag, recovery of
plastics is not possible, partial purity of precious metal (Khaliq et al.,
2014; Veit et al., 2014).
10.2.2. Hydro-metallurgy
Hydrometallurgical treatment involves leaching of the concen-
trate from the pre-treatment with various chemicals to dissolve
the valuable metals into solution. Specific leaching agents are used
to precipitating specific metals from the waste material that are
finally purified using electro-winning.
Table 12 lists some of the most commonly used agents to leach
metals from the concentrate/waste.
10.2.2.1. Benefits. More accurate, predictable, easily controlled,
less energy intensive (Veit et al., 2014).
10.2.2.2. Issues. Slow, time-consuming, the requirement of fine
grinding for efficient leaching, more chemicals required, high tox-
icity, high reagent consumption, high cost, generation of effluent
(Khaliq et al., 2014; Veit et al., 2014).
10. A. Kumar et al. / Resources, Conservation and Recycling 122 (2017) 32–42 41
10.2.3. Bio-metallurgy
Bio metallurgical treatment is an environmentally friendly
process where microbes are used to leach metal out of the
waste/concentrate. This method has been gaining popularity for
leaching copper and gold ore. Acidophilic bacterium Thiobacillus
Ferrooxidans is most widely used microbes to leach copper and
gold (Bosecker, 1997). The final purification is performed using
electro-winning.
10.2.3.1. Benefits. Low operating cost, reduction in chemical usage,
easier handleability of waste water/effluent, more eco-friendly
(Namias, 2013).
10.2.3.2. Issues. Slower process, not fully developed for the higher
metal complexity of electronic waste.
One of the major issue with the e-waste recycling is the lack
of formal recycling facilities around the globe. Most of the infor-
mal e-waste recycling involve manual dismantling and then metal
recovery using the homemade equipment. These processes have
a very low recovery. The development of proper formal recycling
facilities will be able to process the e-waste more efficiently and
thus improving the recovery of various metals. Providing financial
and technical support to the formal and informal recycling sec-
tor in developing countries will improve the e-waste management
practices.
Li et al. (2015) suggested that Best Available Technology (BAT)
and Best Environmental Practice (BEP) that extend BAT through
the addition of pollution control should be put as the fundamental
criteria for e-waste recycling. Four approaches were suggested to
improve the global e-waste management and recycling.
1. The developed nations should invest in technology development
and establish or expand new facilities to increase and improve
the e-waste recycling system.
2. The developing nations should consider adopting legislation and
improving the e-waste collection to maximize the recycling
potential.
3. Mobile plant and portable recycling system will be most benefi-
cial for small nations or regions.
4. For the regions with very little e-waste generation, several sur-
rounding regions can unite and establish facilities for e-waste
management.
11. Conclusion
Electronic waste is a growing concern in the current global soci-
ety and a significant amount of this e-waste is being added to the
global waste inventory every year. The data provided by the United
Nations University showed that the regions with greatest economic
development produce most of the e-waste. A linear relation was
found between the GDP and the amount of e-waste generated.
Another correlation indicated that the electronic waste generated
by each inhabitant increase with the increase in their individual
wealth, hence purchasing power. There is no significant correla-
tion or trend between the population and the amount of e-waste
produced by the studied countries.
Another important observation is that life expectancy of elec-
tronic equipment is becoming shorter and shorter, especially in
the case of small electronic devices such as cellphones, tablets, and
small laptops. As a results close to 1 billion devices will be discarded
within 4–5 years. These staggering facts should be considered as an
important incentive for recycling of e-waste.
If this waste is properly recycled, it could offer an opportunity
for urban mining for recovery of copper, gold, silver, palladium and
others metals with an estimated value of D 48 billion. The concen-
tration of metals in the e-waste is significantly higher than in the
natural ores that these metals are mined from (for Au is almost 130
times higher). It can provide a large quantity of valuable metals oth-
erwise representing a wasted stream of garbage. On the other hand,
creating environmental and public health risks due to the presence
of harmful elements and chemicals in their composition.
Various metallurgical routes are currently being implemented
to recover metals from the e-waste stream, but due to the complex
nature of e-waste, new processes or improvements in the current
processing technologies are required.
References
Ala-Kurikka, S., 2015. Electronic Goods’ Life Spans Shrinking, Study Indicates,
Retrieved May 6, 2016, from http://www.endseurope.com/article/39711/
electronic-goods-life-spans-shrinking-study-indicates.
Balde, K., Wang, F., Huisman, J., Kuehr, R., 2015. The Global E-Waste Monitor.
United Nations University, IAS – SCYCLE, Bonn, Germany.
Bosecker, K., 1997. Bioleaching: metal solubilization by microorganisms. FEMS
Microbiol. Rev. 20 (3–4), 591–604, http://dx.doi.org/10.1111/j.1574-6976.
1997.tb00340.x.
Brigden, K., Labunska, I., Santillo, D., Allsopp, M., 2005. Recycling of Electronic
Wastes in China & India: Workplace & Environmental Contamination.
Greenpeace International, Exeter, UK, Retrieved from http://www.greenpeace.
org/international/PageFiles/25134/recycling-of-electronic-waste.pdf.
BullionStreet, 2012. Electronics Industry Uses 320 Tons of Gold, 7500 Tons of Silver
Annually, Retrieved May 6, 2016, from http://www.bullionstreet.com/news/
electronics-industry-uses-320-tons-of-gold7500-tons-of-silver-annually/
2255.
CEC, 2016. Quantitative Characterization of Domestic and Transboundary Flows of
Used Electronic Products. Case Study: Used Computers and Monitors in North
America. Commission for Environmental Cooperation, Montreal, Canada.
Cucchiella, F., D’Adamo, I., Lenny Koh, S.C., Rosa, P., 2015. Recycling of WEEEs: an
economic assessment of present and future e-waste streams. Renew. Sustain.
Energy Rev. 51, 263–272, http://dx.doi.org/10.1016/j.rser.2015.06.010.
Cui, J., Forssberg, E., 2003. Mechanical recycling of waste electric and electronic
equipment: a review. J. Hazard. Mater. 99 (3), 243–263, http://dx.doi.org/10.
1016/S0304-3894(03)00061-X.
Das, A., Vidyadhar, A., Mehrotra, S.P., 2009. A novel flowsheet for the recovery of
metal values from waste printed circuit boards. Resour. Conserv. Recycl. 53 (8),
464–469, http://dx.doi.org/10.1016/j.resconrec.2009.03.008.
Desjardins, J., 2014. Global Gold Mine and Deposit Rankings 2013, Retrieved May
18, 2016, from http://www.visualcapitalist.com/global-gold-mine-and-
deposit-rankings-2013/.
Duan, C., Wen, X., Shi, C., Zhao, Y., Wen, B., He, Y., 2009. Recovery of metals from
waste printed circuit boards by a mechanical method using a water medium. J.
Hazard. Mater. 166 (1), 478–482, http://dx.doi.org/10.1016/j.jhazmat.2008.11.
060.
Electronics TakeBack Coalition, 2014. Facts and Figures on E-Waste and Recycling.
Ely, C., 2014. The Life Expectancy of Electronics, Retrieved May 6, 2016, from
http://www.cta.tech/Blog/Articles/2014/September/The-Life-Expectancy-of-
Electronics.
Gaidajis, G., Angelakoglou, K., Aktsoglou, D., 2010. E-waste: environmental
problems and current management. J. Eng. Sci. Technol. Rev. 3 (1), 193–199,
Retrieved from http://www.researchgate.net/publication/49607064 E-waste
Environmental Problems and Current Management.
Garlapati, V.K., 2016. E-waste in India and developed countries: management,
recycling, business and biotechnological initiatives. Renew. Sustain. Energy
Rev. 54, 874–881, http://dx.doi.org/10.1016/j.rser.2015.10.106.
Gartner, 2014. Gartner Says Smartphone Sales Surpassed One Billion Units in 2014,
Retrieved May 6, 2016, from http://www.gartner.com/newsroom/id/2996817.
Golev, A., Schmeda-Lopez, D.R., Smart, S.K., Corder, G.D., McFarland, E.W., 2016.
Where next on e-waste in Australia? Waste Manag. 58, 348–358, http://dx.doi.
org/10.1016/j.wasman.2016.09.025.
Gough, M., 2016. Australian Laws Lag on Electronic Waste Management, Retrieved
November 1, 2016, from http://newsroom.unsw.edu.au/news/science-tech/
australian-laws-lag-electronic-waste-management.
Grossman, E., 2016. GPS Tracking Devices Catch Major U.S. Recyclers Exporting
Toxic E-Waste, Retrieved November 1, 2016, from https://theintercept.com/
2016/05/10/gps-tracking-devices-catch-major-u-s-recyclers-in-improper-e-
waste-exports/.
Heacock, M., Kelly, C.B., Asante, K.A., Birnbaum, L.S., Bergman, Å.L., Bruné, M.-N.,
et al., 2015. E-waste and harm to vulnerable populations: a growing global
problem. Environ. Health Perspect. 124 (5), http://dx.doi.org/10.1289/ehp.
1509699.
Investing News Network, 2016. World-Class Copper Deposits, Retrieved May 18,
2016, from http://investingnews.com/daily/resource-investing/base-metals-
investing/copper-investing/what-makes-a-world-class-copper-deposit/.
Kellner, R., 2008. Integrated approach to e-waste recycling. In: Electronic Waste
Management. Royal Society of Chemistry, Cambridge, pp. 111–160, http://dx.
doi.org/10.1039/9781847559197-00111.
Khaliq, A., Rhamdhani, M., Brooks, G., Masood, S., 2014. Metal extraction processes
for electronic waste and existing industrial routes: a review and Australian
11. 42 A. Kumar et al. / Resources, Conservation and Recycling 122 (2017) 32–42
perspective. Resources 3 (1), 152–179, http://dx.doi.org/10.3390/
resources3010152.
Lèbre, É., Corder, G., 2015. Integrating industrial ecology thinking into the
management of mining waste. Resources 4 (4), 765–786, http://dx.doi.org/10.
3390/resources4040765.
Li, J., Zeng, X., Chen, M., Ogunseitan, O.A., Stevels, A., 2015. Control-Alt-Delete:
rebooting solutions for the e-waste problem. Environ. Sci. Technol. 49 (12),
7095–7108, http://dx.doi.org/10.1021/acs.est.5b00449.
McLeod, C., 2014. Top Primary Silver Miners Facing Declining Ore Grades,
Retrieved May 18, 2016, from http://investingnews.com/daily/resource-
investing/precious-metals-investing/silver-investing/top-primary-silver-
miners-facing-declining-ore-grades/.
Miller, T.R., Duan, H., Gregory, J., Kahhat, R., Kirchain, R., 2016. Quantifying
domestic used electronics flows using a combination of material flow
methodologies: a US case study. Environ. Sci. Technol. 50 (11), 5711–5719,
http://dx.doi.org/10.1021/acs.est.6b00079.
Namias, J., 2013. The Future of Electronic Waste Recycling in the United States:
Obstacles and Domestic Solutions. Columbia University, New York, United
States.
Robinson, B.H., 2009. E-waste: an assessment of global production and
environmental impacts. Sci. Total Environ. 408 (2), 183–191, http://dx.doi.org/
10.1016/j.scitotenv.2009.09.044.
Schubert, G., Hoberg, H., 1997. Comminution Techniques for the Recycling of
Wastes. Society for Mining, Metallurgy and Exploration, Inc., Littleton, CO
(United States).
Scruggs, C.E., Nimpuno, N., Moore, R.B.B., 2016. Improving information flow on
chemicals in electronic products and E-waste to minimize negative
consequences for health and the environment. Resour. Conserv. Recycl. 113,
149–164, http://dx.doi.org/10.1016/j.resconrec.2016.06.009.
Singh, N., Li, J., Zeng, X., 2016. Global responses for recycling waste CRTs in e-waste.
Waste Manag. 57, 187–197, http://dx.doi.org/10.1016/j.wasman.2016.03.013.
Statista, 2016. Statistics and Facts About the Home Appliance Industry, Retrieved
May 6, 2016, from http://www.statista.com/topics/1068/home-appliances/.
StatisticBrain, 2015. Physical Technology, Retrieved May 6, 2016, from http://
www.statisticbrain.com/physical-technology.
Step Initiative, 2014. One Global Definition of E-Waste. United Nations University,
Bonn, Germany, Retrieved from http://www.step-initiative.org/files/step/
documents/StEP WP OneGlobalDefinitionofE-waste 20140603 amended.pdf.
The European Commission, 2012. Directive 2012/19/EU, Retrieved from http://eur-
lex.europa.eu/LexUriServ/LexUriServ.
do?uri=OJ:L:2012:197:0038:0071:en:PDF.
Tran, H.P., Wang, F., Dewulf, J., Huynh, T.-H., Schaubroeck, T., 2016. Estimation of
the unregistered inflow of electrical and electronic equipment to a domestic
market: a case study on televisions in vietnam. Environ. Sci. Technol. 50 (5),
2424–2433, http://dx.doi.org/10.1021/acs.est.5b01388.
Van Eygen, E., De Meester, S., Tran, H.P., Dewulf, J., 2016. Resource savings by urban
mining: the case of desktop and laptop computers in Belgium. Resour. Conserv.
Recycl. 107, 53–64, http://dx.doi.org/10.1016/j.resconrec.2015.10.032.
Veit, H.M., Juchneski, N.C. de F., Scherer, J., 2014. Use of gravity separation in
metals concentration from printed circuit board scraps. Rem Revista Escola de
Minas 67 (1), 73–79, http://dx.doi.org/10.1590/S0370-44672014000100011.
Velis, C., Mavropoulos, A., 2016. Unsound waste management and public health:
the neglected link? Waste Manag. Res. 34 (4), 277–279, http://dx.doi.org/10.
1177/0734242X16638632.
Vincic, J., 2015. North American Palladium Announces Year End 2014 Results,
Retrieved May 18, 2016, from http://www.napalladium.com/investors/news-
releases/news-release-details/2015/North-American-Palladium-Announces-
Year-End-2014-Results/default.aspx.
Weckend, S., Wade, A., Heath, G., 2016. End-of-Life Management: Solar
Photovoltaic Panels.
Widmer, R., Oswald-Krapf, H., Sinha-Khetriwal, D., Schnellmann, M., Böni, H., 2005.
Global perspectives on e-waste. Environ. Impact Assess. Rev. 25 (5), 436–458,
http://dx.doi.org/10.1016/j.eiar.2005.04.001.
World bank, 2014. World Bank Data, Retrieved January 1, 2015, from http://data.
worldbank.org/.
WorldLoop, 2013. Illegal Flows, Retrieved June 9, 2016, from http://worldloop.org/
e-waste/illegal-flows/.
Yoshida, A., Terazono, A., Ballesteros, F.C., Nguyen, D.-Q., Sukandar, S., Kojima, M.,
Sakata, S., 2016. E-waste recycling processes in Indonesia, the Philippines, and
Vietnam: a case study of cathode ray tube TVs and monitors. Resour. Conserv.
Recycl. 106, 48–58, http://dx.doi.org/10.1016/j.resconrec.2015.10.020.
Zeng, X., Gong, R., Chen, W.-Q., Li, J., 2016. Uncovering the recycling potential of
New WEEE in China. Environ. Sci. Technol. 50 (3), 1347–1358, http://dx.doi.
org/10.1021/acs.est.5b05446.
Zeng, X., Yang, C., Chiang, J.F., Li, J., 2017. Innovating e-waste management: from
macroscopic to microscopic scales. Sci. Total Environ. 575, 1–5, http://dx.doi.
org/10.1016/j.scitotenv.2016.09.078.