
Recommended
Recommended
More Related Content
What's hot
What's hot (20)
Similar to Evolution of MPO Planning in Florida: 1997-2008
Similar to Evolution of MPO Planning in Florida: 1997-2008 (20)
Recently uploaded
Recently uploaded (20)
Evolution of MPO Planning in Florida: 1997-2008
- 1. Alexander Bond and Jeff Kramer 1 1 Evolution of MPO Long Range Transportation Plans in Florida: 2 1997-2008 3 4 5 Submission Date: 11/5/2009 6 7 Word Count: 5,623 (5,373 in text, 1figure) 8 9 10 11 Corresponding Author: 12 Alexander Bond, AICP 13 Center for Urban Transportation Research 14 University of South Florida 15 4202 E. Fowler Ave, CUT 100 16 Tampa, FL 33620-5375 17 (813) 974-9779 18 Fax: (813) 974-5168 19 ALBond@cutr.usf.edu 20 21 Jeff Kramer, AICP 22 Center for Urban Transportation Research 23 University of South Florida 24 4202 E. Fowler Ave, CUT 100 25 Tampa, FL 33620-5375 26 (813) 974-1397 27 Fax: (813) 974-5168 28 Kramer@cutr.usf.edu 29
- 2. Alexander Bond and Jeff Kramer 2 1 ABSTRACT 2 Every five years, the Florida MPO Advisory Council undertakes a review of all metropolitan planning 3 organization long range transportation plans (LRTP) in the state. The purpose of the review is to identify 4 trends in planning practice and locate areas of potential improvement. This paper documents the review 5 of LRTPs undertaken in 2008, and contrasts the results with those collected over the two previous 6 planning cycles. Florida’s MPOs made great strides with their LRTPs during the last plan cycle. Plan 7 documents are better organized, more descriptive, and more accessible to the general public. Public 8 involvement, intergovernmental coordination, and multimodalism have also advanced significantly. 9 There has been mixed success at adjustment to changes brought from the outside, such as the 10 implementation of the Efficient Transportation Decision Making process (ETDM), increasingly common 11 toll facilities, and increased emphasis on freight movement. While progress is clearly being made each 12 planning cycle, a number of areas still show room for improvement. Most of the improvements needed 13 surround better documentation of how projects advance through the planning process. Public 14 involvement was generally well-executed, but it was often not documented how the public’s input 15 impacted the LRTP or the projects included. Additional planning focus is needed on freight and the 16 transportation disadvantaged. The paper concludes with a series of suggestions for improved planning 17 during the next LRTP cycle. 18
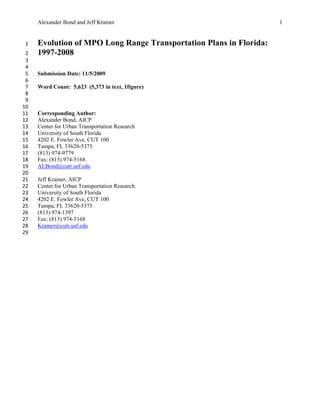
- 3. Alexander Bond and Jeff Kramer 3 1 INTRODUCTION 2 The Safe, Accountable, Flexible, Efficient Transportation Equity Act—A Legacy for Users (SAFETEA- 3 LU) continued the longstanding role of Metropolitan Planning Organizations (MPOs) as the lead agency 4 in the metropolitan transportation planning process. One of the core documents in the metropolitan 5 transportation planning process is the long range transportation plan (LRTP). Federal and Florida statutes 6 and rules require plans to cover at least a twenty-year time horizon. Plans must also be cost-feasible, 7 which is defined as containing only projects that can be funded with reasonably expected revenue sources 8 over the life of the document. 9 Every five years, the Florida MPO Advisory Council (MPOAC) and the Florida Department of 10 Transportation (FDOT) asks the Center for Urban Transportation Research (CUTR) at the University of 11 South Florida to review the LRTPs of MPOs in the state of Florida. The studies are timed so that a new 12 plan update will have been adopted by each MPO prior to each study cycle. The latest study, completed 13 October 2008, was the third study in the series. Due to the number of reviews performed over the last 14 decade, the research team is afforded a particularly good view of the evolution of MPO planning practice 15 in the state. 16 The primary purpose of the plan review is to identify trends of planning practice and help MPOs 17 compare themselves to their peers. The MPOAC also hopes to standardize planning and reporting 18 practices across Florida. A report was issued that made specific recommendations for improvement, but 19 this paper focuses only on current conditions and trends in MPO practice. 20 21 MPO Background 22 An MPO is a regional transportation infrastructure planning agency. The Federal government requires 23 MPOs to perform transportation planning in all areas with more than 50,000 people. Agency operations 24 and policy are directed by a board of local elected and appointed officials. 25 MPOs were first established as they are known today by the Federal Aid Highway Act of 1973. 26 They were established in response to an outcry from local governments about of the lack of a local voice 27 in the route choices of major Federal-aid freeways, such as the Interstate Highway System (1). 28 Many MPO plans share a similar structure. The typical plan begins with a statement of guiding 29 principles, goals, and objectives. This policy guidance helps define the next section, which is an analysis 30 of needs. Often, the MPO will use a travel demand model to help estimate future demand. Most MPOs 31 look at the existing network, demographic trends, and projected demand to establish a pool of needed 32 projects. Many MPOs publish an official “need plan,” but this is not a requirement of Federal law. The 33 needs pool is compiled without regard to project cost, and it represents the MPO’s “wish list” if money 34 for transportation projects was unlimited. However, the needs list is usually screened for projects that 35 may violate National Environmental Protection Act (NEPA) standards, civil rights, Environmental Justice 36 standards, or damage historic and cultural resources. 37 The projects identified by the MPO in the LRTP do not have a construction timeframe. The MPO 38 selects projects from the LRTP for inclusion in a Transportation Improvement Program (TIP) which 39 covers a four to five year timeframe. The projects in the MPO TIP must be included in the State 40 Transportation Improvement Program (STIP), providing MPOs with a level of control over the 41 transportation projects built in their region using federal funds. 42 Over time, the role of MPOs has expanded to include important issues like protection of civil 43 rights, preservation of cultural resources, safety controls, proactive enforcement of NEPA provisions, and 44 control of air pollution under the Clean Air Act. Failure to establish an MPO or execute the prescribed 45 planning program will result in a withholding of federal highway and transit dollars for that region (2). 46 47 MPOs in Florida 48 There are twenty-six MPOs in Florida, some alternately known as Transportation Planning Organizations 49 (TPO), Transportation Planning Agencies (TPA), Metropolitan Transportation Planning Organizations 50 (MTPO) or having unique names like METROPLAN Orlando. Florida has twenty-six MPOs, the 51 highest in the nation. Many of Florida’s MPOs are organized around entire counties. Today, Florida’s
- 4. Alexander Bond and Jeff Kramer 4 1 MPOs cover about 47% of the state’s land area and approximately 93% of the population. Figure 1 2 shows the planning area boundaries of MPOs in the state. 3 4 5 FIGURE 1 MPOs in Florida. 6 7 METHODOLOGY 8 The most recent review of Florida’s MPO LRTPs began in August 2007. Each MPO in the state was 9 asked to provide a hard copy of their LRTP. The MPOs determined for themselves if they wanted to 10 provide additional summaries, supplemental reports, or electronic copies for review. Plans were reviewed 11 between November 2007 and June 2008. Follow-up information was sought from MPO directors if 12 questions arose during the review. It should be noted that there were only twenty-five LRTP documents 13 to review because the Martin MPO and the St. Lucie County TPO authored a joint plan. 14 SAFETEA-LU and its accompanying rules came into effect between reviews. Although some 15 MPOs had already adopted their LRTP for this cycle prior to the passage of the bill, all MPOs were 16 required to bring their LRTPs into conformity with SAFETEA-LU by July 2007. Many did so through 17 minor amendments, often in the form of a new appendix which did not significantly modify the original 18 LRTP document. 19 20 MPO PRACTICE 21 During the course of reviewing tens of thousands of pages in twenty-five different documents, many 22 generalized observations of current practice became evident. This section details those broad 23 observations, and is interspersed with outstanding examples from individual MPOs. LRTP documents 24 were greatly improved since 2002, and made a substantial leap forward from the first review in 1997(3). 25 Where appropriate, comparisons are made between reviews in 2002 and 1997. 26
- 5. Alexander Bond and Jeff Kramer 5 1 User-Friendliness 2 The most obvious improvements have been in user-friendliness and public involvement. Since the very 3 earliest reviews, MPO documents have always been technically sound—model inputs, outputs, and 4 scenario building were always rated above average. However, the appearance of the document, technical 5 jargon, and lack of thorough explanation made understanding an LRTP a daunting exercise. Plans 6 reviewed in the most recent cycle made great strides in the use of graphical elements, non-technical 7 language, and pleasing document layouts. 8 Many MPOs went to great lengths to explain transportation and planning issues of the region to 9 the lay reader of the LRTP. For example, the Hillsborough County MPO devoted the first several pages 10 of its LRTP to explaining the purpose of the document and how the document can be used by the public. 11 The Pinellas County MPO included a glossary, and the Pasco County MPO provided an acronym guide to 12 help lay people decipher transportation planning jargon. Most MPOs included similar information to 13 make their document easier for the public to read and understand. 14 Seventeen of twenty-five MPOs developed a summary document such as an executive summary 15 or hand-out map. The Florida-Alabama TPO, the Bay County TPO, and the Okaloosa-Walton TPO 16 produced outstanding examples of summary documents on glossy, fold-out brochures. These summaries 17 included approximately six pages of text and figures summarizing the document on one side, while the 18 reverse side featured a detailed 34 inch by 22 inch map of the adopted cost feasible projects. 19 About a quarter of the documents were authored by in-house staff, while the remainder were 20 authored by outside consultants. Four consulting firms authored more than one plan. In-house 21 documents tended to have distinctive layouts, custom graphics, and significant text devoted to public 22 involvement efforts. Some plans authored by the same firm shared design elements, methodologies, and 23 even duplicated text. While this did not appear to impact the quality of individual plans this cycle, it 24 signals the potential that unique characteristics of each region could be missed in future cycles. 25 The authors of current LRTPs demonstrated a willingness to discuss the more difficult points of 26 transportation planning. Financial shortfalls, tradeoff analyses, and potential problems are being 27 discussed frankly. In previous years, these issues were largely ignored. 28 The past five years have seen substantial advances in Internet technology. Further, SAFETEA- 29 LU required LRTPs to be available electronically. All twenty-five LRTPs are available on the Internet. 30 Electronic publishing offers much lower costs, wider distribution of documents, and the ability to cross- 31 link with related documents such as the Transportation Improvement Program (TIP). However, over a 32 quarter of MPOs offered their LRTP exclusively over the Internet. This may disadvantage certain 33 segments of the public who do not have computer skills or access to the Internet. 34 35 Public Involvement 36 Common public involvement activities included newsletters, public meetings, charettes, and interviews 37 with community leaders. Nearly all MPOs embraced the trend toward electronic communication by 38 creating Websites dedicated to their plan, offering newsletters over the Internet, and accepting public 39 comments by email. 40 Some examples of innovative public involvement include: 41 42 • Visual Choice Surveys were distributed by the Florida-Alabama TPO, the Okaloosa-Walton TPO, 43 and the Bay County TPO. These surveys presented participants with photographic examples of the 44 options being considered, and asked them to rate their preference. For example, a roadway is shown with 45 a variety of median configurations, bicycle/pedestrian infrastructure, and foliage and participants are 46 asked to select their preferred alternative. 47 • The “Strings and Ribbons” activity employed by the Volusia County MPO and the Ocala/Marion 48 County TPO allowed the MPOs to collect geographic data on the public’s vision for the future and 49 compare it to the one crafted by staff and the MPO advisory committees. Participants were given fixed 50 lengths of string and ribbon which correlate to expected revenue by mode. Participants then designed
- 6. Alexander Bond and Jeff Kramer 6 1 their preferred transportation system by affixing strings to a map of the region. Staff then collected 2 information from the maps and compiled the data to determine public preference. 3 • The Miami-Dade MPO went to great lengths to inform the public in all languages frequently 4 spoken in their region. TV shows, radio segments, documents, and newsletters were distributed in 5 English, Spanish, and Haitian Creole. 6 • The Polk TPO hosted a live call-in television show to discuss the LRTP. 7 8 Although MPOs are employing an array of public involvement techniques, many LRTP 9 documents failed to document how information gained during the public participation process influenced 10 the outcome of the LRTP document. Public involvement, although well executed, seemed to sometimes 11 be regarded as a stand-alone task in the LRTP drafting process. 12 There were notable exceptions to this observation that provide guidance on how to link data 13 collected through the public involvement process with the final cost-feasible plan. The Indian River 14 County MPO used public opinion information to assign increased weight to certain criteria for selecting 15 cost feasible projects. The Volusia County MPO’s “Strings and Ribbons” activity established that the 16 public preferred eighty-two percent of transportation revenue be expended on roadways, which was used 17 as a benchmark later in the document. Further, a “Citizens Alternative” showing the top thirty most 18 popular improvements based on the results of the “Strings and Ribbons” exercise was compared with 19 technical alternatives derived from the travel demand model and used to refine the final cost feasible plan. 20 MPOs continue to struggle with poor public understanding of their mission and work products. 21 Several MPOs attempted to “brand” their agency with logos, slogans, and name changes that capture the 22 public’s attention. The Sarasota/Manatee MPO found that only fifty percent of surveyed stakeholders 23 were familiar with the agency, and this was considered a high figure. Some observed branding efforts 24 included coordinated logo and color schemes, descriptive agency names, and thoughtful design of public 25 involvement materials. Another type of branding was a more user-friendly name for the LRTP and the 26 drafting process. For example, METROPLAN Orlando named their project and plan “Community 27 Connections- A Transportation Vision for the Next 25 Years,” which effectively described the purpose of 28 the document to the general public. 29 30 Efficient Transportation Decision Making 31 In 2001, the Florida Department of Transportation deployed the Efficient Transportation Decision 32 Making (ETDM) information management system. This system integrates information from a variety of 33 agencies, provides opportunities for other agencies to monitor the activities of others, and provides a 34 central point of contact for comments. The ETDM system allows a proposed transportation project to be 35 screened using existing environmental and cultural datasets to uncover potential violations of NEPA, civil 36 rights, or historic/cultural preservation laws. This streamlines the review process and “pre-clears” 37 projects for inclusion in plans and programs, including those produced by MPOs. The ETDM system also 38 includes a comment system for the general public and resource agencies (Environmental Protection, Fish 39 & Game, Historic Preservation, Elder Affairs, etc) to enter comments relating to transportation projects 40 and actions. 41 The ETDM process has proven to be an effective tool for identifying potential environmental 42 impacts, given the broad participation of a number of federal and state resource agencies. However, 43 overreliance on the ETDM process to identify cultural and community impacts creates the potential to 44 overlook issues that are not typically within the purview of those agencies. Therefore, ETDM does not 45 fully substitute for a thorough study of local conditions by the MPO. Because ETDM relies on input from 46 other agencies and outside groups, any comments received may not capture issues of a local nature or be 47 consistent enough to influence the outcome of the plan. 48 Even though the overall trend was toward relying on ETDM, there were some excellent examples 49 of local community impact analysis. The Capital Region TPA demonstrated attention to community 50 impacts by inventorying and categorizing so-called “canopy roads,” where mature oak trees shade the 51 street. These roadways were considered policy constrained during the project selection process and thus
- 7. Alexander Bond and Jeff Kramer 7 1 excluded from the cost feasible plan. The Gainesville MTPO eliminated all projects that would impact a 2 park or recreation area. It is unlikely that canopy roadways or park resources would have been identified 3 in the typical ETDM process, yet through the MPOs’ efforts, local cultural assets were preserved. 4 Another potential unintended consequence of relying too heavily on ETDM is the reduction of the 5 MPOs capacity to independently participate in the ETDM process as a resource agency. MPOs that do 6 not collect their own sociocultural data will not have unique information to supply to the ETDM process 7 when other agencies propose projects. For example, if a toll authority proposes a project, an MPO that 8 does not maintain its own sociocultural data set may find itself incapable of alerting the toll authority of 9 the project’s potential impact on local community or cultural resources. 10 11 Freight and Economic Competitiveness 12 Many MPOs considered freight movement to be a factor in their area’s transportation system, but few 13 dedicated much space in the LRTP to the subject. Special studies were sometimes noted, but there was 14 little evidence that these studies influenced the outcome of the LRTP. A handful of MPOs established 15 goods movement advisory boards, which offered private sector carriers an important opportunity to 16 furnish information to the agency. Even the modest discussion of freight is a big improvement, since 17 previous plans usually did not discuss freight at all. 18 Most MPOs catalogued the location of major goods movement hubs like ports, airports, and 19 freight rail intermodal centers. Some discussed the locations of major employers and goods distribution 20 centers. Some used freight benefits as a project selection criterion. The Indian River County MPO 21 analyzed the goods movement performance of the proposed system between adoption of the needs plan 22 and the cost feasible plan. It produced information about the volume to capacity ratio of goods movement 23 thoroughfares and intermodal access roads. 24 25 Non-Highway Modes 26 Planning for alternative modes has made great strides since 1997 and 2002. Though highway projects 27 still dominate the needs and cost-feasible plans of MPOs, this plan cycle saw a substantial improvement 28 in efforts to incorporate alternative modes of transportation. Bicycle and pedestrian facility planning has 29 become commonplace, and was usually considered in a process similar–or even alongside–roadway 30 facilities. Transit planning was not as mature, but showed significant improvement. 31 32 Bicycle and Pedestrian 33 There was a strong commitment to bicycle and pedestrian planning evident in almost all LRTPs. Nearly 34 all documents recognized bicycle and pedestrian facilities as a needed form of transportation 35 infrastructure. Further, bicycle lane and sidewalk costs were almost universally included in the 36 calculation of construction costs. This makes it much more likely that new roadways and widenings will 37 have bicycle and pedestrian facilities. 38 Bicycle/pedestrian and transit infrastructure investments were sometimes planned for using the 39 boxed funds method. Under this method, the LRTP often commits to spending a set amount of money per 40 year for the life of the plan, but defers project selection to a later date. Frequently, the LRTP defers 41 project selection to a separately adopted document such as a bicycle/pedestrian needs assessment or the 42 local transit development plan. A handful of MPOs, such as the Pasco County MPO, charged the Bicycle 43 and Pedestrian Advisory Committee to select and forward to the Governing Board projects they felt 44 should be constructed with each year’s boxed funds. 45 46 Transit 47 Every MPO discussed transit in their plan, and nearly all included at least one transit project in the cost 48 feasible plan. Transit was sometimes separated into its own chapter and had a separate transit cost 49 feasible plan, never bringing transit and other modes together as a unified system. While the higher level 50 of transit consideration is a step forward, separating transit from other modes may hamper the formation 51 of a truly integrated multimodal metropolitan transportation system.
- 8. Alexander Bond and Jeff Kramer 8 1 Many MPOs, primarily in small and medium-sized metropolitan areas, are using an inverted 2 evaluation process to establish cost feasible transit projects. Transit revenues are being estimated before 3 needed projects are selected. Therefore, needed but unfunded transit projects are never identified. By 4 treating transit needs differently than highway needs, these MPOs are likely underestimating their overall 5 system needs. In some cases, this inverted evaluation process is attributable to the influence of the local 6 transit development plan (TDP). Some MPOs merely copied the transit needs analysis from the TDP, 7 which does not use the same planning process or timeline as the MPO. 8 9 Intelligent Transportation Systems 10 Nearly all MPOs documented the operational status of ITS architecture and operation in their region. In 11 areas where the ITS system was not fully operational, LRTPs frequently included these projects alongside 12 roadway and transit improvements in the cost feasible plan. The boxed funds method was frequently 13 encountered. In areas where ITS is currently running, many MPOs planned for the operation of the 14 system. Intelligent Transportation Systems have become so comprehensive and commonplace that they 15 are even helping to drive decision-making by providing new types of data. 16 Despite the near-universal discussion of ITS, it was treated differently across the state. Many 17 MPOs included ITS operations in their plan, while others did not. Some MPOs linked ITS efforts with 18 congestion management systems (CMS or CMP) or system monitoring. 19 20 Interagency Coordination 21 MPOs are increasingly coordinating with their neighbors, members, and peers to help guide the 22 transportation planning process. While MPOs have always held a role as a regional leader and convener, 23 there was a rise in the number and depth of connections between MPOs and affiliated agencies. It is clear 24 that MPOs are finding these cross-agency relationships to be valuable. Further, the research noted these 25 connections between agencies are becoming more formal and institutionalized. 26 The most common interagency coordination was between the MPO and its constituent local 27 governments. Nearly all MPOs referred to their local governments’ capital improvement programs. 28 School boards, water management districts, Native American tribal governments, military installations, 29 toll authorities, and seaport/airport authorities all have some sort of formalized coordination relationship 30 with their MPO. The Bay County TPO leads a regular transportation roundtable consisting of five of its 31 neighboring rural counties. The Brevard MPO reserves seats on its technical advisory committee for 32 Space Florida (Kennedy Space Center), while the Miami-Dade MPO reserves a seat on its governing 33 board for a school board member. 34 MPOs are looking beyond their borders to enhance coordination with MPOs in their part of the 35 state. Sixteen of Florida’s MPOs have joined one of the four multi-MPO coordinating bodies in the state: 36 37 • West Central Florida MPO Chairs Coordinating Committee (Hernando MPO, Pasco County 38 MPO, Hillsborough County MPO, Pinellas County MPO, Polk TPO, Sarasota/Manatee MPO) 39 • Northwest Florida Regional Transportation Planning Organization (Florida-Alabama TPO, 40 Okaloosa-Walton TPO) 41 • Central Florida MPO Alliance (Brevard MPO, Volusia County MPO, METROPLAN Orlando, 42 Lake-Sumter MPO, Polk TPO, Ocala-Marion County TPO) 43 • Southeast Florida Transportation Council (Palm Beach MPO, Broward MPO, Miami-Dade MPO) 44 45 All of these multi-MPO associations take on the task of jointly approving a list of important 46 regional facilities. In turn, each constituent MPO places a high emphasis on those facilities in the 47 modeling and project selection components of its individual LRTP. The Central Florida MPO Alliance 48 (CFMPOA) and the West Central Florida MPO Chairs Coordinating Committee (CCC) developed 49 regional travel demand models for all of their member MPOs to use.
- 9. Alexander Bond and Jeff Kramer 9 1 MPOs are also collaborating informally with neighboring MPOs. The Martin MPO and the St. 2 Lucie TPO drafted a joint long range transportation plan, the first of its kind in the state. The 3 Sarasota/Manatee MPO and the Charlotte County-Punta Gorda MPO worked closely to develop regional 4 project lists, and shared modeling data and technical information. The Lee County MPO and the Collier 5 MPO worked closely with each other to build a joint travel demand model. 6 Many MPOs seem unsure how to deal with toll facilities, Florida’s Turnpike Enterprise, and toll 7 authorities. Some plans mentioned toll facilities only in passing. Others included detailed descriptions of 8 interactions and joint planning with the local toll authority. Some LRTPs included toll projects in the cost 9 feasible plan, although toll road projects were handled separately from other projects. A few MPOs 10 considered the mention of toll roads to be for informational purposes only. 11 12 Project Selection Criteria 13 Many MPOs did not fully document their methodology for selecting projects to be included in the cost 14 feasible plan. The lack of documentation makes it difficult to determine if the final cost feasible list of 15 projects supports the MPOs long range goals and objectives. 16 One way of achieving internal consistency is through a system of objective project selection 17 criteria, such as a point system, although this method has been declining over time. The Hillsborough 18 County MPO used nine evaluation factors, with each factor carrying a different weight. Alternatively, the 19 First Coast MPO used 13 equally weighted criteria for selecting cost feasible projects, including one that 20 favors hurricane evacuation routes. Most MPOs did not include any discussion on how projects were to 21 be chosen from the cost feasible plan for inclusion in the TIP. 22 23 SUGGESTIONS 24 Based on the results of the review of LRTPs during this planning cycle, and in comparison with those 25 adopted in previous cycles, the following suggestions in planning practice were made to the MPOs of 26 Florida: 27 28 1) MPOs should relate how information gained during public involvement activities was 29 incorporated into the LRTP document and the projects it contains. There were many outstanding 30 examples of public involvement, but readers were generally not shown how the information gained was 31 put to use. Demonstrating the value of public involvement will help ensure that MPOs continue to 32 receive high levels of support for these activities in the future. 33 34 2) MPOs should continue to refine their LRTPs for Internet publication. The publication copy of the 35 plan may need additional formatting to optimize it for Internet posting. Some plans are not published on 36 standard size pages, which complicates the viewing of the document on a standard-sized screen. The 37 Internet can allow plans to contain both standard-size text pages and oversize map pages. Readers can 38 zoom in to view maps in greater detail. 39 40 3) Even though the Internet will be the primary source for LRTP distribution, at least a limited 41 number of documents should be made available in hard copy format. During this review, about a quarter 42 of MPOs did not offer their LRTP in hard copy format. Not all members of the public use the Internet. 43 Having a few hard copies of the LRTP on hand will allow MPOs to fully involve members of the public 44 that do not, or cannot, use a computer. 45 46 4) MPOs should exercise more editorial control over the content of plans authored by consultants, 47 with the aim of crafting a document that is original and customized. MPOs choosing to employ 48 consultants should work closely with their contractors to develop a tailored document that suits their 49 needs. This could include adding language to contract scopes that help meet these goals. Plans authored 50 by the same company sometimes used duplicate text and graphics. While this did not impact plan quality 51 during this past cycle, it has the potential to damage the quality of future documents if the trend continues.
- 10. Alexander Bond and Jeff Kramer 10 1 2 5) Establish transit needs before revenues are analyzed. Many MPOs are doing the exact opposite— 3 establishing revenues before developing needs. When only projects that can be expected to be paid for 4 are identified in the plan, this results in zero unfunded projects. There should be a pool of unfunded 5 transit projects. Further, the transit element is not as fully integrated into the planning process as it could 6 be. 7 8 6) MPOs should demonstrate their expertise in planning for the transportation disadvantaged in the 9 LRTP. This is a growing segment of the transportation system, and is increasingly important in state and 10 federal governing legislation. Most MPOs did not mention transportation disadvantaged programs, yet 11 almost all Florida MPOs currently perform work in this area. Information and analysis gained during 12 other agency activities should be included in the LRTP. Further, a transportation disadvantaged needs 13 analysis may be able to supplement the needs analysis of transit or bicycle/pedestrian planning. 14 15 7) MPOs need to develop a system for dealing with toll facilities. LRTPs showed considerable 16 variation in the treatment of toll facilities and coordination mechanisms with toll agencies. It is currently 17 unclear how these projects should be incorporated into the MPO plan, whether MPOs have any authority 18 over toll facilities, and how toll revenue should be counted in revenue projections. Guidance from 19 FHWA or individual state DOTs would be helpful in this matter. 20 21 8) MPOs should take greater care to demonstrate and document how the projects contained in their 22 cost feasible plan support the adopted goals and objectives of the LRTP. Many LRTPs did not 23 demonstrate internal consistency. The methodology of the LRTP should be designed so that each goal 24 and objective are given due consideration. Projects should be selected based on adopted goals. Without 25 internal consistency, MPOs may be unintentionally impacting the credibility of their plans and processes 26 with the public. 27 28 9) Freight and goods movement should be a more important consideration for MPOs. Freight is an 29 increasingly important topic in planning, and is attracting increasing amounts of federal investment. 30 Obviously MPOs that have a seaport in their planning area need to refocus their efforts on freight. 31 However, goods move through every metropolitan area, not just those with major seaports or freight 32 airports. Major freight corridors need planning attention, as do intra-regional goods movement. 33 34 10) MPOs should publish the process by which projects will be selected from the cost feasible plan 35 for inclusion in the Transportation Improvement Program. By publishing such a system, the general 36 public will have a stronger understanding of the connection between the LRTP and the TIP. Further, 37 stakeholders will better understand the likelihood of their project being included in the TIP. 38 39 11) There remains a broad definition of what constitutes a transportation “need.” Many MPOs did 40 not establish a desired vision for their region. A common result of a lacking vision is an imprecise 41 definition of what kinds of projects are needed, and in what volume. If the region desires transit, then a 42 massive list of roadways is not appropriate. If the region desires to contain sprawl, having a limited- 43 access beltway in the undeveloped part of the region will not be useful. The needed projects list should 44 be trimmed using policy measures that promote a vision for the MPO area’s future.
- 11. Alexander Bond and Jeff Kramer 11 1 CONCLUSIONS 2 Reviewing every LRTP in the state has had several advantages for MPOs in Florida. Several MPOs 3 reported taking to heart the recommendations of previous studies when designing their LRTP documents. 4 Further, all MPOs in the state agreed to a set of financial guidelines that should help standardize the 5 estimation of needs, revenue, and shortfalls across the state. Last, all MPOs have agreed to a common 6 horizon year of the next LRTP cycle, which will help model development and revenue projections. 7 Florida’s MPOs made great strides with their LRTPs during the last plan cycle. Plan documents are 8 better organized, far more descriptive, and more accessible to the general public. Public involvement, 9 intergovernmental coordination, and multimodalism have advanced significantly. There has been mixed 10 success at adjustment to changes brought from the outside, such as the implementation of ETDM, 11 increasingly common toll facilities, and increased emphasis on freight movement. 12 While progress is clearly being made each planning cycle, a number of areas still show room for 13 improvement. Most of the improvements are fairly easily solved by better documenting the MPOs’ 14 internal processes. The LRTP’s goals and objectives need to be closer tied to the list of cost feasible 15 projects. MPOs should be doing a better job demonstrating how public involvement influenced the 16 outcome of the LRTP and the cost feasible plan. Some MPOs need to clearly demonstrate the process for 17 moving projects from the needs list to the cost feasible plan. Finally, the process for moving projects 18 from the plan to the program should be published. All of these items could be accomplished by requiring 19 additional tasks –along with a moderate amount of additional compensation– from consultants who draft 20 many of the LRTPs adopted across the state. 21 The results of this project are useful beyond the boundaries of Florida. It is important for more 22 states to conduct similar reviews to better understand MPO planning practices in their state. It is likely 23 that MPOs across the United States have similar problems and successes with their planning processes. 24 Simply understanding that their peers struggle to address certain issues can help an MPO resolve to 25 improve its planning process. Each iteration of an MPO’s LRTP offers a chance to improve the quality, 26 inclusiveness, and comprehensiveness of the document. Taking the time to understand where the plan 27 falls short–and where it succeeds–can only lead to improved transportation planning. 28
- 12. Alexander Bond and Jeff Kramer 12 1 REFERENCES 2 (1) Solof, Mark. “History of Metropolitan Planning Organizations.” Newark, NJ: North Jersey 3 Transportation Planning Agency. 1998. Available from: 4 http://www.njtpa.org/Pub/Report/hist_mpo/documents/MPOhistory1998_000.pdf 5 (2) Federal Highway Administration/Federal Transit Administration Transportation Planning Capacity 6 Building Program, “The Transportation Planning Process: Key Issues.” Document #FHWA-HEP-07-039. 7 September 2007. Available from: http://www.planning.dot.gov/documents/BriefingBook/bbook_07.pdf 8 (3) Kramer, Jeff, and Edward A. Mierzejewski E. (2003). Innovations in Long-Range Transportation 9 Planning: Observations and Suggestions, Transportation Research Record 1858 1–8