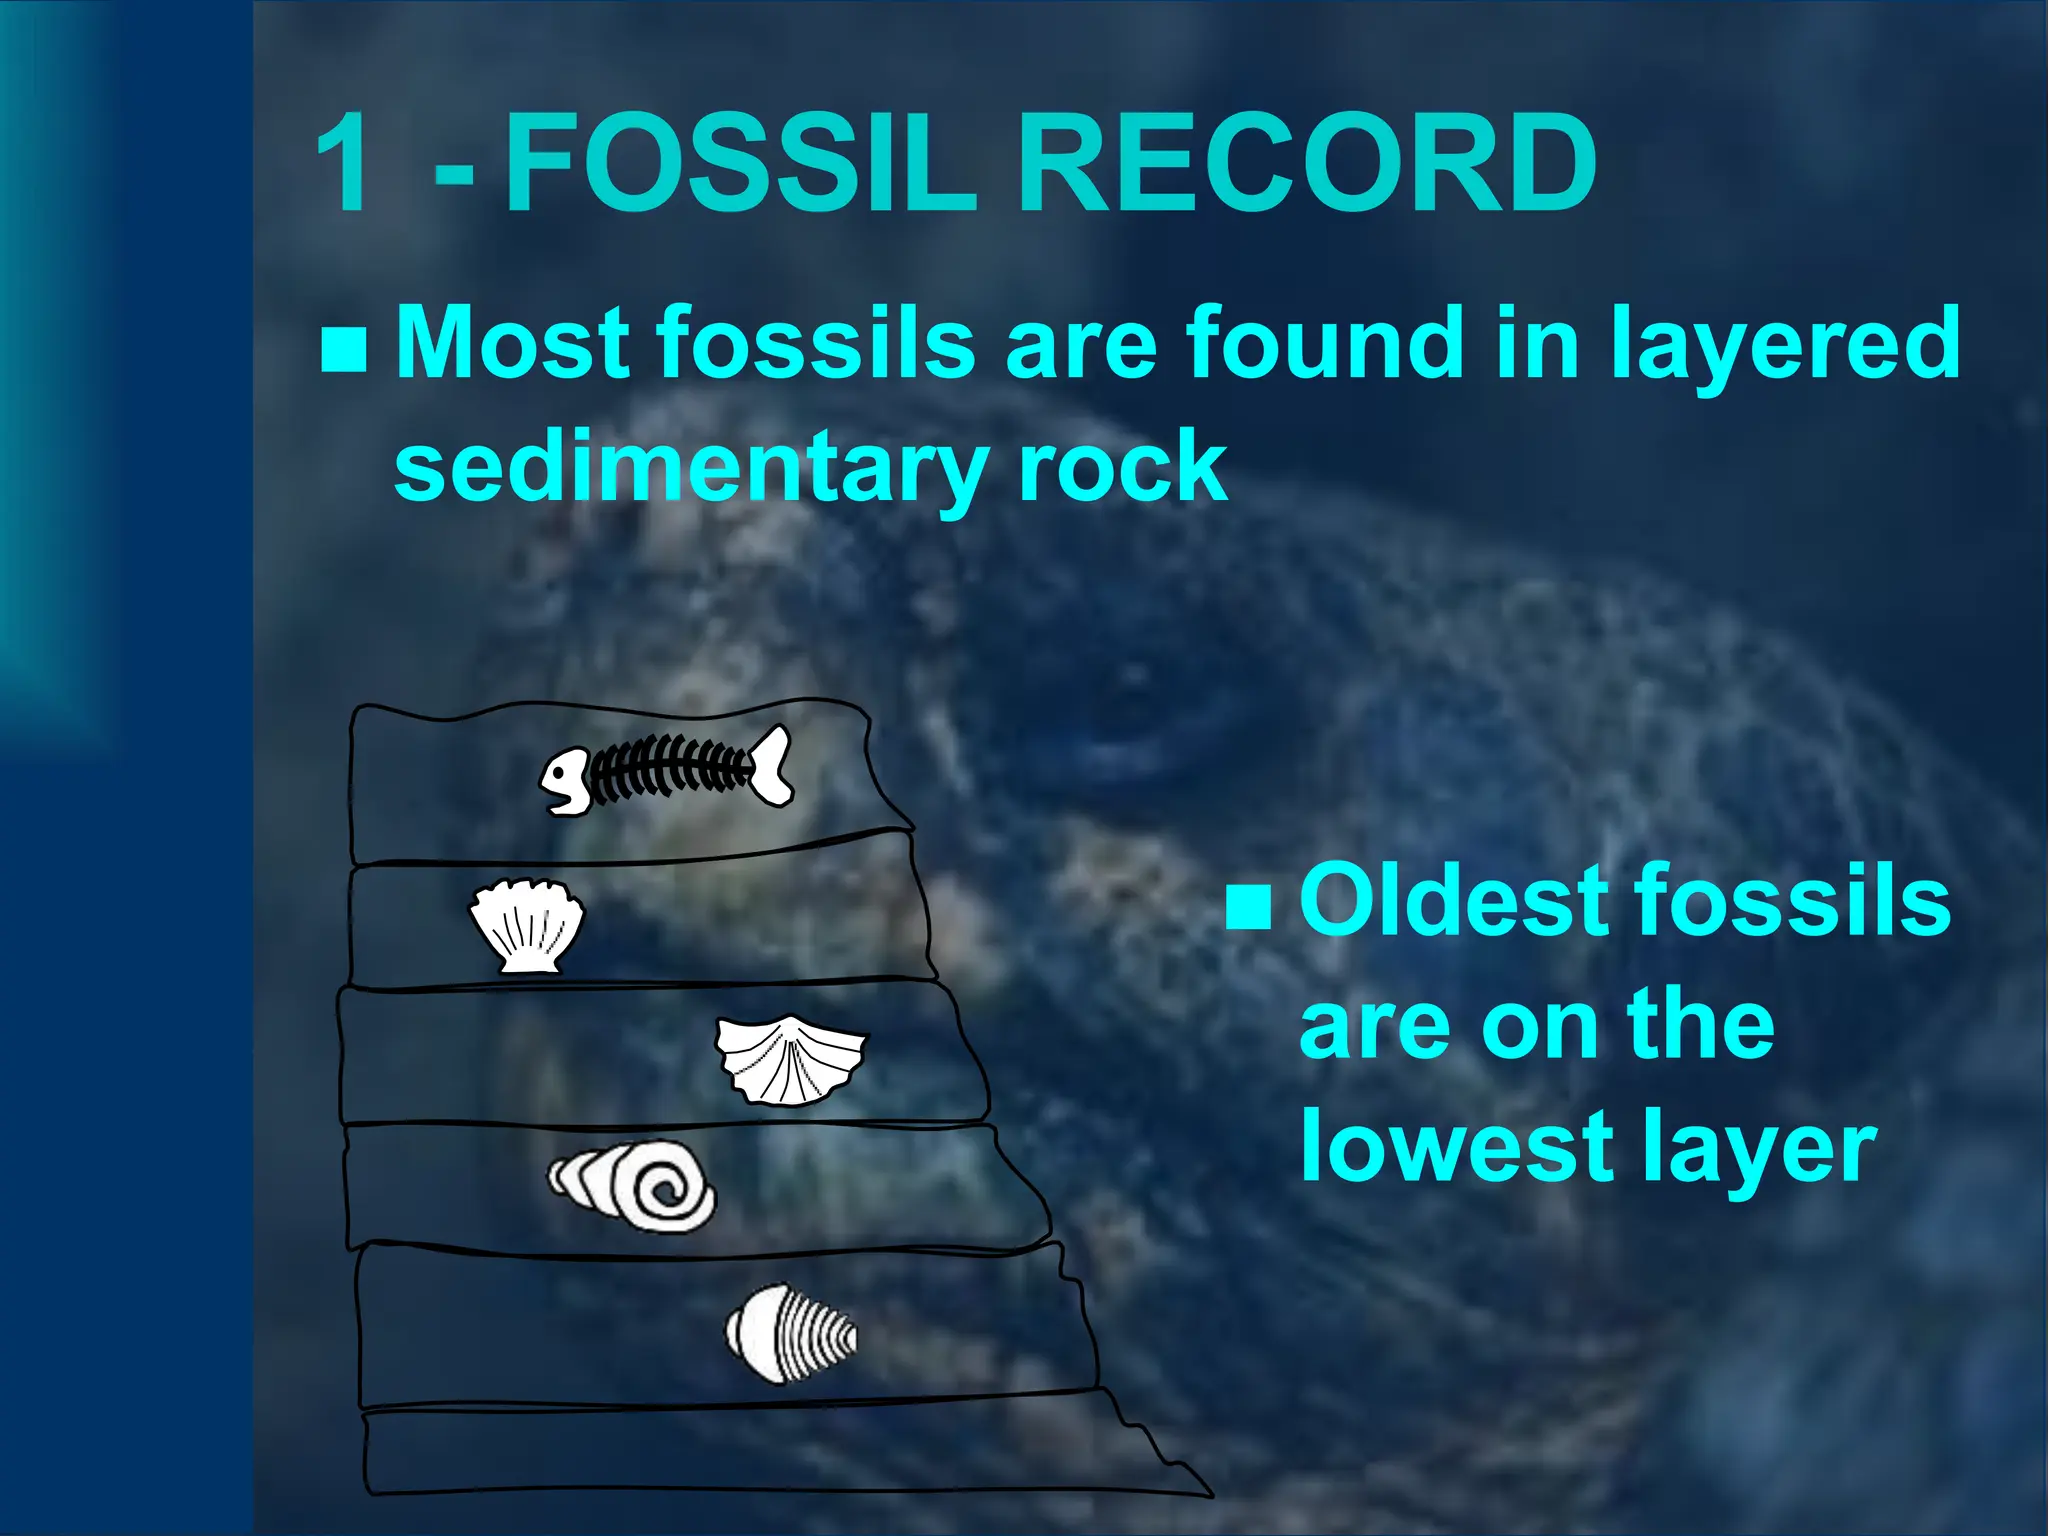
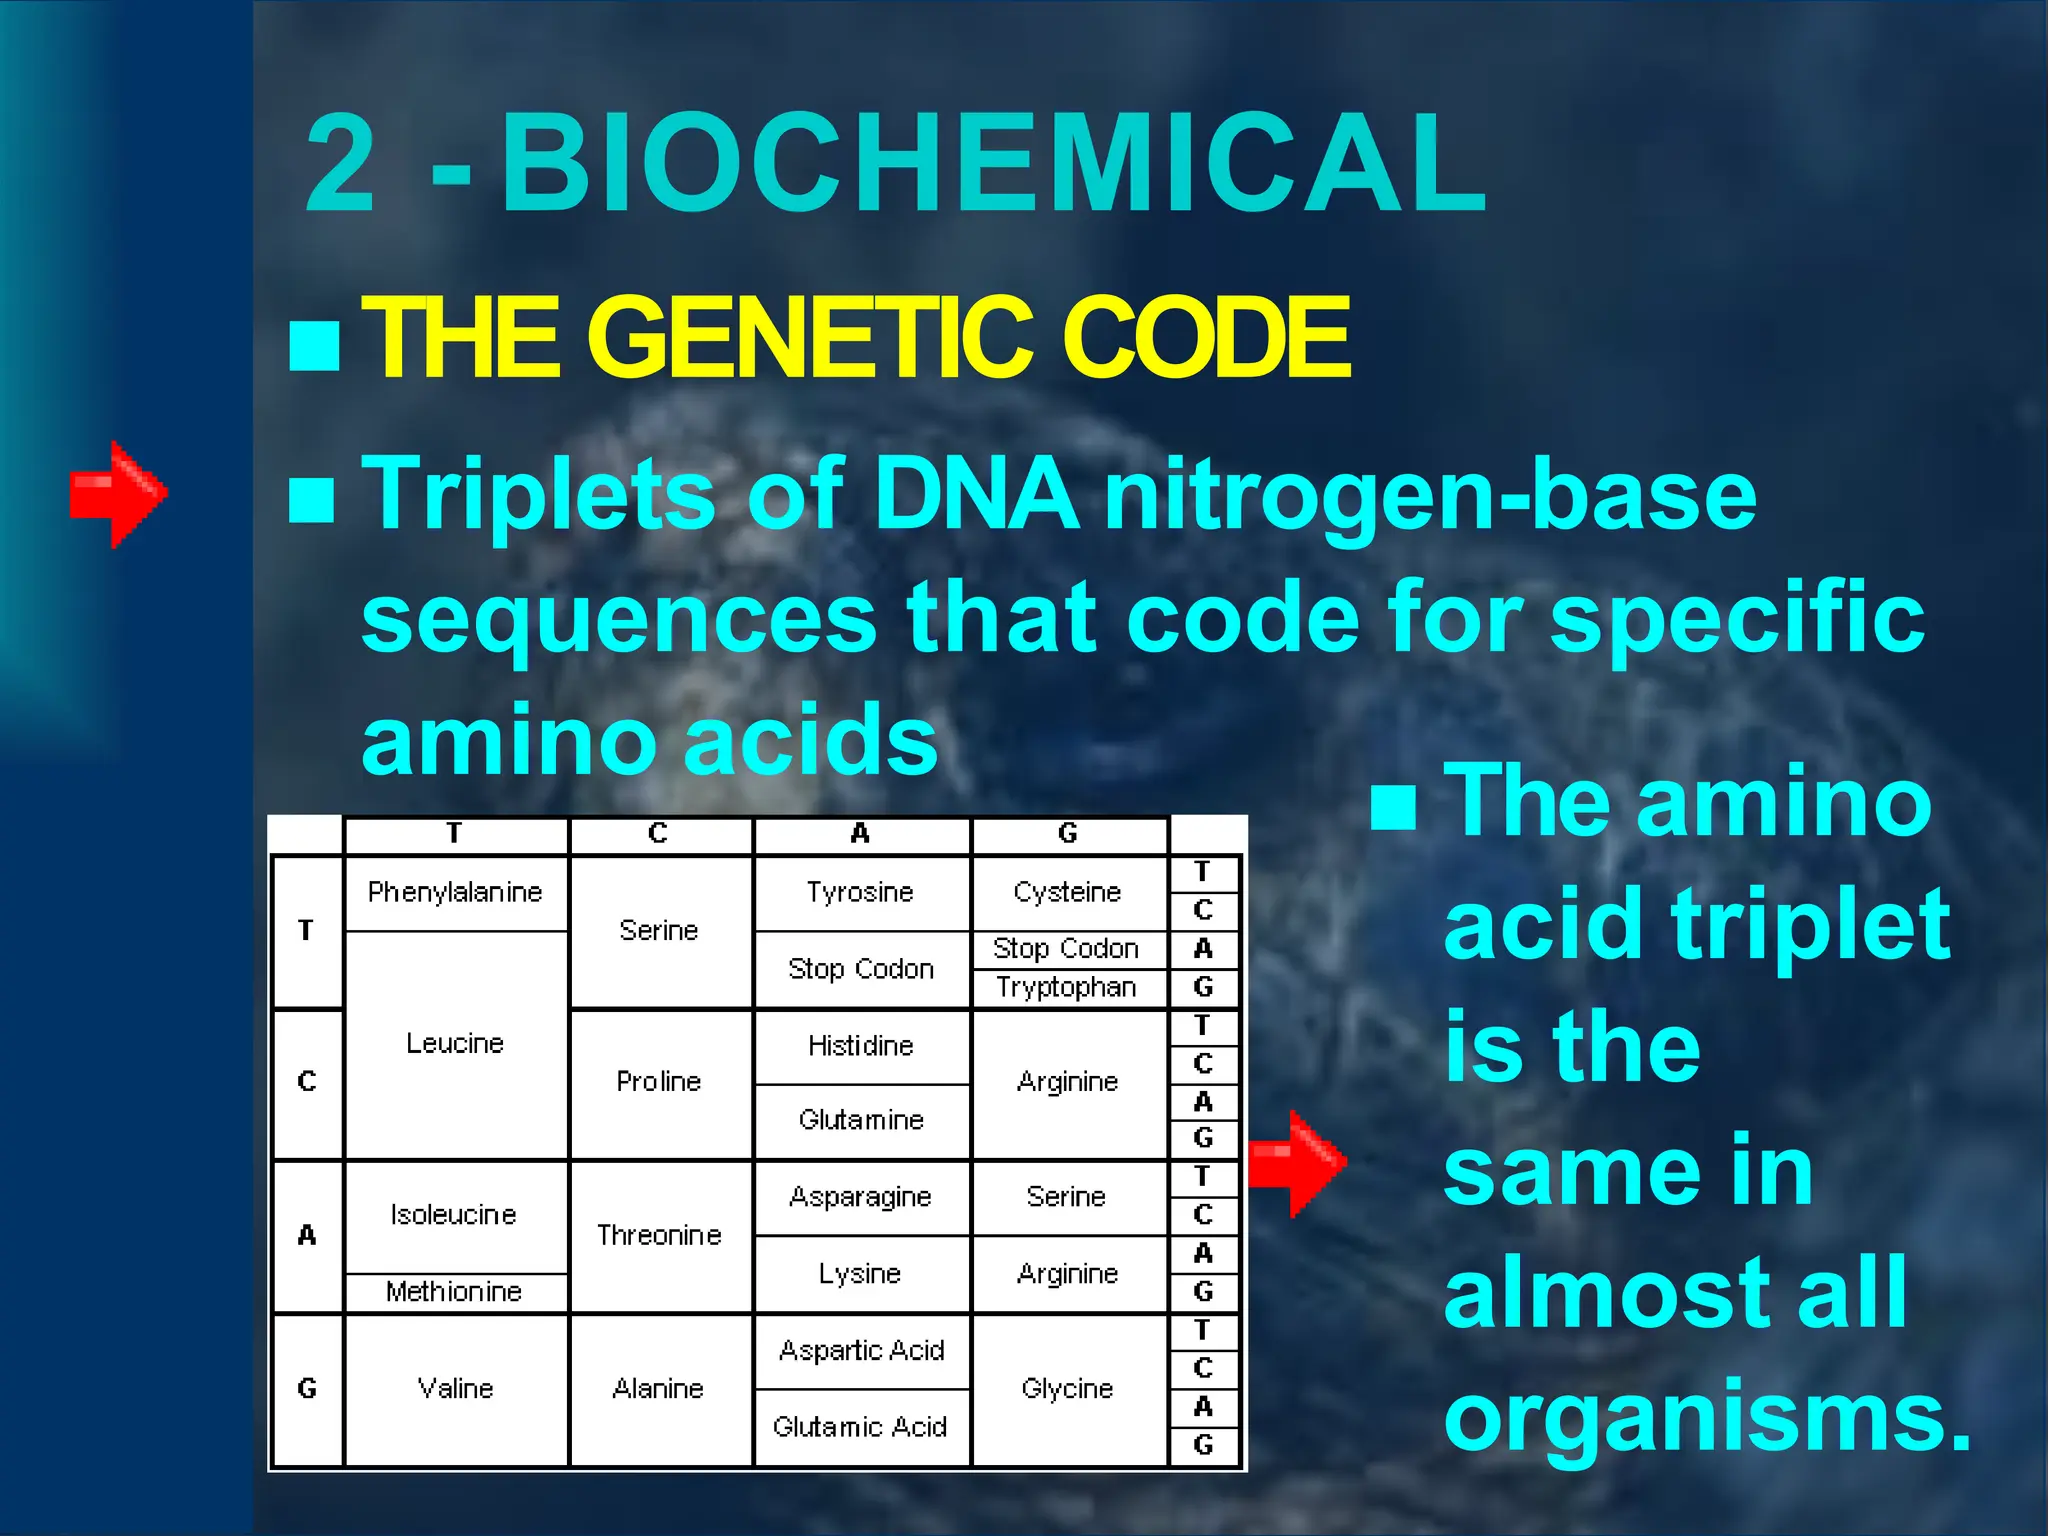
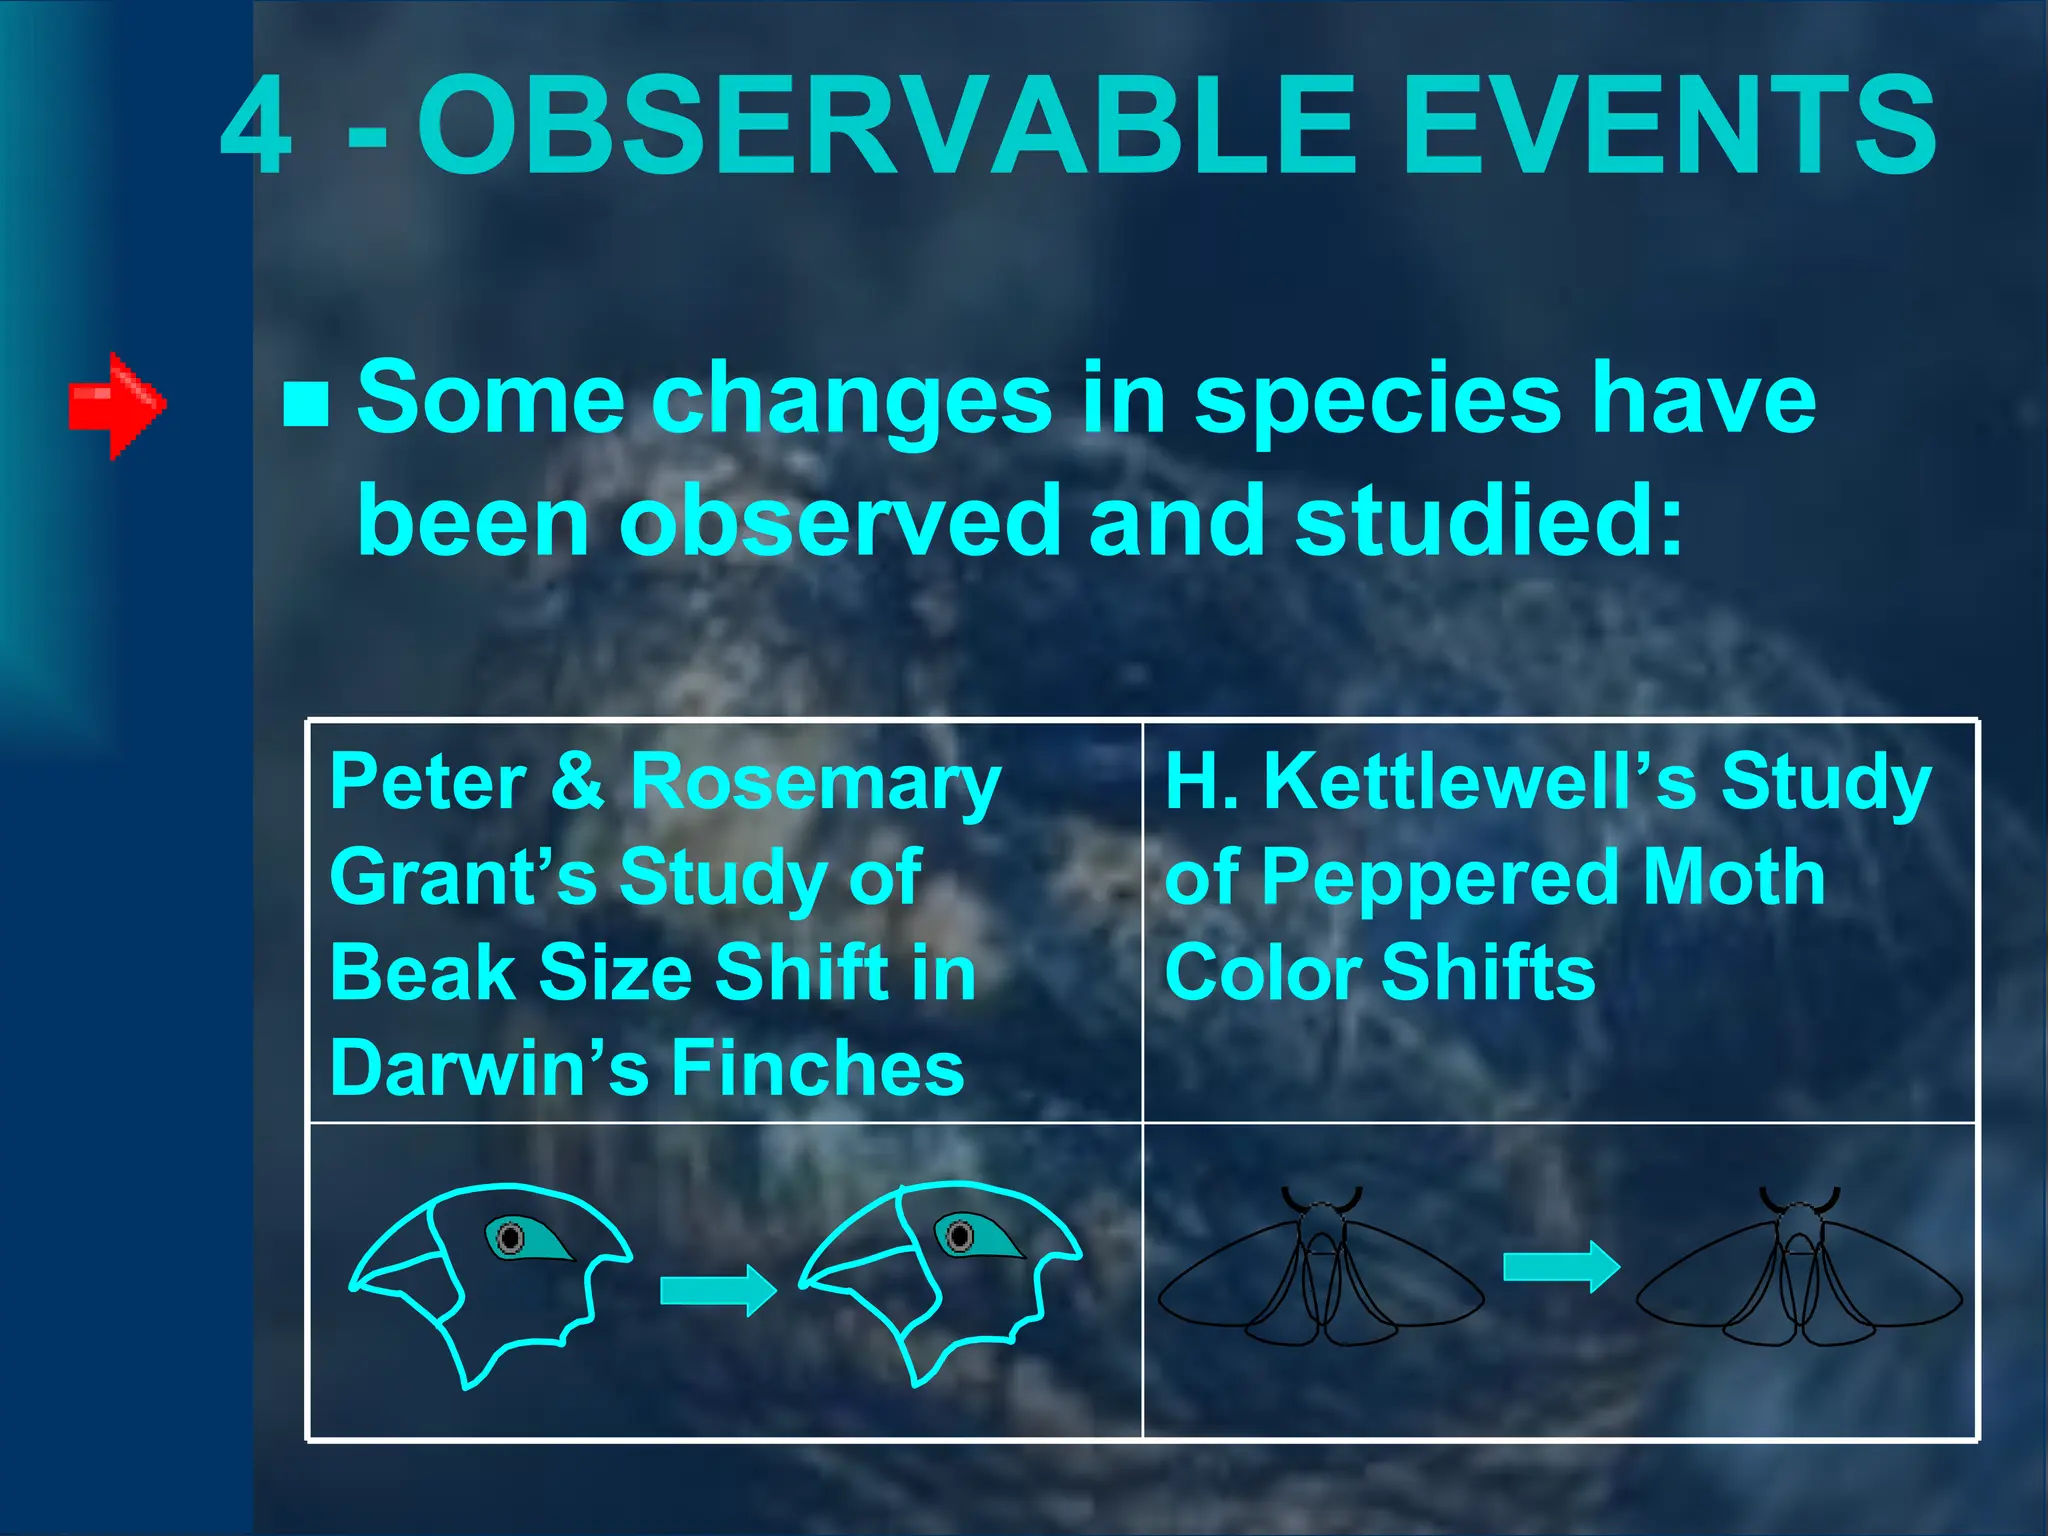
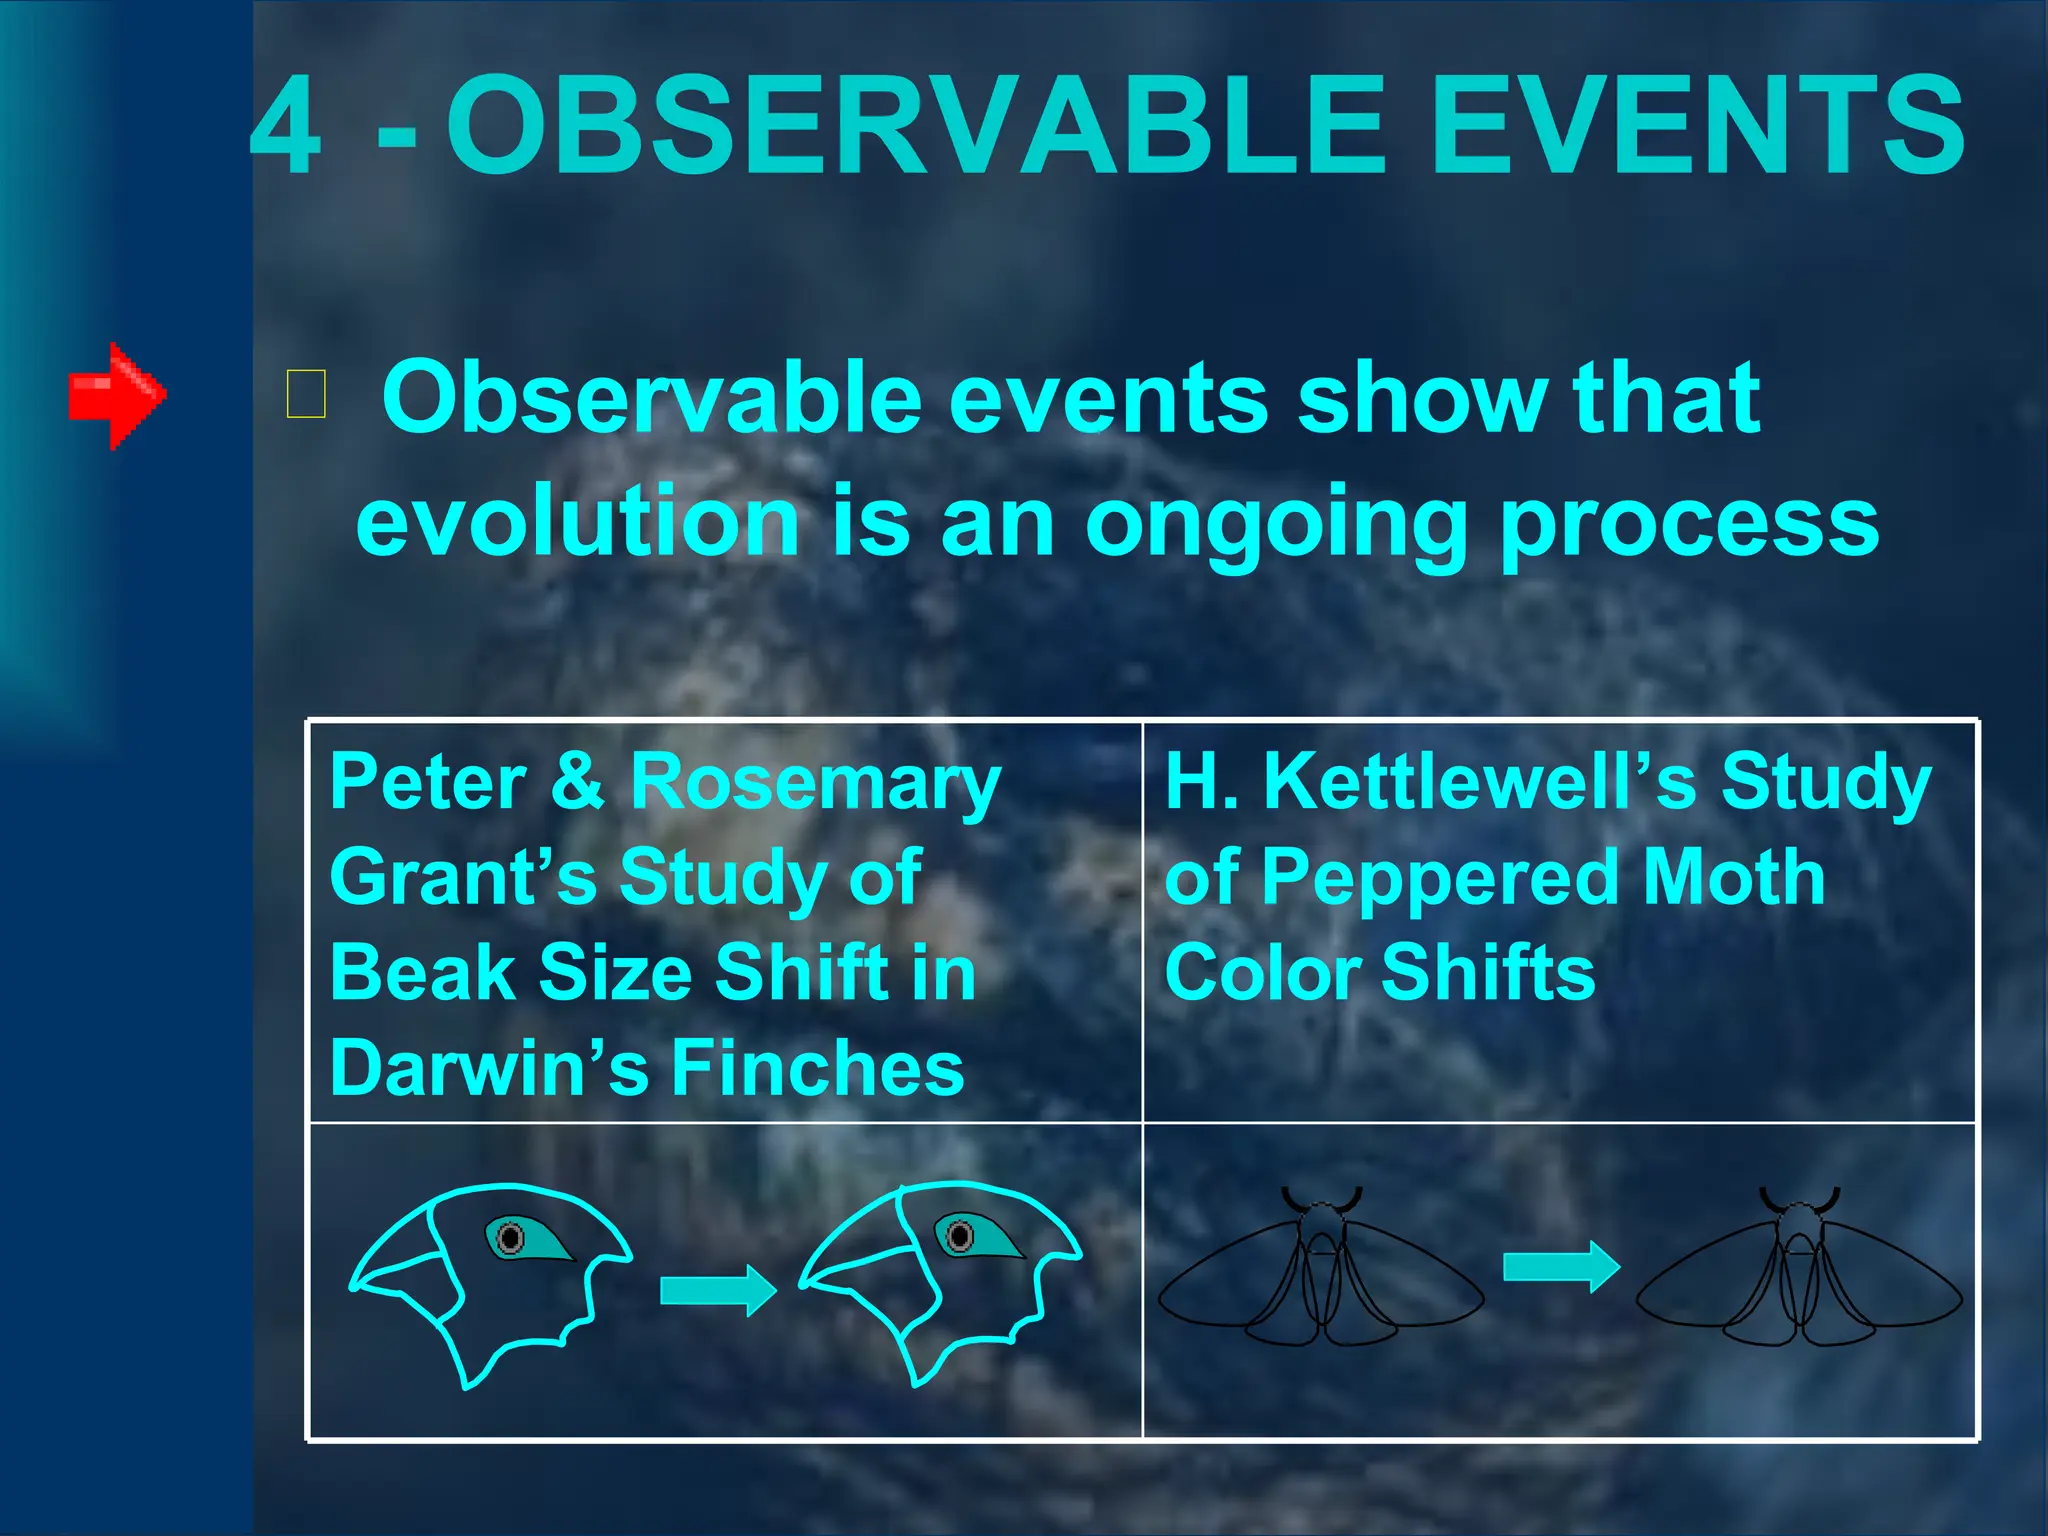
EVIDENCES OF
EVOLUTION
Fossil Record
Biochemical
Comparative Anatomy
Observable Events
EVOLUTION IS
Genetic change in a
population through time.
Charles Darwin
On his journey around the world,
Darwin found evidence of
gradual change (evolution).
Darwin cited
evidences he
found in fossil
records,
geographic
distribution and
homologous
structures.
Evidences of
Evolution
Today most evidences for
evolution are grouped into
four main categories:
 Biochemical
 Fossil Record
 Comparative Anatomy
 Observable Events
1 - FOSSIL RECORD
 Paleontology – study of fossils
 Fossil – remains or traces of an
organism that lived long ago
 Remains: ex. bone,
tooth, or shell
 Traces: ex. burrow,
footprint, or
imprint
1 - FOSSIL RECORD
 Most fossils are found in layered
sedimentary rock
 Oldest fossils
are on the
lowest layer
1 - FOSSIL RECORD
 Comparing fossils from different
layers shows:
🞾 Life on Earth
has changed
🞾 Increased
number of
life forms
2 - BIOCHEMICAL
THE GENETIC CODE
 Triplets of DNA nitrogen-base
sequences that code for specific
amino acids
 The amino
acid triplet
is the
same in
almost all
organisms.
2 - BIOCHEMICAL
 The similarity of triplet DNA
codes making-up amino acids
shows:
🞾 A probable
common
ancestor for
all life on
Earth
2 - BIOCHEMICAL
 “Universal” GENETIC CODE
🞾 Similar genes
🞾 Over the ages, the genetic code
has passed
unchanged (or
nearly so) from
parent to
offspring.
2 - BIOCHEMICAL
AMINO ACID SEQUENCING
 The amino acid
sequence in a
particular
protein is
compared
between
organisms. Number of differences from
human hemoglobin
45
1
67
27
2 - BIOCHEMICAL
 Comparing amino acid sequence
shows:
Species Difference
Gorilla 1
Rhesus Monkey 8
Mouse 27
Chicken 45
Frog 67
Lamprey 125
Amino Acid Difference in
Hemoglobin Compared
with Human
Closeness of
relationship
A probable
common
ancestor
Human hemoglobin
has 146 amino acids
Amino Acid
Sequencing is
probably the
STRONGEST
evidence for
relationships
among
organisms.
2 - BIOCHEMICAL
 CLADOGRAM: diagram that
shows the evolutionary
relationship among a
group of organisms.
Species Difference
Gorilla 1
Monkey 8
Mouse 27
Chicken 45
Frog 67
Lamprey 125
Amino Acid Difference
in Hemoglobin
Compared with Human
Number of Amino Acid Differences
150
100
50
0
40
20
30
10
G
F
E
D
C
B
A
Common
ancestor
W
W
hh
ea
re
t o
w
ro
gu
al
n
d
istm
he
cb
oe
m
lo
m
no
gn
s an
tc
e
e
a
s
c
th
or
bra
bn
ec
?h?
3 COMPARATIVE ANATOMY
HOMOLOGOUS STRUCTURES
 structures with similar structure
but different function
 ex: limbs of vertebrates (turtle,
alligator, bird, mammal)
Turtle
Alligator
Bird
Mammal
3 COMPARATIVE ANATOMY
 Homologous structures show
🞾 Similar genes
🞾 Descent from a common ancestor
Turtle
Alligator
Bird
Mammal
Ancient lobe-finned fish
3 COMPARATIVE ANATOMY
VESTIGIAL STRUCTURES
 organs so reduced in
size that they are
nonfunctioning
remnants of similar
organs in other species
 ex: human tailbone,
appendix, whale pelvis
3 COMPARATIVE ANATOMY
 Vestigial structures show:
🞾 an organism’s
evolutionary past
🞾 a common ancestor
with species that have
similar structures that
are still functioning
3 COMPARATIVE ANATOMY
 EMBRYOLOGY
 Embryos of different species
may appear similar in early
stages of development
 ex: vertebrate
development
3 COMPARATIVE ANATOMY
 Comparison of
similarities in
embryos can
show:
🞾 Relationship
to a common
ancestor
4 - OBSERVABLE EVENTS
 Some changes in species have
been observed and studied:
Peter & Rosemary
Grant’s Study of
Beak Size Shift in
Darwin’s Finches
H. Kettlewell’s Study
of Peppered Moth
Color Shifts
4 - OBSERVABLE EVENTS
🞾 Observable events show that
evolution is an ongoing process
Peter & Rosemary
Grant’s Study of
Beak Size Shift in
Darwin’s Finches
H. Kettlewell’s Study
of Peppered Moth
Color Shifts
Works Cited
 “Geographic Distribution of Organisms” photo:
Miller, Kenneth and Levine, Joseph. (2004).
Biology. Prentice Hall.

evidencesofevolution-120207073412-phpapp02.pptx

  • 1.
  • 2.
    EVOLUTION IS Genetic changein a population through time.
  • 3.
    Charles Darwin On hisjourney around the world, Darwin found evidence of gradual change (evolution). Darwin cited evidences he found in fossil records, geographic distribution and homologous structures.
  • 4.
    Evidences of Evolution Today mostevidences for evolution are grouped into four main categories:  Biochemical  Fossil Record  Comparative Anatomy  Observable Events
  • 5.
    1 - FOSSILRECORD  Paleontology – study of fossils  Fossil – remains or traces of an organism that lived long ago  Remains: ex. bone, tooth, or shell  Traces: ex. burrow, footprint, or imprint
  • 6.
    1 - FOSSILRECORD  Most fossils are found in layered sedimentary rock  Oldest fossils are on the lowest layer
  • 7.
    1 - FOSSILRECORD  Comparing fossils from different layers shows: 🞾 Life on Earth has changed 🞾 Increased number of life forms
  • 8.
    2 - BIOCHEMICAL THEGENETIC CODE  Triplets of DNA nitrogen-base sequences that code for specific amino acids  The amino acid triplet is the same in almost all organisms.
  • 9.
    2 - BIOCHEMICAL The similarity of triplet DNA codes making-up amino acids shows: 🞾 A probable common ancestor for all life on Earth
  • 10.
    2 - BIOCHEMICAL “Universal” GENETIC CODE 🞾 Similar genes 🞾 Over the ages, the genetic code has passed unchanged (or nearly so) from parent to offspring.
  • 11.
    2 - BIOCHEMICAL AMINOACID SEQUENCING  The amino acid sequence in a particular protein is compared between organisms. Number of differences from human hemoglobin 45 1 67 27
  • 12.
    2 - BIOCHEMICAL Comparing amino acid sequence shows: Species Difference Gorilla 1 Rhesus Monkey 8 Mouse 27 Chicken 45 Frog 67 Lamprey 125 Amino Acid Difference in Hemoglobin Compared with Human Closeness of relationship A probable common ancestor Human hemoglobin has 146 amino acids Amino Acid Sequencing is probably the STRONGEST evidence for relationships among organisms.
  • 13.
    2 - BIOCHEMICAL CLADOGRAM: diagram that shows the evolutionary relationship among a group of organisms. Species Difference Gorilla 1 Monkey 8 Mouse 27 Chicken 45 Frog 67 Lamprey 125 Amino Acid Difference in Hemoglobin Compared with Human Number of Amino Acid Differences 150 100 50 0 40 20 30 10 G F E D C B A Common ancestor W W hh ea re t o w ro gu al n d istm he cb oe m lo m no gn s an tc e e a s c th or bra bn ec ?h?
  • 14.
    3 COMPARATIVE ANATOMY HOMOLOGOUSSTRUCTURES  structures with similar structure but different function  ex: limbs of vertebrates (turtle, alligator, bird, mammal) Turtle Alligator Bird Mammal
  • 15.
    3 COMPARATIVE ANATOMY Homologous structures show 🞾 Similar genes 🞾 Descent from a common ancestor Turtle Alligator Bird Mammal Ancient lobe-finned fish
  • 16.
    3 COMPARATIVE ANATOMY VESTIGIALSTRUCTURES  organs so reduced in size that they are nonfunctioning remnants of similar organs in other species  ex: human tailbone, appendix, whale pelvis
  • 17.
    3 COMPARATIVE ANATOMY Vestigial structures show: 🞾 an organism’s evolutionary past 🞾 a common ancestor with species that have similar structures that are still functioning
  • 18.
    3 COMPARATIVE ANATOMY EMBRYOLOGY  Embryos of different species may appear similar in early stages of development  ex: vertebrate development
  • 19.
    3 COMPARATIVE ANATOMY Comparison of similarities in embryos can show: 🞾 Relationship to a common ancestor
  • 20.
    4 - OBSERVABLEEVENTS  Some changes in species have been observed and studied: Peter & Rosemary Grant’s Study of Beak Size Shift in Darwin’s Finches H. Kettlewell’s Study of Peppered Moth Color Shifts
  • 21.
    4 - OBSERVABLEEVENTS 🞾 Observable events show that evolution is an ongoing process Peter & Rosemary Grant’s Study of Beak Size Shift in Darwin’s Finches H. Kettlewell’s Study of Peppered Moth Color Shifts
  • 22.
    Works Cited  “GeographicDistribution of Organisms” photo: Miller, Kenneth and Levine, Joseph. (2004). Biology. Prentice Hall.