Downloaded 82 times


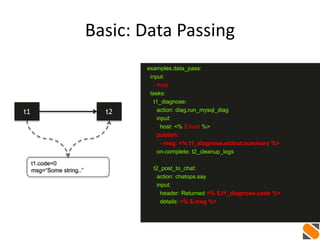

![More: Multiple Data
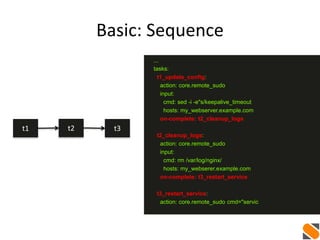
t1 t2
ip_list=[...]
...
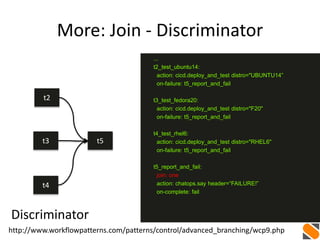
t1_get_ip_list:
action: myaws.allocate_floating_ips num=4
publish:
- ip_list: <% $.t1_get_ip_list.ips %>
on-complete: t2_create_vms
t2_create_vms:
with-items: ip in <% $. ip_list %>
action: myaws.create_vms ip=<% $.ip %>](https://image.slidesharecdn.com/auto-remediation-meetup-20150514-150515162626-lva1-app6892/85/Event-Driven-Automation-Meetup-May-14-2015-35-320.jpg)

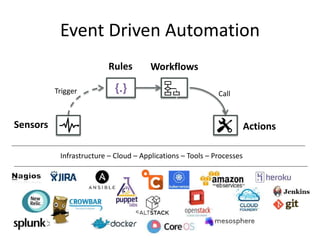
The document discusses event-driven automation and workflows, highlighting its evolution and importance in IT automation and business process management. It emphasizes the role of workflows in managing tasks, keeping state, and passing data across systems, while outlining various patterns and practical examples of event-driven automation. The author promotes StackStorm as an open-source solution that integrates these concepts effectively.