Download to read offline

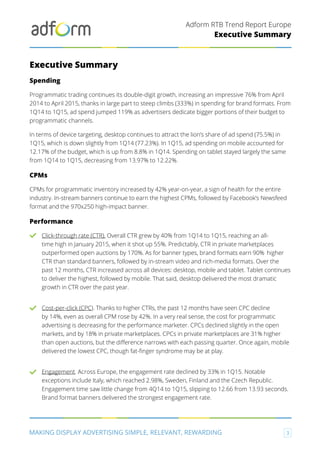
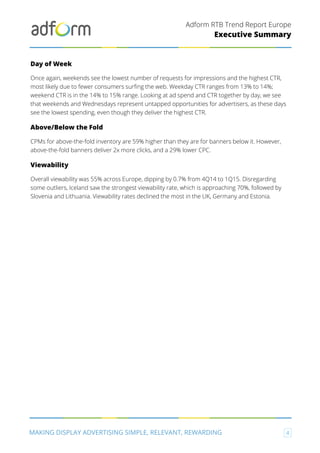

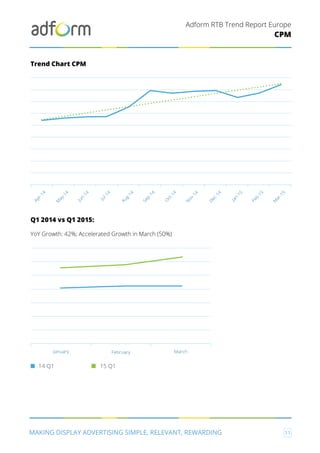
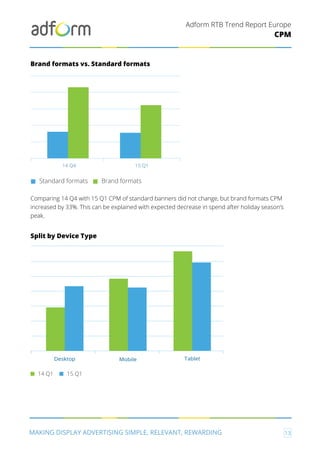
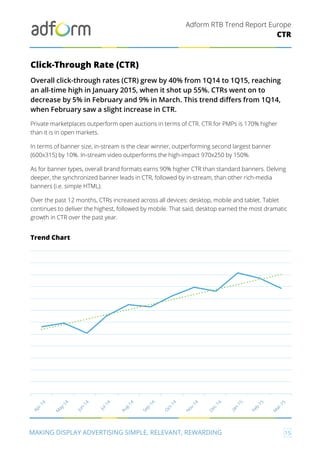

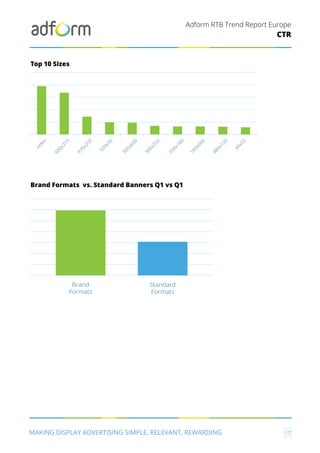
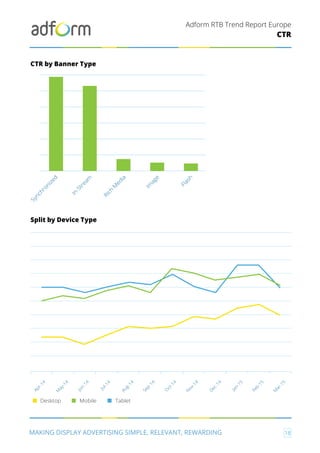

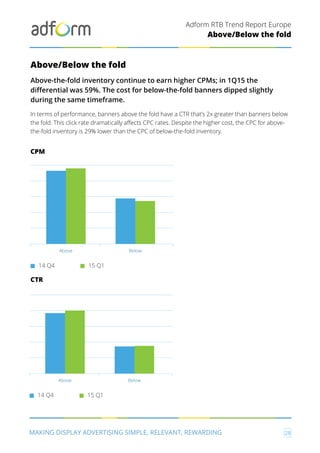
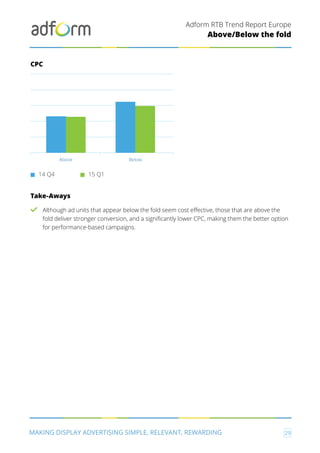
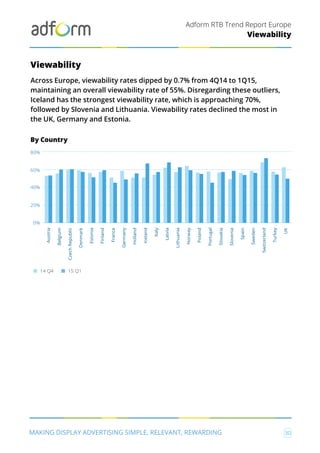

The Adform RTB Trend Report for Europe Q1 2015 highlights substantial growth in programmatic advertising, with a 76% increase in spending from April 2014 to April 2015, and a notable 119% growth in ad spend from Q1 2014 to Q1 2015. Key findings include a 42% rise in CPMs, an overall 40% increase in CTRs, and the ongoing dominance of desktop ad spending, while mobile ad spending showed significant growth. The report indicates potential opportunities for advertisers on weekends and notes a decline in engagement rates across Europe, with brand formats driving higher performance metrics compared to standard banners.


![[HUBDAY] UDA, Mediabuying & Programmatique](https://cdn.slidesharecdn.com/ss_thumbnails/uda-mediabuyingprogrammatic-150420040505-conversion-gate01-thumbnail.jpg?width=640&height=640&fit=bounds)


