2
Disclaimer
The content ofthis presentation may include expectations regarding future events
and results estimated by management. However, such forward-looking statements are
no guarantee of future delivery and/or performance, given the risks and uncertainties
inherent to the business environment, including the country's economic performance,
the global economy, the capital market, regulatory aspects of the industry, and
governmental and competitive issues, among other factors, as well as the risks
presented in the disclosure documents filed by Estácio, which are subject to change
without prior notice.
5
New Executive Officers
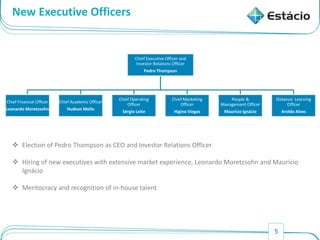
Election of Pedro Thompson as CEO and Investor Relations Officer
Hiring of new executives with extensive market experience, Leonardo Moretzsohn and Maurício
Ignácio
Meritocracy and recognition of in-house talent
Chief Executive Officer and
Investor Relations Officer
Pedro Thompson
Chief Financial Officer
Leonardo Moretzsohn
Chief Academic Officer
Hudson Mello
Chief Operating
Officer
Sérgio Leite
Chief Marketing
Officer
Higino Viegas
People &
Management Officer
Maurício Ignácio
Distance Learning
Officer
Aroldo Alves
7
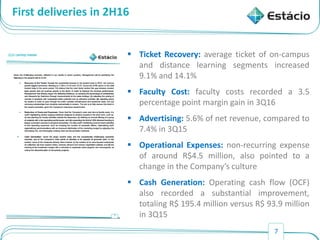
First deliveries in2H16
Ticket Recovery: average ticket of on-campus
and distance learning segments increased
9.1% and 14.1%
Faculty Cost: faculty costs recorded a 3.5
percentage point margin gain in 3Q16
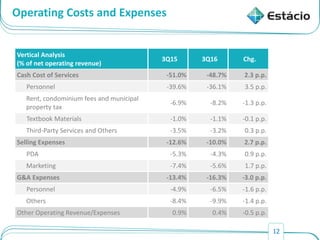
Advertising: 5.6% of net revenue, compared to
7.4% in 3Q15
Operational Expenses: non-recurring expense
of around R$4.5 million, also pointed to a
change in the Company’s culture
Cash Generation: Operating cash flow (OCF)
also recorded a substantial improvement,
totaling R$ 195.4 million versus R$ 93.9 million
in 3Q15
11
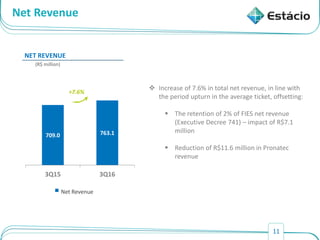
Net Revenue
709.0 763.1
3Q153Q16
NET REVENUE
(R$ million)
+7.6%
Net Revenue
Increase of 7.6% in total net revenue, in line with
the period upturn in the average ticket, offsetting:
The retention of 2% of FIES net revenue
(Executive Decree 741) – impact of R$7.1
million
Reduction of R$11.6 million in Pronatec
revenue
13
Net Income
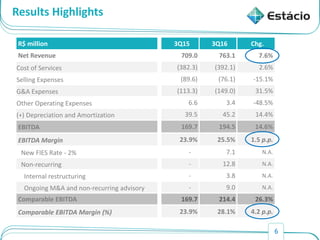
R$ million3Q15 3Q16 Chg.
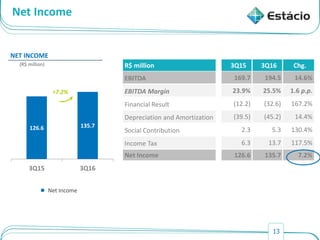
EBITDA 169.7 194.5 14.6%
EBITDA Margin 23.9% 25.5% 1.6 p.p.
Financial Result (12.2) (32.6) 167.2%
Depreciation and Amortization (39.5) (45.2) 14.4%
Social Contribution 2.3 5.3 130.4%
Income Tax 6.3 13.7 117.5%
Net Income 126.6 135.7 7.2%
126.6 135.7
3Q15 3Q16
NET INCOME
(R$ million)
+7.2%
Net Income
14.
14
Average Receivables Days
R$million 3Q15 3Q16
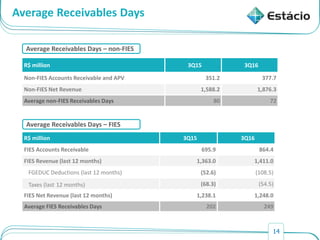
Non-FIES Accounts Receivable and APV 351.2 377.7
Non-FIES Net Revenue 1,588.2 1,876.3
Average non-FIES Receivables Days 80 72
Average Receivables Days – non-FIES
R$ million 3Q15 3Q16
FIES Accounts Receivable 695.9 864.4
FIES Revenue (last 12 months) 1,363.0 1,411.0
FGEDUC Deductions (last 12 months) (52.6) (108.5)
Taxes (last 12 months) (68.3) (54.5)
FIES Net Revenue (last 12 months) 1,238.1 1,248.0
Average FIES Receivables Days 202 249
Average Receivables Days – FIES
15.
15
Capitalization and Cash
R$million 3Q15 3Q16
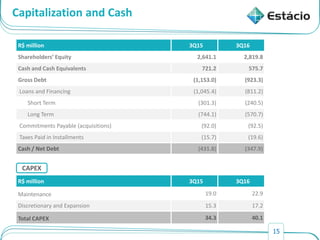
Shareholders’ Equity 2,641.1 2,819.8
Cash and Cash Equivalents 721.2 575.7
Gross Debt (1,153.0) (923.3)
Loans and Financing (1,045.4) (811.2)
Short Term (301.3) (240.5)
Long Term (744.1) (570.7)
Commitments Payable (acquisitions) (92.0) (92.5)
Taxes Paid in Installments (15.7) (19.6)
Cash / Net Debt (431.8) (347.9)
R$ million 3Q15 3Q16
Maintenance 19.0 22.9
Discretionary and Expansion 15.3 17.2
Total CAPEX 34.3 40.1
CAPEX
16.
16
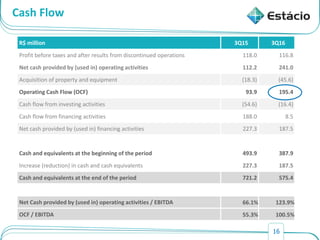
Cash Flow
R$ million3Q15 3Q16
Profit before taxes and after results from discontinued operations 118.0 116.8
Net cash provided by (used in) operating activities 112.2 241.0
Acquisition of property and equipment (18.3) (45.6)
Operating Cash Flow (OCF) 93.9 195.4
Cash flow from investing activities (54.6) (16.4)
Cash flow from financing activities 188.0 8.5
Net cash provided by (used in) financing activities 227.3 187.5
Cash and equivalents at the beginning of the period 493.9 387.9
Increase (reduction) in cash and cash equivalents 227.3 187.5
Cash and equivalents at the end of the period 721.2 575.4
Net Cash provided by (used in) operating activities / EBITDA 66.1% 123.9%
OCF / EBITDA 55.3% 100.5%
17.
17
One-Off Dividends
TheESM of November 10, 2016 approved the payment of one-off dividends totaling
R$420 million, as established in the Protocol and Justification of the merger of the
Company’s shares by Kroton, as follows:
R$280 million: to be paid in 2 installments (on November 22 and December 15,
2016). Shares will be traded ex-dividends as of November 11, 2016.
R$140 million: given the possibility of the freeing of FIES payments this year or at
the beginning of 2017, and aiming to maintain the solidity of our cash flow, the
Board of Directors has been authorized to declare these dividends at a time
deemed to be most appropriate for the Company, even before approval by CADE,
Brazil’s antitrust authority. Shares will only be traded ex-dividends as of the 4th
business day following the Board of Directors meeting in which these dividends are
declared.
19
Guidelines for 2017
Intake strategy:
Resizing and new incentives for the sales force and channel mix;
More restrictive policies for the granting of discounts and scholarships;
Definition of intake targets and KPIs based on the average ticket;
Alignment of prices with the competition and elasticity studies.
Marketing and advertising plan:
Regionalized strategy, with messages that take the cultural and competitive
characteristics and the strength and recognition of the Estácio brand in each
location, into consideration.
20.
20
Guidelines for 2017
Faculty costs:
Cost planning in relation to faculty activities outside the classroom;
Definition of an annual offering of a group of subjects with a low operating
performance; and
Expansion of the 20% distance learning content ceiling to the legacy courses
of the acquired companies.
Cash generation:
Explore collection incentives;
Greater control over CAPEX; and
Increased procurement efficiency, with healthier working capital,
terms and synergies.