- CorEnergy Infrastructure Trust held an investor conference call to discuss its fiscal year 2016 results
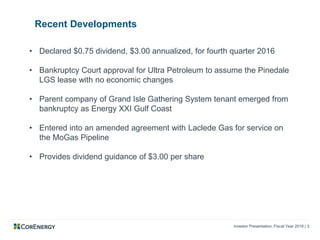
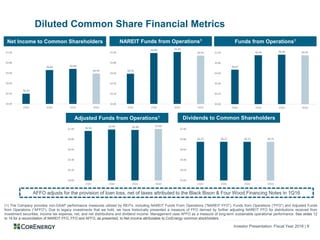
- Key developments included declaring a $0.75 dividend for Q4 2016, bringing the annual dividend to $3.00 per share, and providing continued dividend guidance of $3.00 per share
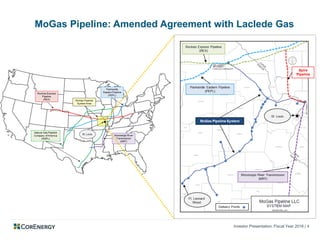
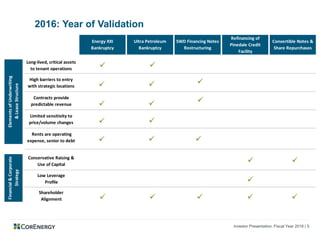
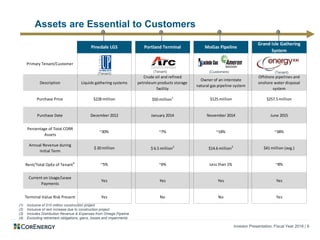
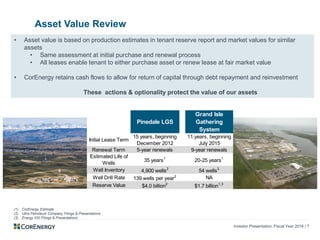
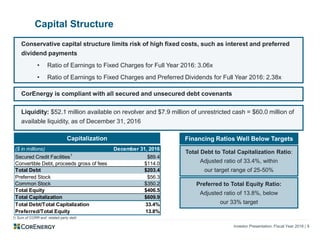
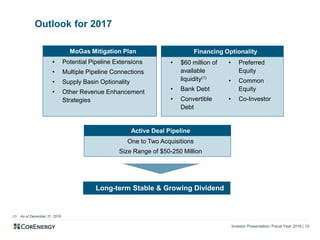
- The presentation reviewed CorEnergy's asset portfolio and tenants, capital structure, recent financing activities, and outlook for 2017 including a focus on acquisitions of $50-250 million and continued stable dividend payments.