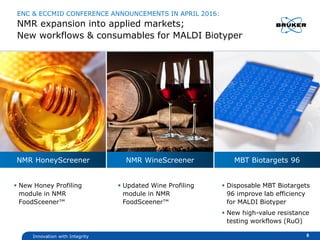
- Bruker Corporation reported financial results for Q1 2016 with total revenue increasing 6.2% year-over-year to $375.4 million. Organic revenue growth was 5.6% excluding currency effects and M&A.
- Non-GAAP operating margin expanded 250 basis points to 12.6% due to increased operating leverage. Non-GAAP EPS grew 50% year-over-year.
- For full-year 2016, Bruker expects organic revenue growth of approximately 3% and non-GAAP operating margin expansion of approximately 100 basis points year-over-year. Guidance for non-GAAP EPS is $0.97 to $1.02.
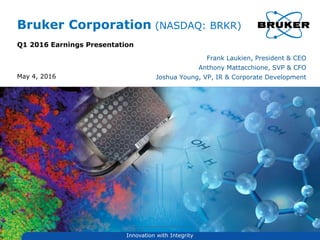

![Q1-2016 Performance
Revenue growth of $22M, or +6.2% y-o-y
− FX lowers revenue by -0.9% y-o-y
− Jordan Valley acquisition adds +1.5% y-o-y
Organic revenue growth of +5.6% y-o-y
− North America and China strongest performing
regions
Non-GAAP operating margin expands by +250 basis
points y-o-y to 12.6%
GAAP EPS grows to $0.14, from $0.04 in Q1-15
Non-GAAP EPS grows by +50% y-o-y
Q1 Financials
4
Revenues [$ m]
353 375
Q1-15 Q1-16
Non-GAAP EPS
Momentum continues with good organic revenue
growth and margin expansion in Q1-16
+6%
+50%
$0.14
$0.21
Q1-15
Q1-16](https://image.slidesharecdn.com/q1-16earningsslides-final-160504190521/85/Q1-16-earnings-slides-final-4-320.jpg)


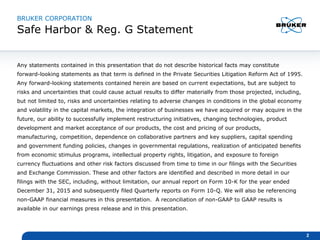
![NON-GAAP FINANCIAL PERFORMANCE:
Q1-2016 Overview
[$ m, except EPS] Q1-2016 Q1-2015 Δ
Revenues 375.4 353.5 +6%
Operating Income 47.3 35.8 +32%
Margin (%) 12.6% 10.1%
Non-GAAP EPS $0.21 $0.14 +50%
Free Cash Flow -22.0 21.3 -43M
[$ m] Mar 31, 2016 Mar 31, 2015 Δ
Net Cash 118.3 138.7 -14%
Working capital (WC)* 598.4 614.4 -3%
WC-to-revenue ratio 0.36 0.35 +0.01
11
COMMENTS
Operating leverage results in
increased operating income
and EPS
Reduction in customer
advances, taxes on cash
repatriation and other items
result in negative free cash
flow of -$22M
Share buyback and dividend
payment result in lower net
cash
Lower working capital due to
33 day improvement in cash
conversion cycle
FX drives the increased
WC-to-revenue ratio
* WC = (Accounts Receivable + Inventory - Accounts Payable)](https://image.slidesharecdn.com/q1-16earningsslides-final-160504190521/85/Q1-16-earnings-slides-final-11-320.jpg)
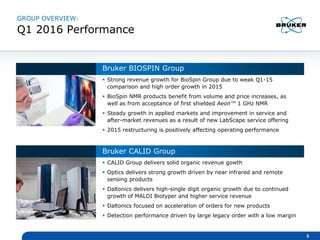
![Q1 2015 Organic Currency Portfolio Q1 2016
$353.5M
$375.4M
Q1 2016 revenue bridge
Organic Currency Portfolio Total
+5.6% -0.9% +1.5% +6.2%
Organic revenue growth
of +5.6% driven by
strong performance in
BioSpin and CALID
Groups
First full quarter of
Jordan Valley acquisition
drives portfolio effect
12
Q1 2016 DRIVERS
Q1-2016 Revenue Bridge [$ m]
+$19.8 -$3.0 +$5.1
Q1 2016 Revenue for Bruker Corp.](https://image.slidesharecdn.com/q1-16earningsslides-final-160504190521/85/Q1-16-earnings-slides-final-12-320.jpg)
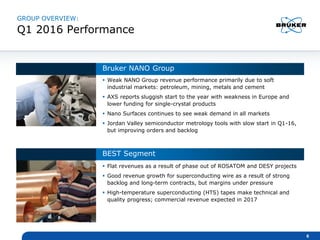
![Q1 2016 Non-GAAP Results
[$ m, except EPS] Q1 2016 Q1 2015 Δ
Total Revenues 375.4 353.5 +6%
Gross Profit 175.4 167.1 +5%
Margin (% of revenues) 46.7% 47.3%
SG&A -92.0 -94.1 -2%
(% of revenues) 24.5% 26.6%
R&D -36.1 -37.2 -3%
(% of revenues) 9.6% 10.5%
Operating Income 47.3 35.8 +32%
(% of revenues) 12.6% 10.1%
Tax Rate 17.7% 27.2% -950 bps
Net Income* 34.3 23.1 +48%
EPS $0.21 $0.14 +50%
Shares Outstanding 164.3 169.7 -3%
Gross margin: increase
in BioSpin volume, mix,
price, and restructuring
effects; offset by lower
NANO volume and
unfavorable mix in CALID
Continuing focus on
operating expense
leverage
Audit settlement and
jurisdictional mix in Q1
lower tax rate
Share buyback program
commenced in November
2015 results in lower
share count
13
COMMENTS
* Attributable to BrukerSum of items may not total due to rounding](https://image.slidesharecdn.com/q1-16earningsslides-final-160504190521/85/Q1-16-earnings-slides-final-13-320.jpg)
![Q1 2016 Cash Flow Statement
[$ m] Q1 2016 Q1 2015 Δ
Net Income 23.6 6.9 +16.7
Depreciation & amortization 13.2 13.5 -0.3
Changes in working capital* -1.3 30.5 -31.8
Other -49.5 -23.9 -25.6
Operating cash flow -14.0 27.0 -41.0
Capital expenditures -8.0 -5.7 -2.3
Free cash flow -22.0 21.3 -43.3
Y-o-Y free cash flow
comparison driven by:
– Higher customer
advances due to strong
NMR orders in Q1-15
– Higher 2015 bonus
payments paid in Q1-16
– Tax payments in Q1-16
associated with 2015
cash repatriation
14
COMMENTS
* WC = (Accounts Receivable + Inventory - Accounts Payable)](https://image.slidesharecdn.com/q1-16earningsslides-final-160504190521/85/Q1-16-earnings-slides-final-14-320.jpg)

![Q1 2016 GAAP Results
[$ m, except EPS] Q1 2016 Q1 2015 Δ
Total Revenues 375.4 353.5 +6%
Gross Profit 166.8 160.2 +4%
Margin (% of sales) 44.4% 45.3%
SG&A -92.7 -94.6 -2%
(% of revenues) 24.7% 26.8%
R&D -36.1 -37.2 -3%
(% of revenues) 9.6% 10.5%
Operating Income 34.0 15.2 +124%
(% of revenues) 9.1% 4.3%
Net Income* 23.6 6.5 +263%
EPS $0.14 $0.04 +250%
Shares Outstanding 164.3 169.7 -3%
18
* Attributable to BrukerSum of items may not total due to rounding](https://image.slidesharecdn.com/q1-16earningsslides-final-160504190521/85/Q1-16-earnings-slides-final-18-320.jpg)
![Q1 2016 Reconciliation of GAAP and
Non-GAAP Results
[$ m, except EPS] Q1 2016 Q1 2015
GAAP Operating Income 34.0 15.2
Restructuring Costs 3.8 3.3
Acquisition-Related Costs 1.9 0.2
Purchased Intangible Amortization 5.4 5.2
Other Costs 2.2 11.9
TOTAL 13.3 20.6
Non-GAAP Operating Income 47.3 35.8
Non-GAAP Interest & Other Income (Expense), net -5.6 -3.5
Non GAAP Profit Before Tax 41.7 32.3
Non-GAAP Income Tax Provision -7.4 -8.8
Non-GAAP Tax Rate 17.7% 27.2%
Minority Interest 0.0 -0.4
Non-GAAP Net Income* 34.3 23.1
Non-GAAP EPS $0.21 $0.14
19
Sum of items may not total due to rounding *Attributable to Bruker](https://image.slidesharecdn.com/q1-16earningsslides-final-160504190521/85/Q1-16-earnings-slides-final-19-320.jpg)
![Balance sheet
[$ m] Mar 31, 2016 Dec 31, 2015 Mar 31, 2015
Cash, Cash Equivalents & Short-term
Investments
420.5 468.3 492.3
Financial Debt 302.2 265.8 353.6
Net Cash 118.3 202.5 138.7
20
[$ m] Mar 31, 2016 Dec 31, 2015 Mar 31, 2015
Total Assets 1,739.8 1,730.0 1,771.7
Working Capital* 598.4 584.6 614.4
Intangibles, Net & Other Long-Term
Assets
275.4 267.4 238.3
* WC = (Accounts Receivable + Inventory - Accounts Payable)](https://image.slidesharecdn.com/q1-16earningsslides-final-160504190521/85/Q1-16-earnings-slides-final-20-320.jpg)
![Q1-16 GAAP SEGMENT RESULTS:
BSI and BEST GAAP Performance
[$ m] Q1 2016 Q1 2015 Δ
REVENUE
Scientific Instruments (BSI) 350.4 327.5 +7%
Organic Revenue Growth (%) +6.2% -3.6%
Energy & Supercon Technologies (BEST) 27.2 27.5 -1%
Organic Revenue Growth (%) +0.2% -4.1%
Corporate Eliminations -2.2 -1.5
Total Revenue 375.4 353.5 +6%
OPERATING INCOME
Scientific Instruments (BSI) 33.0 13.7 +141%
Energy & Supercon Technologies (BEST) 0.0 1.0 -100%
Corporate Eliminations 1.0 0.5
Total Operating Income 34.0 15.2 +124%
21
Sum of items may not total due to rounding](https://image.slidesharecdn.com/q1-16earningsslides-final-160504190521/85/Q1-16-earnings-slides-final-21-320.jpg)


