Download to read offline
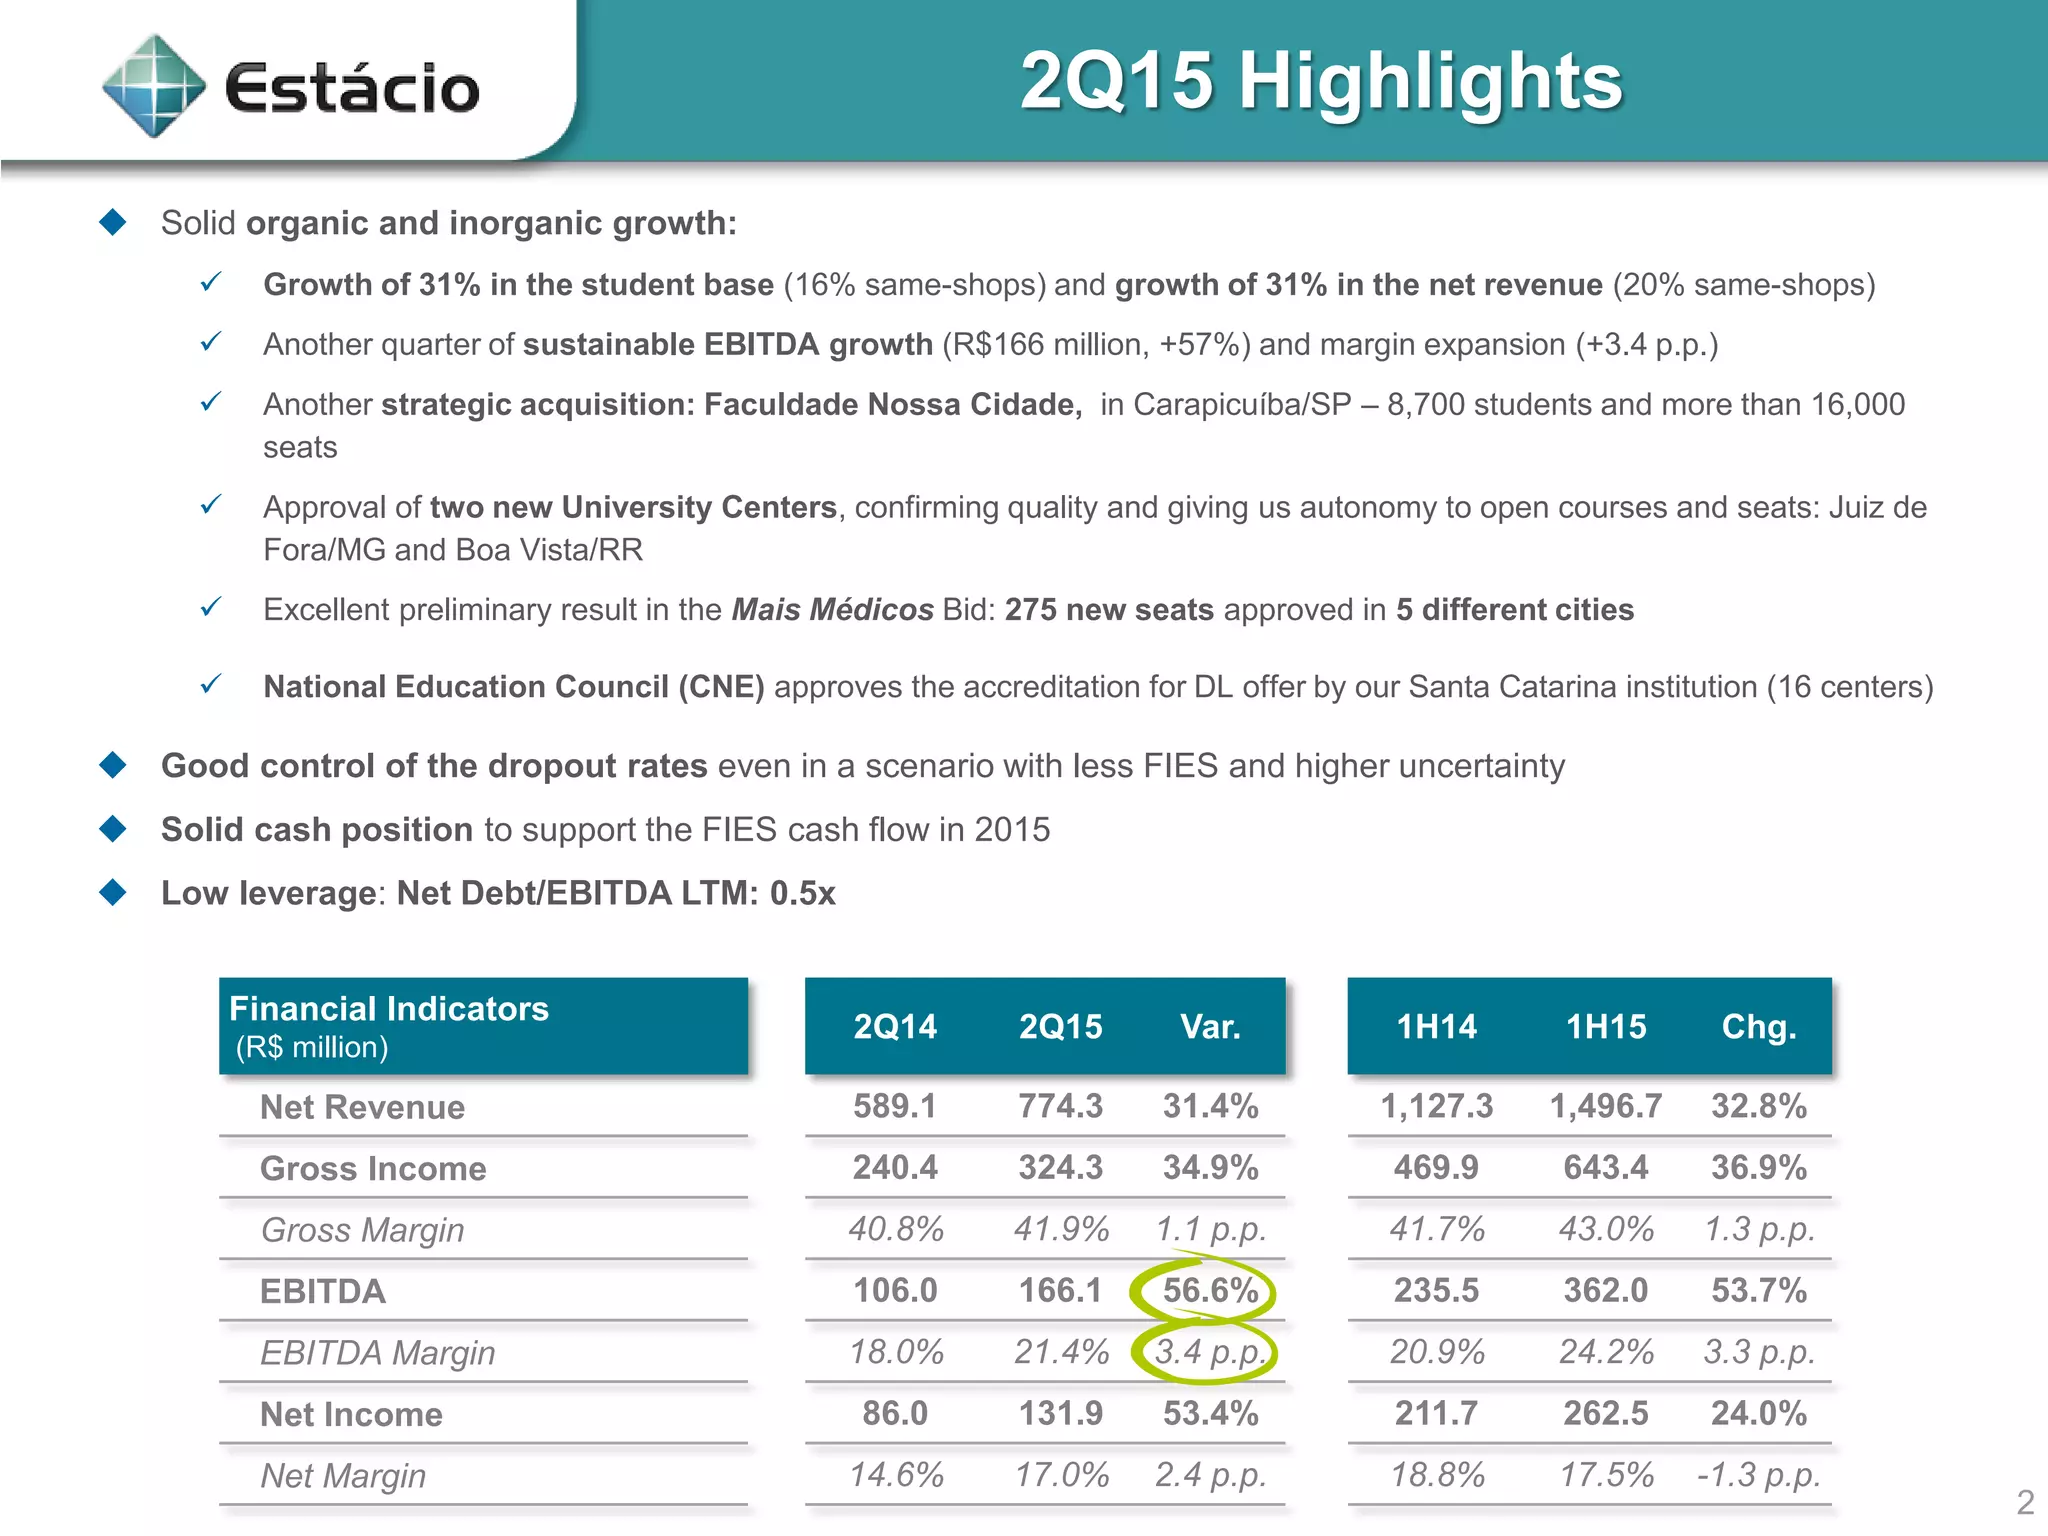
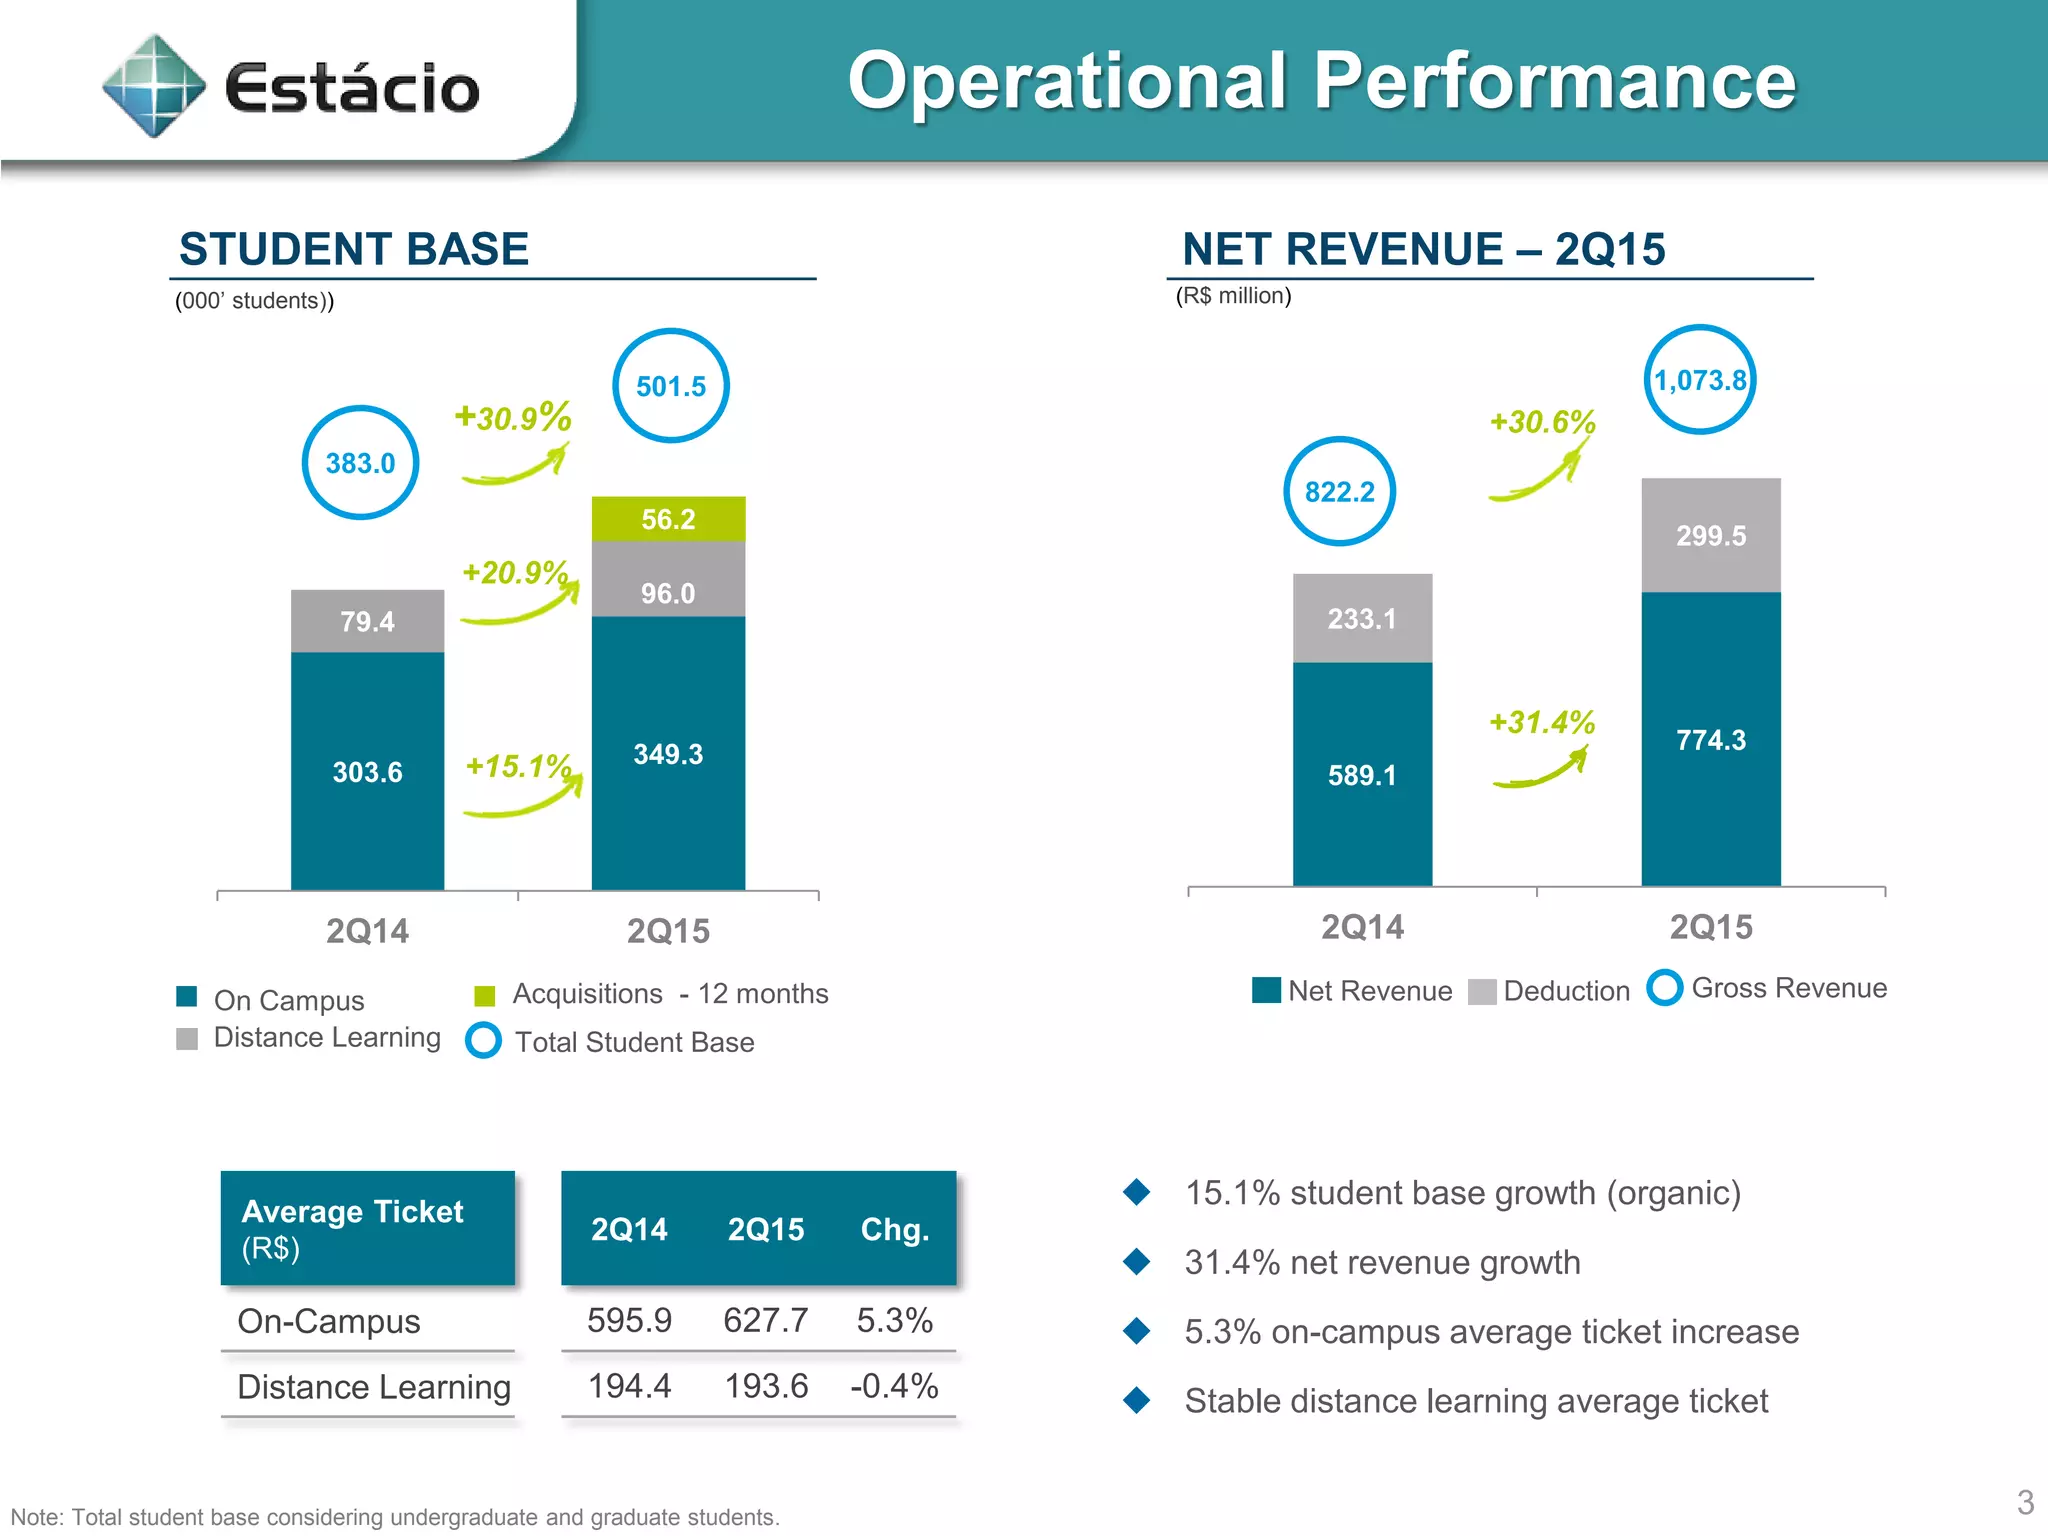
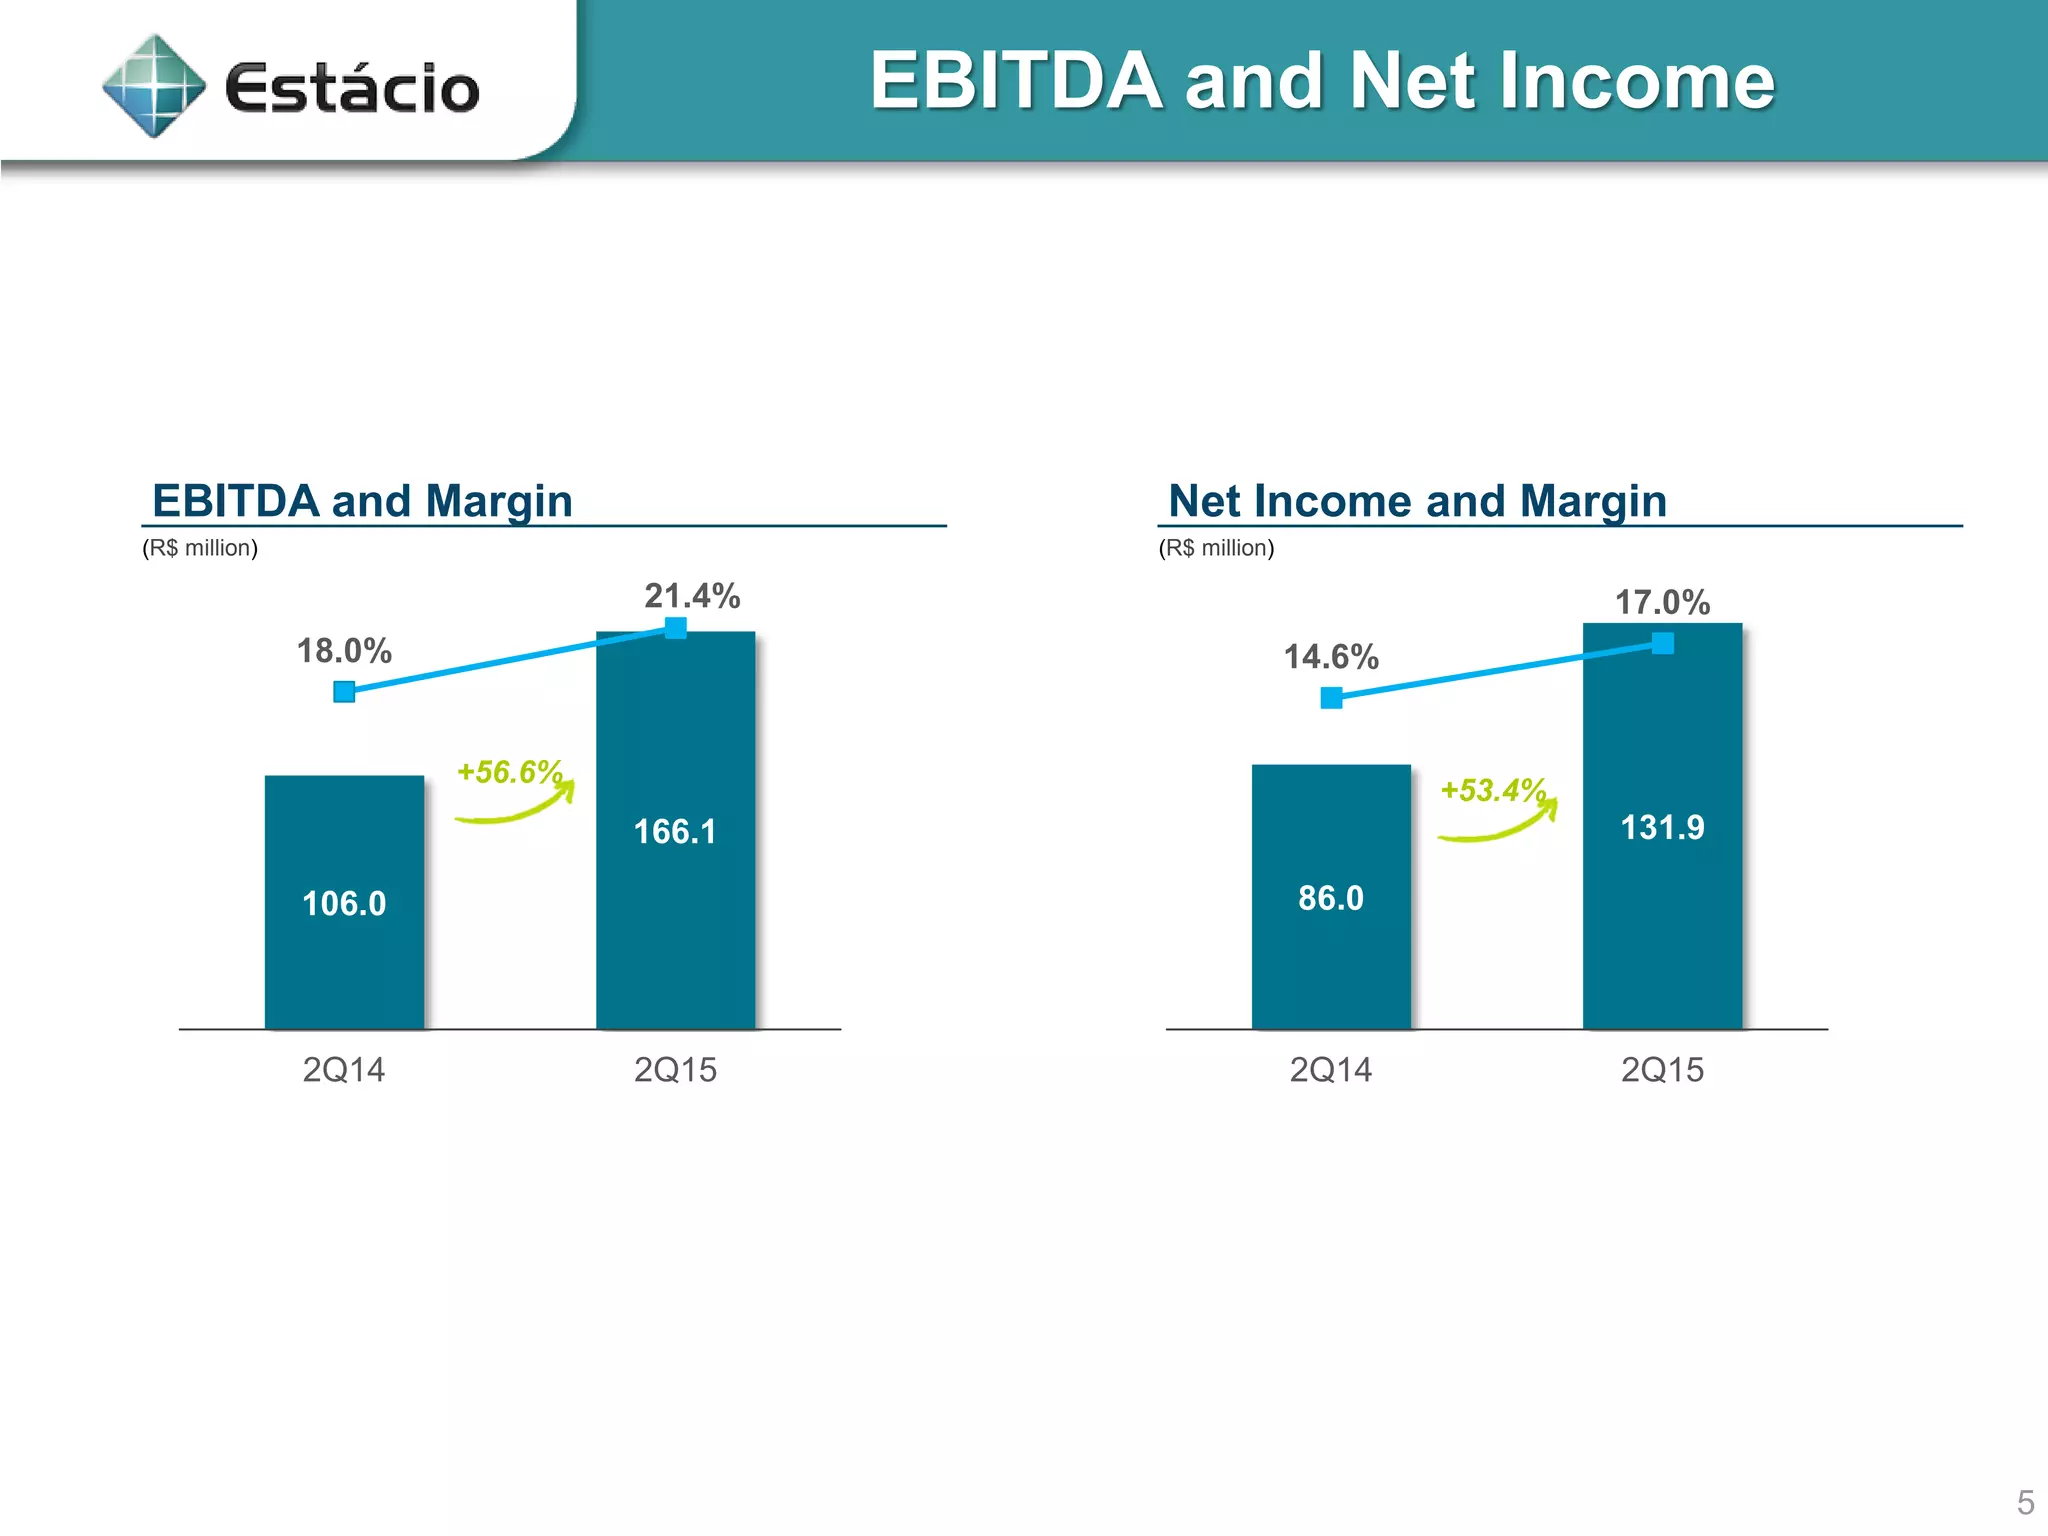
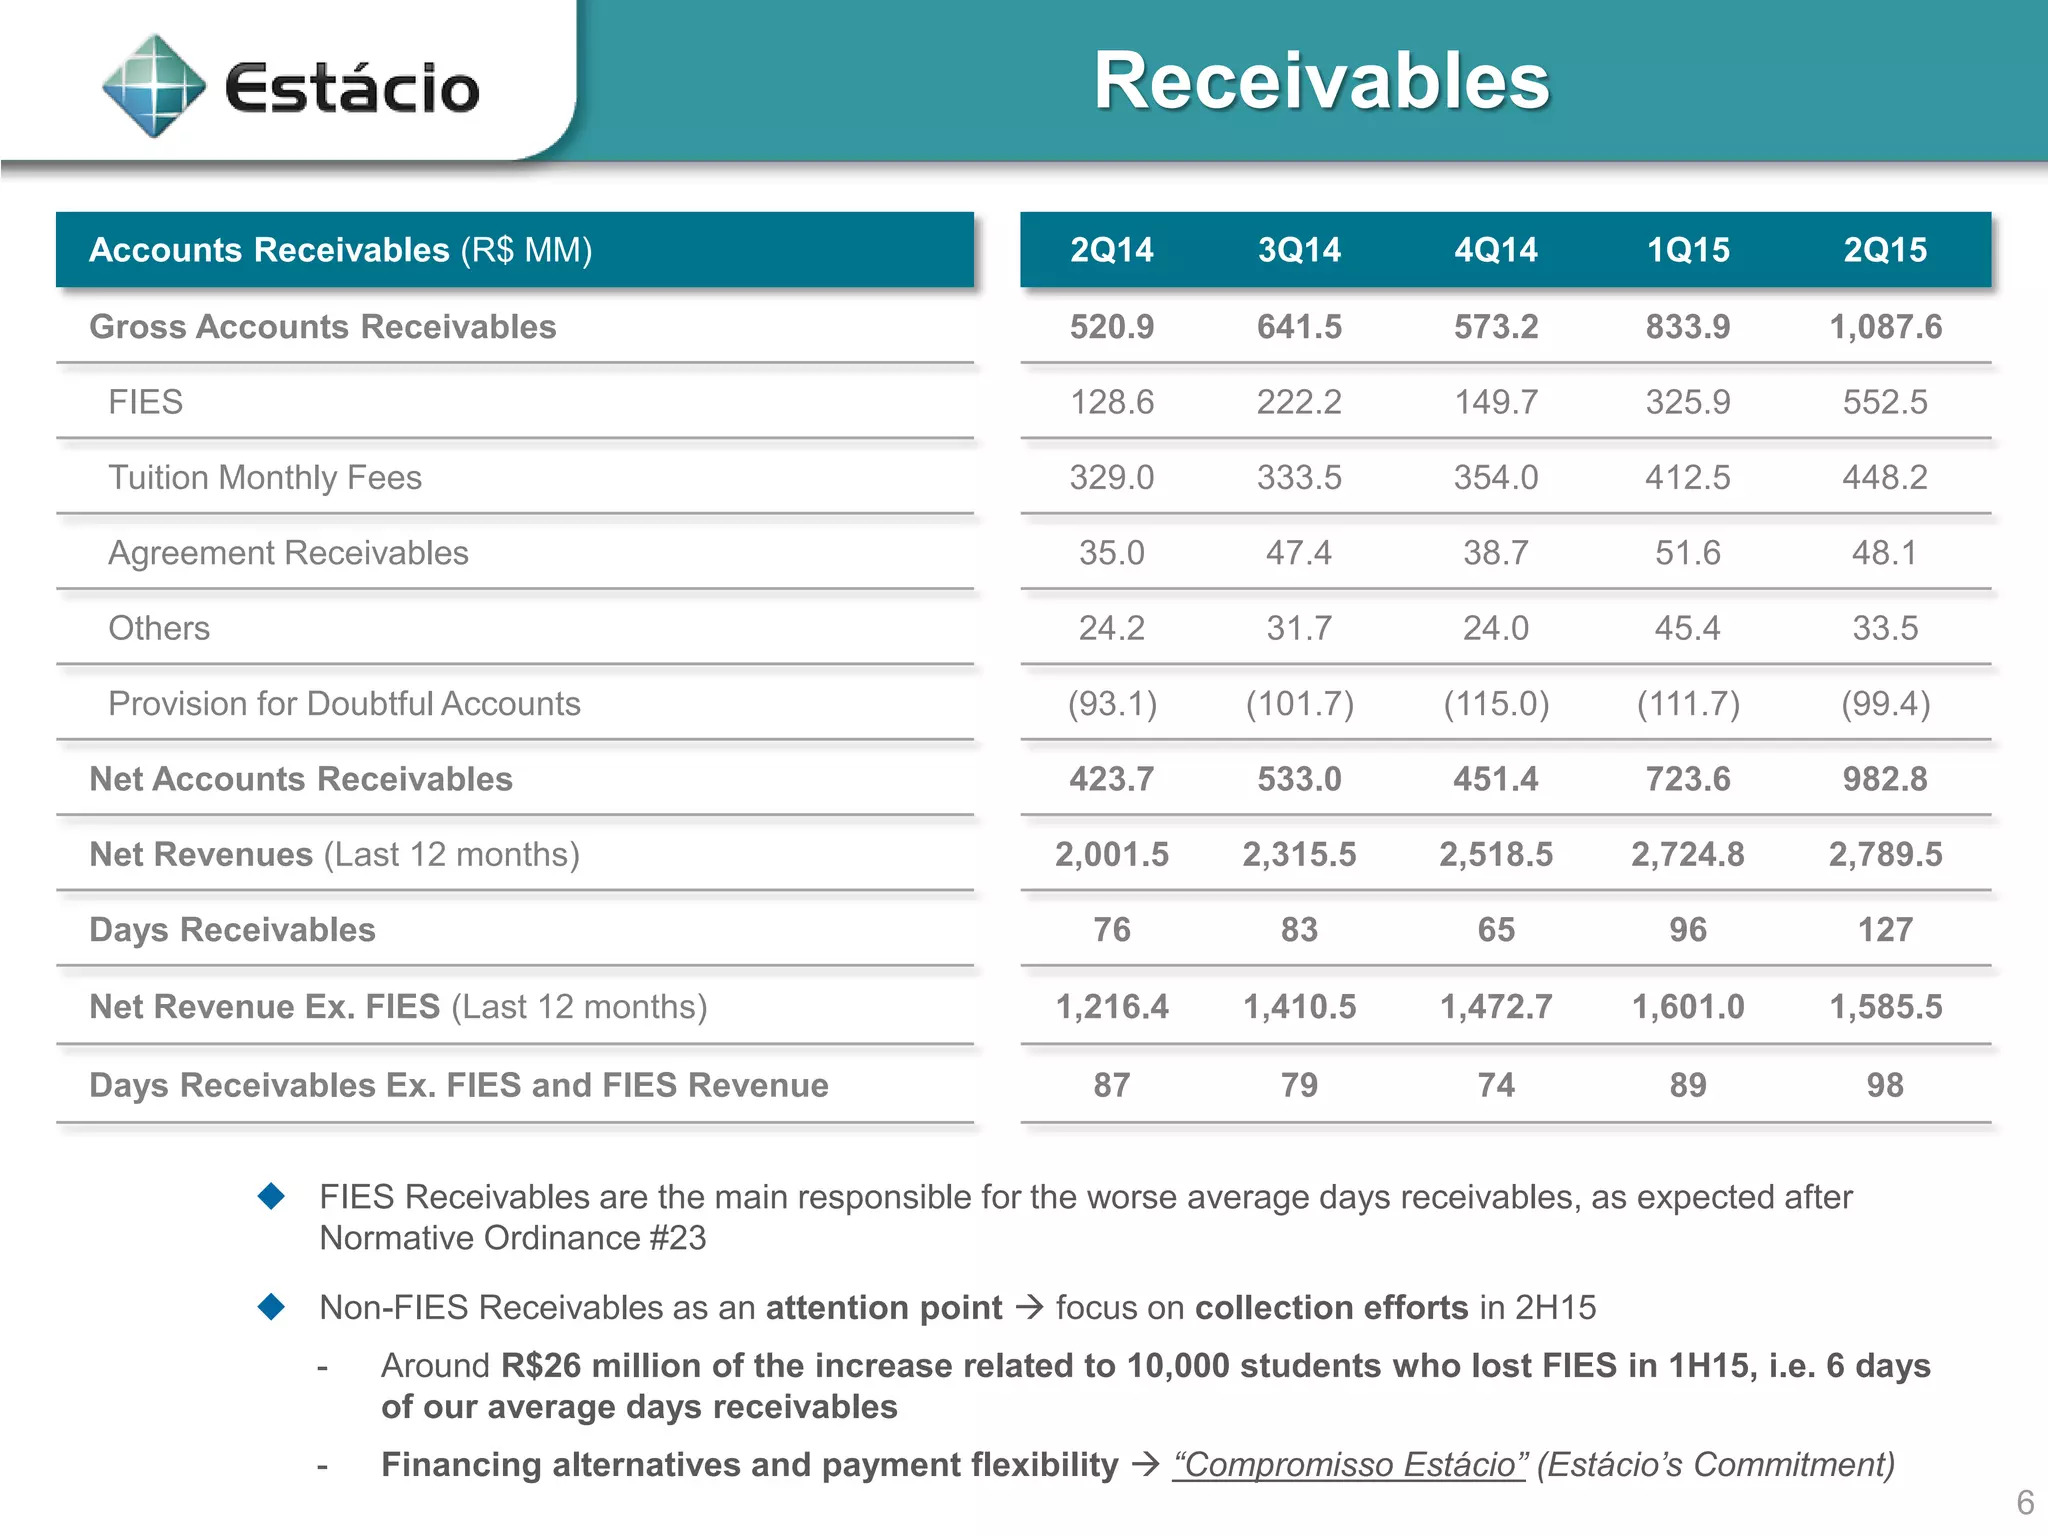
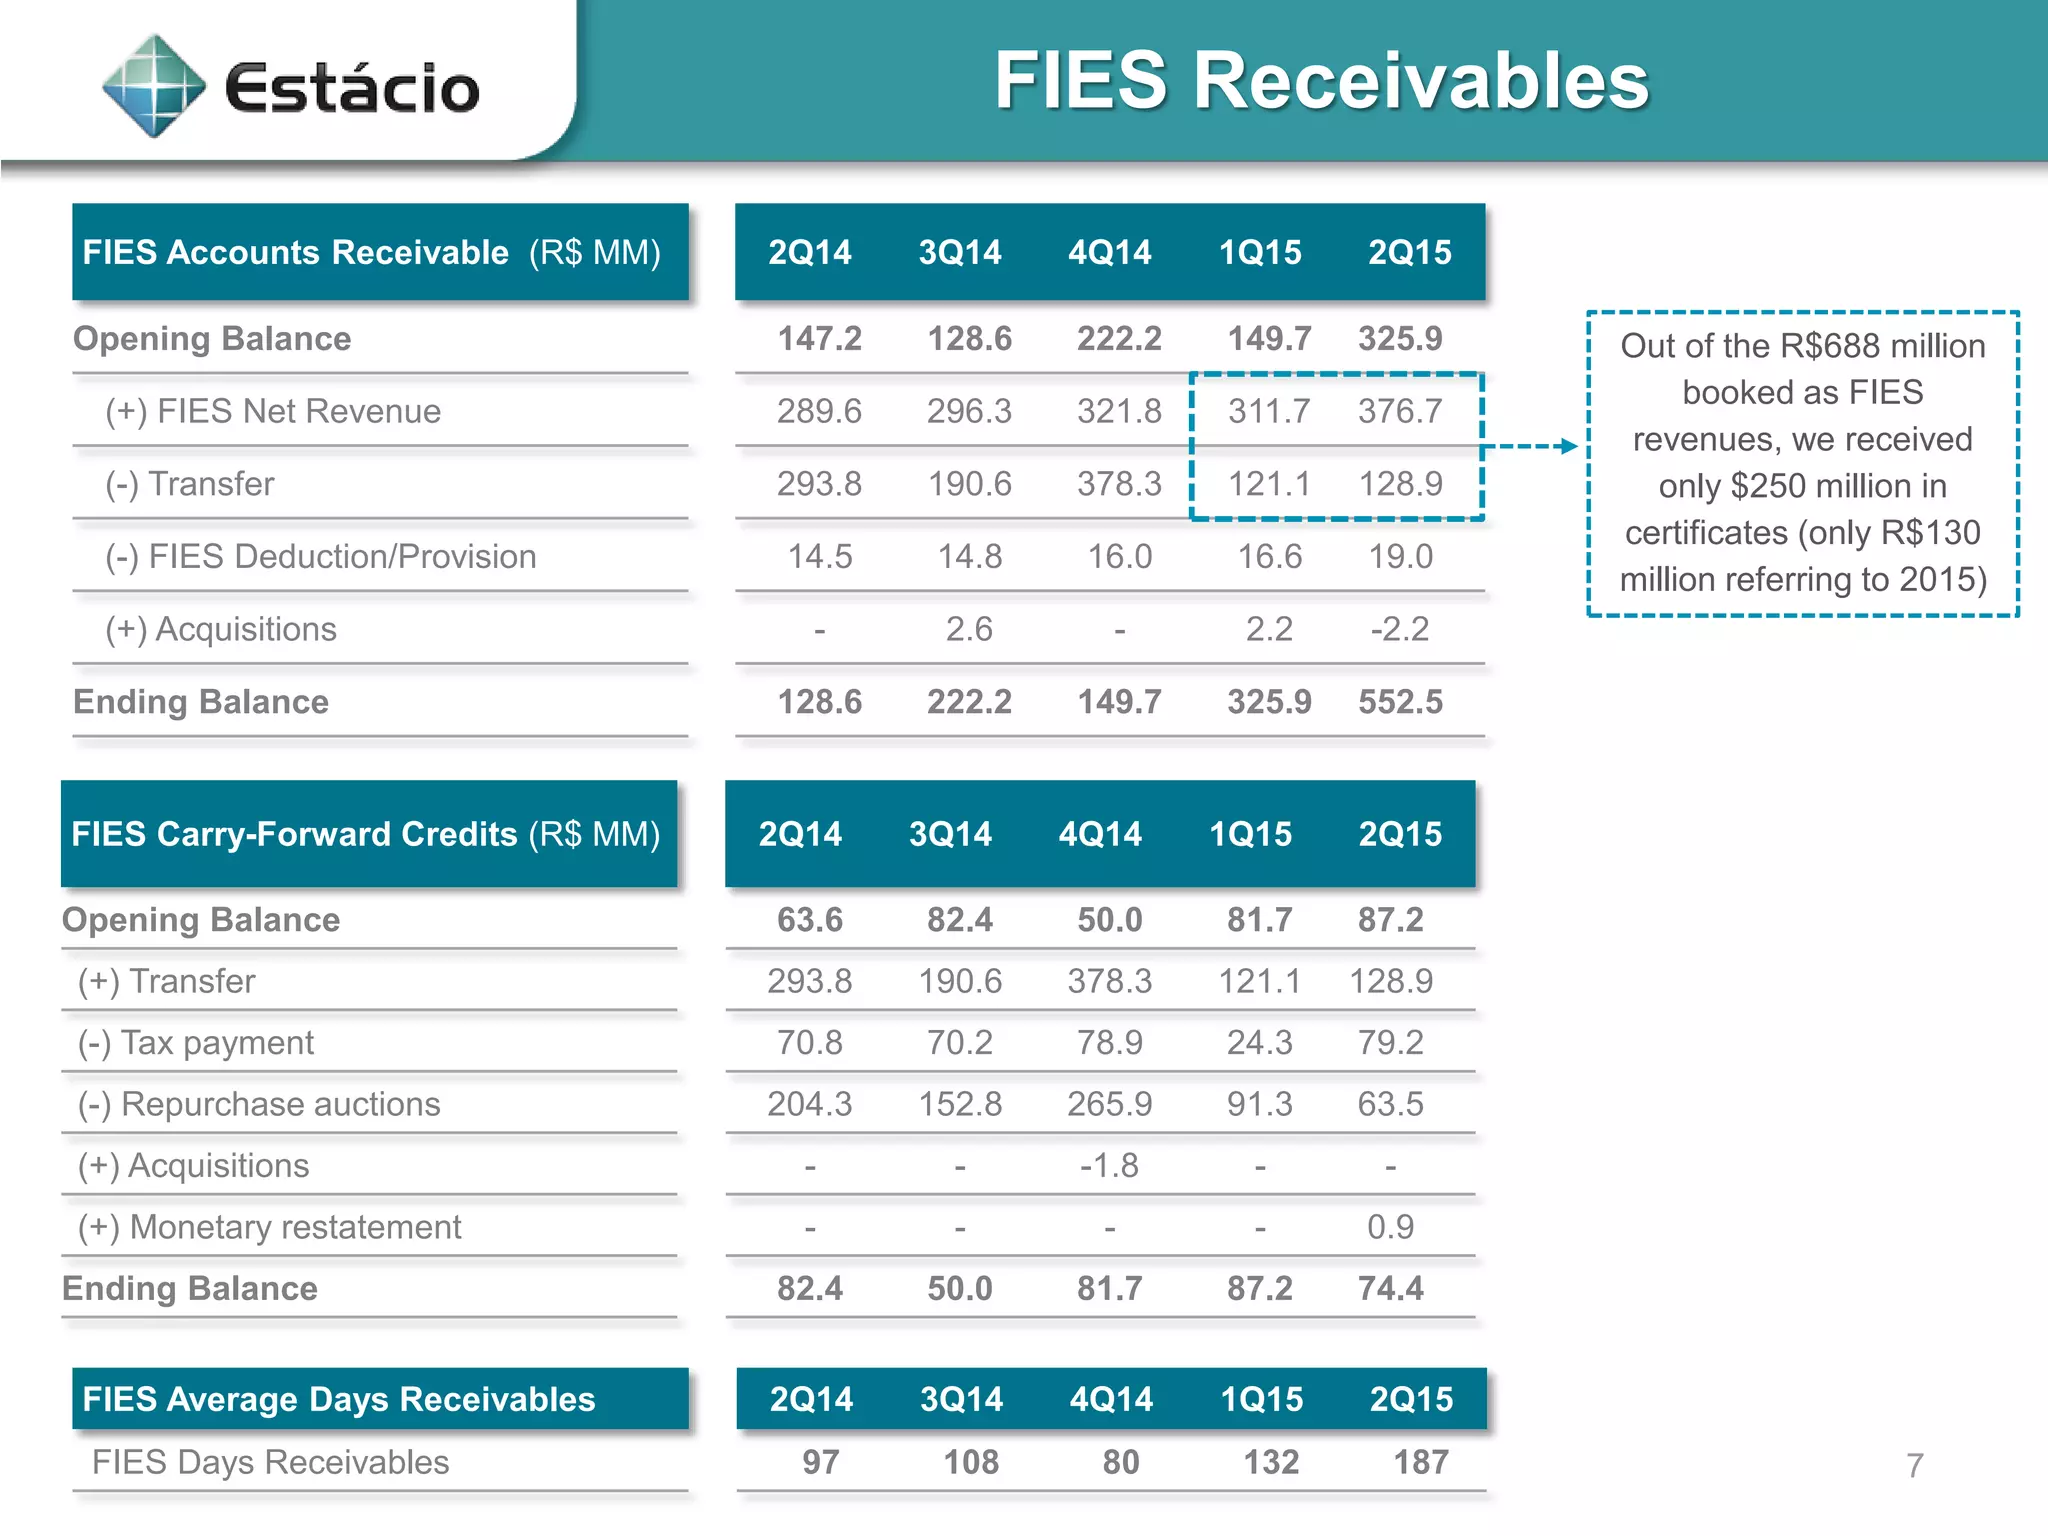
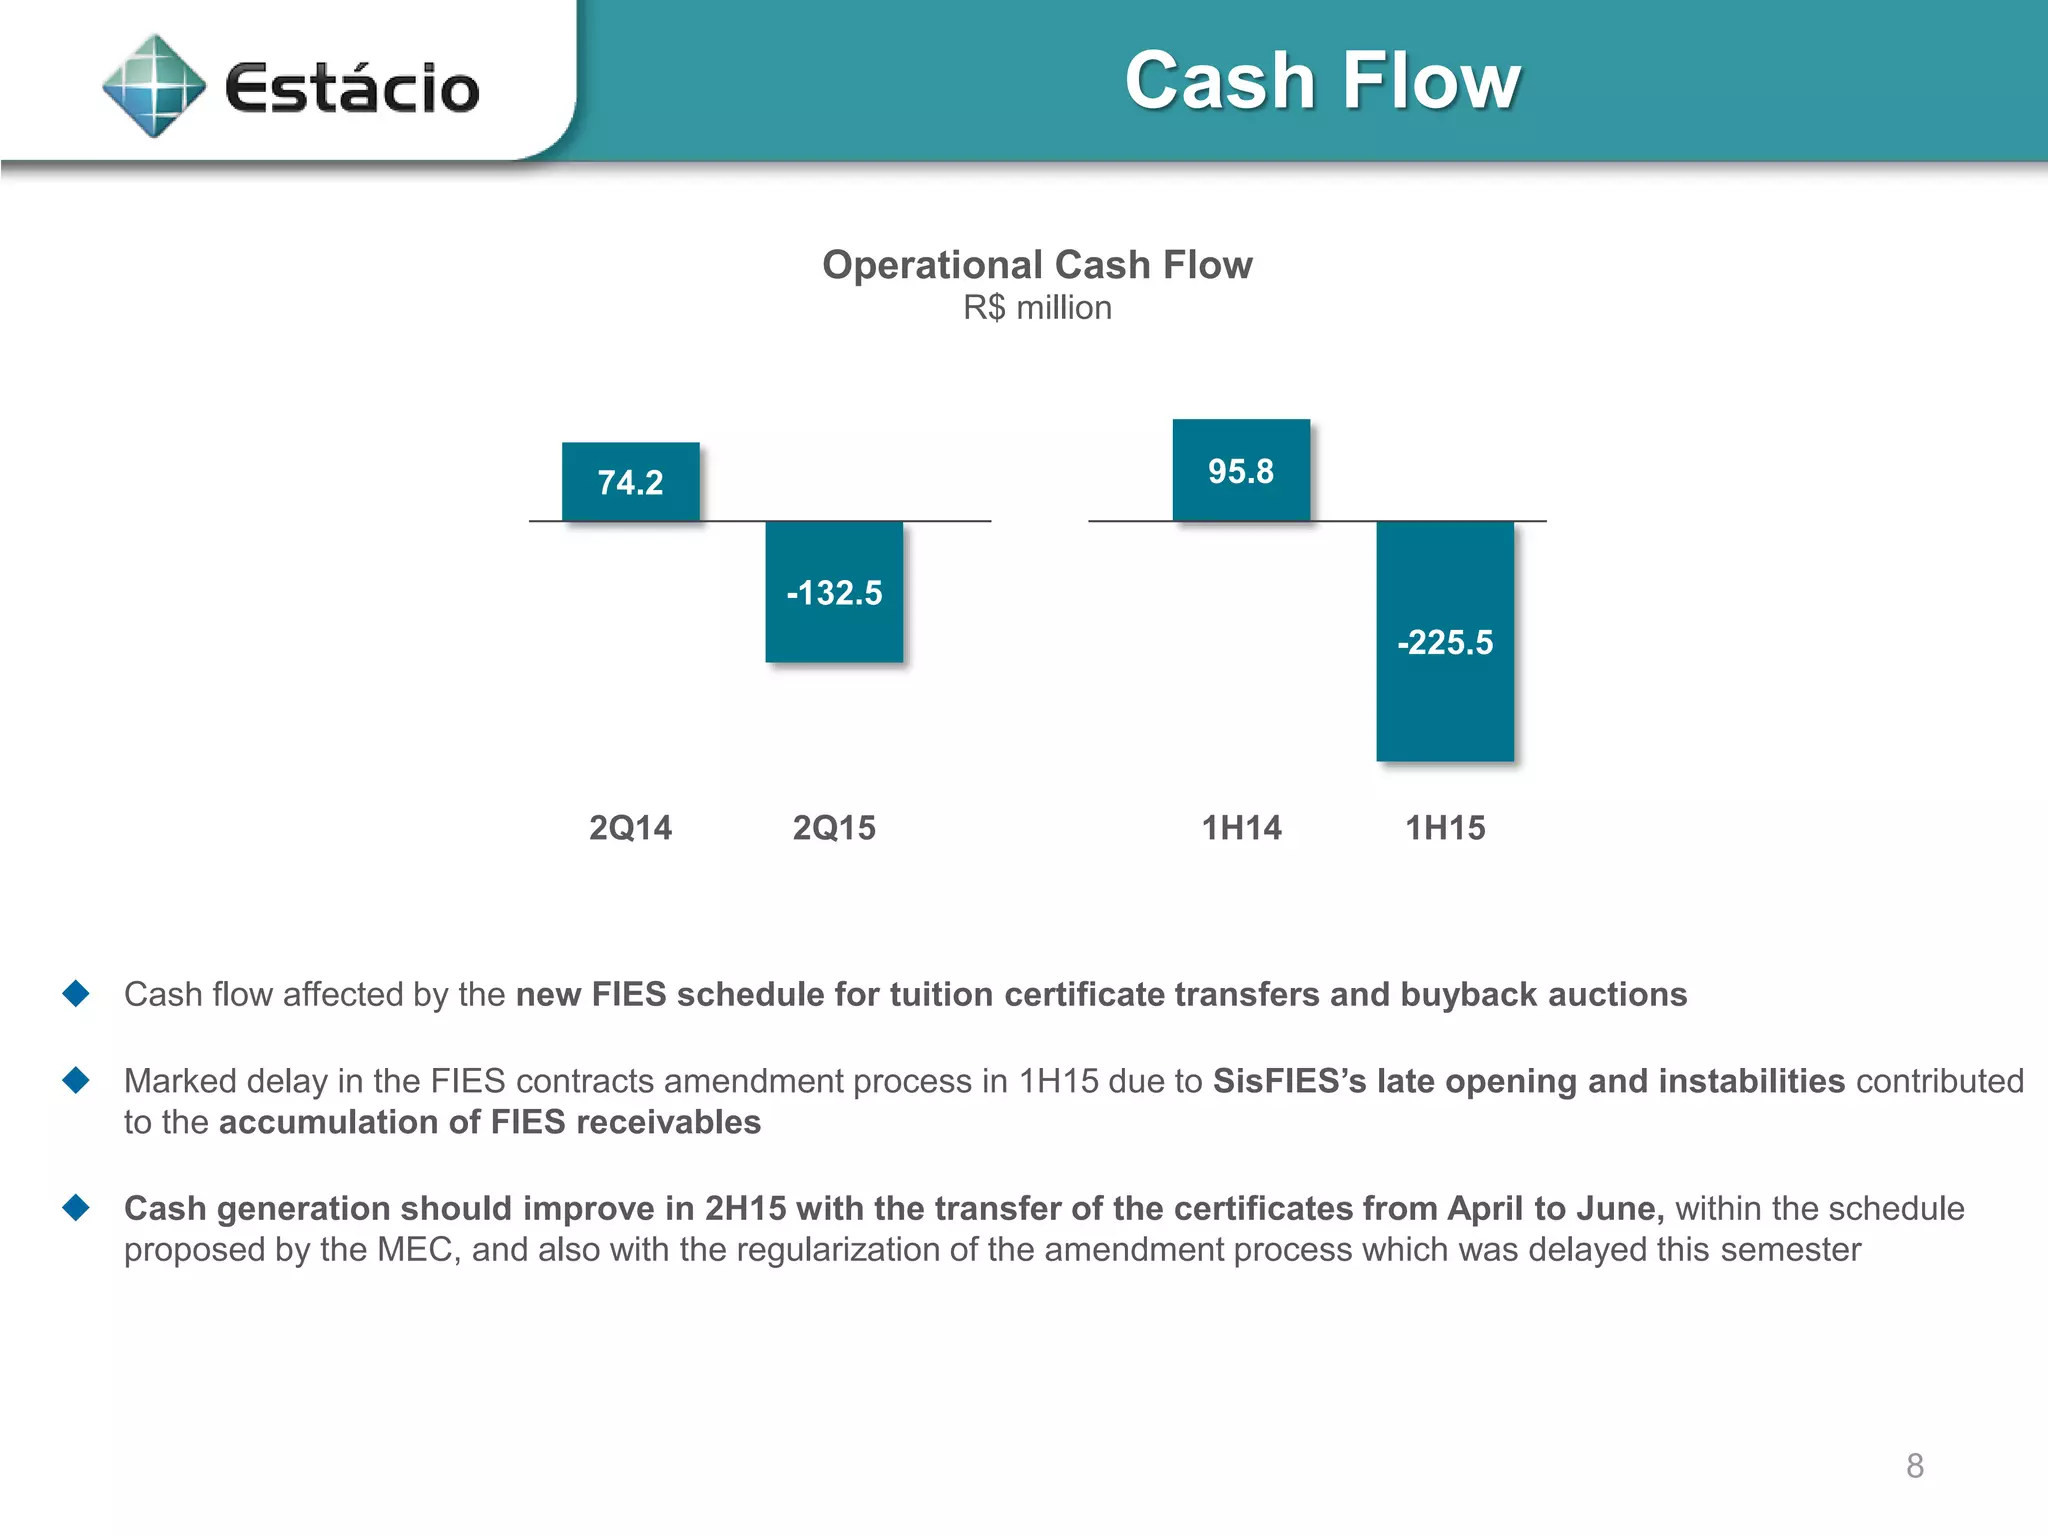
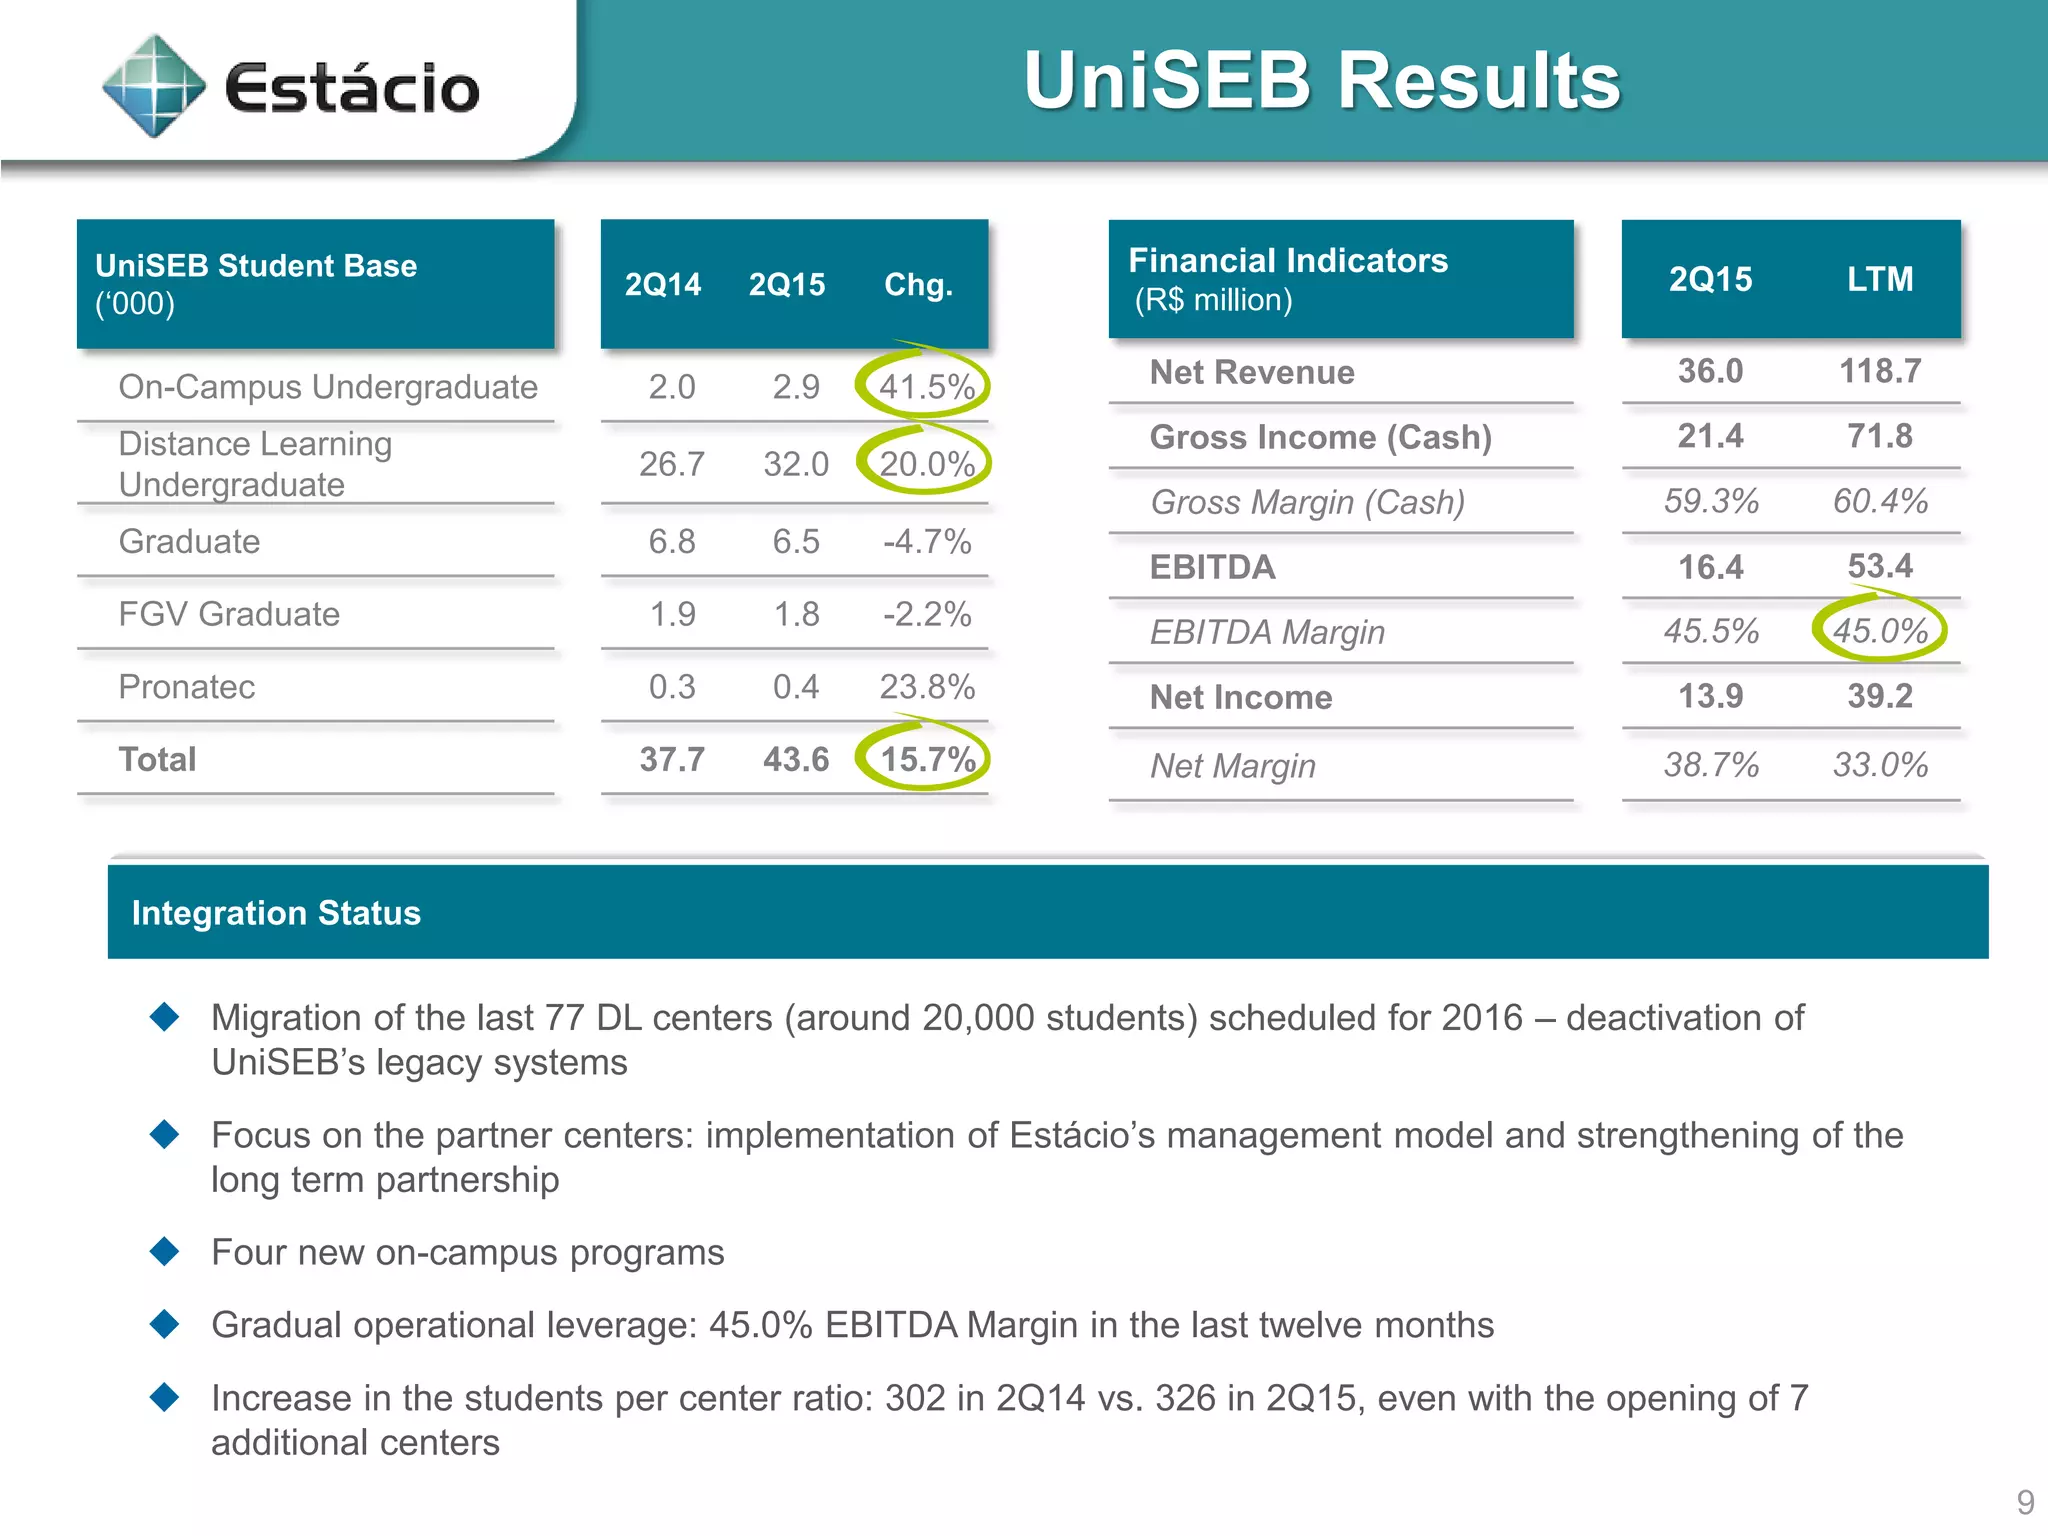
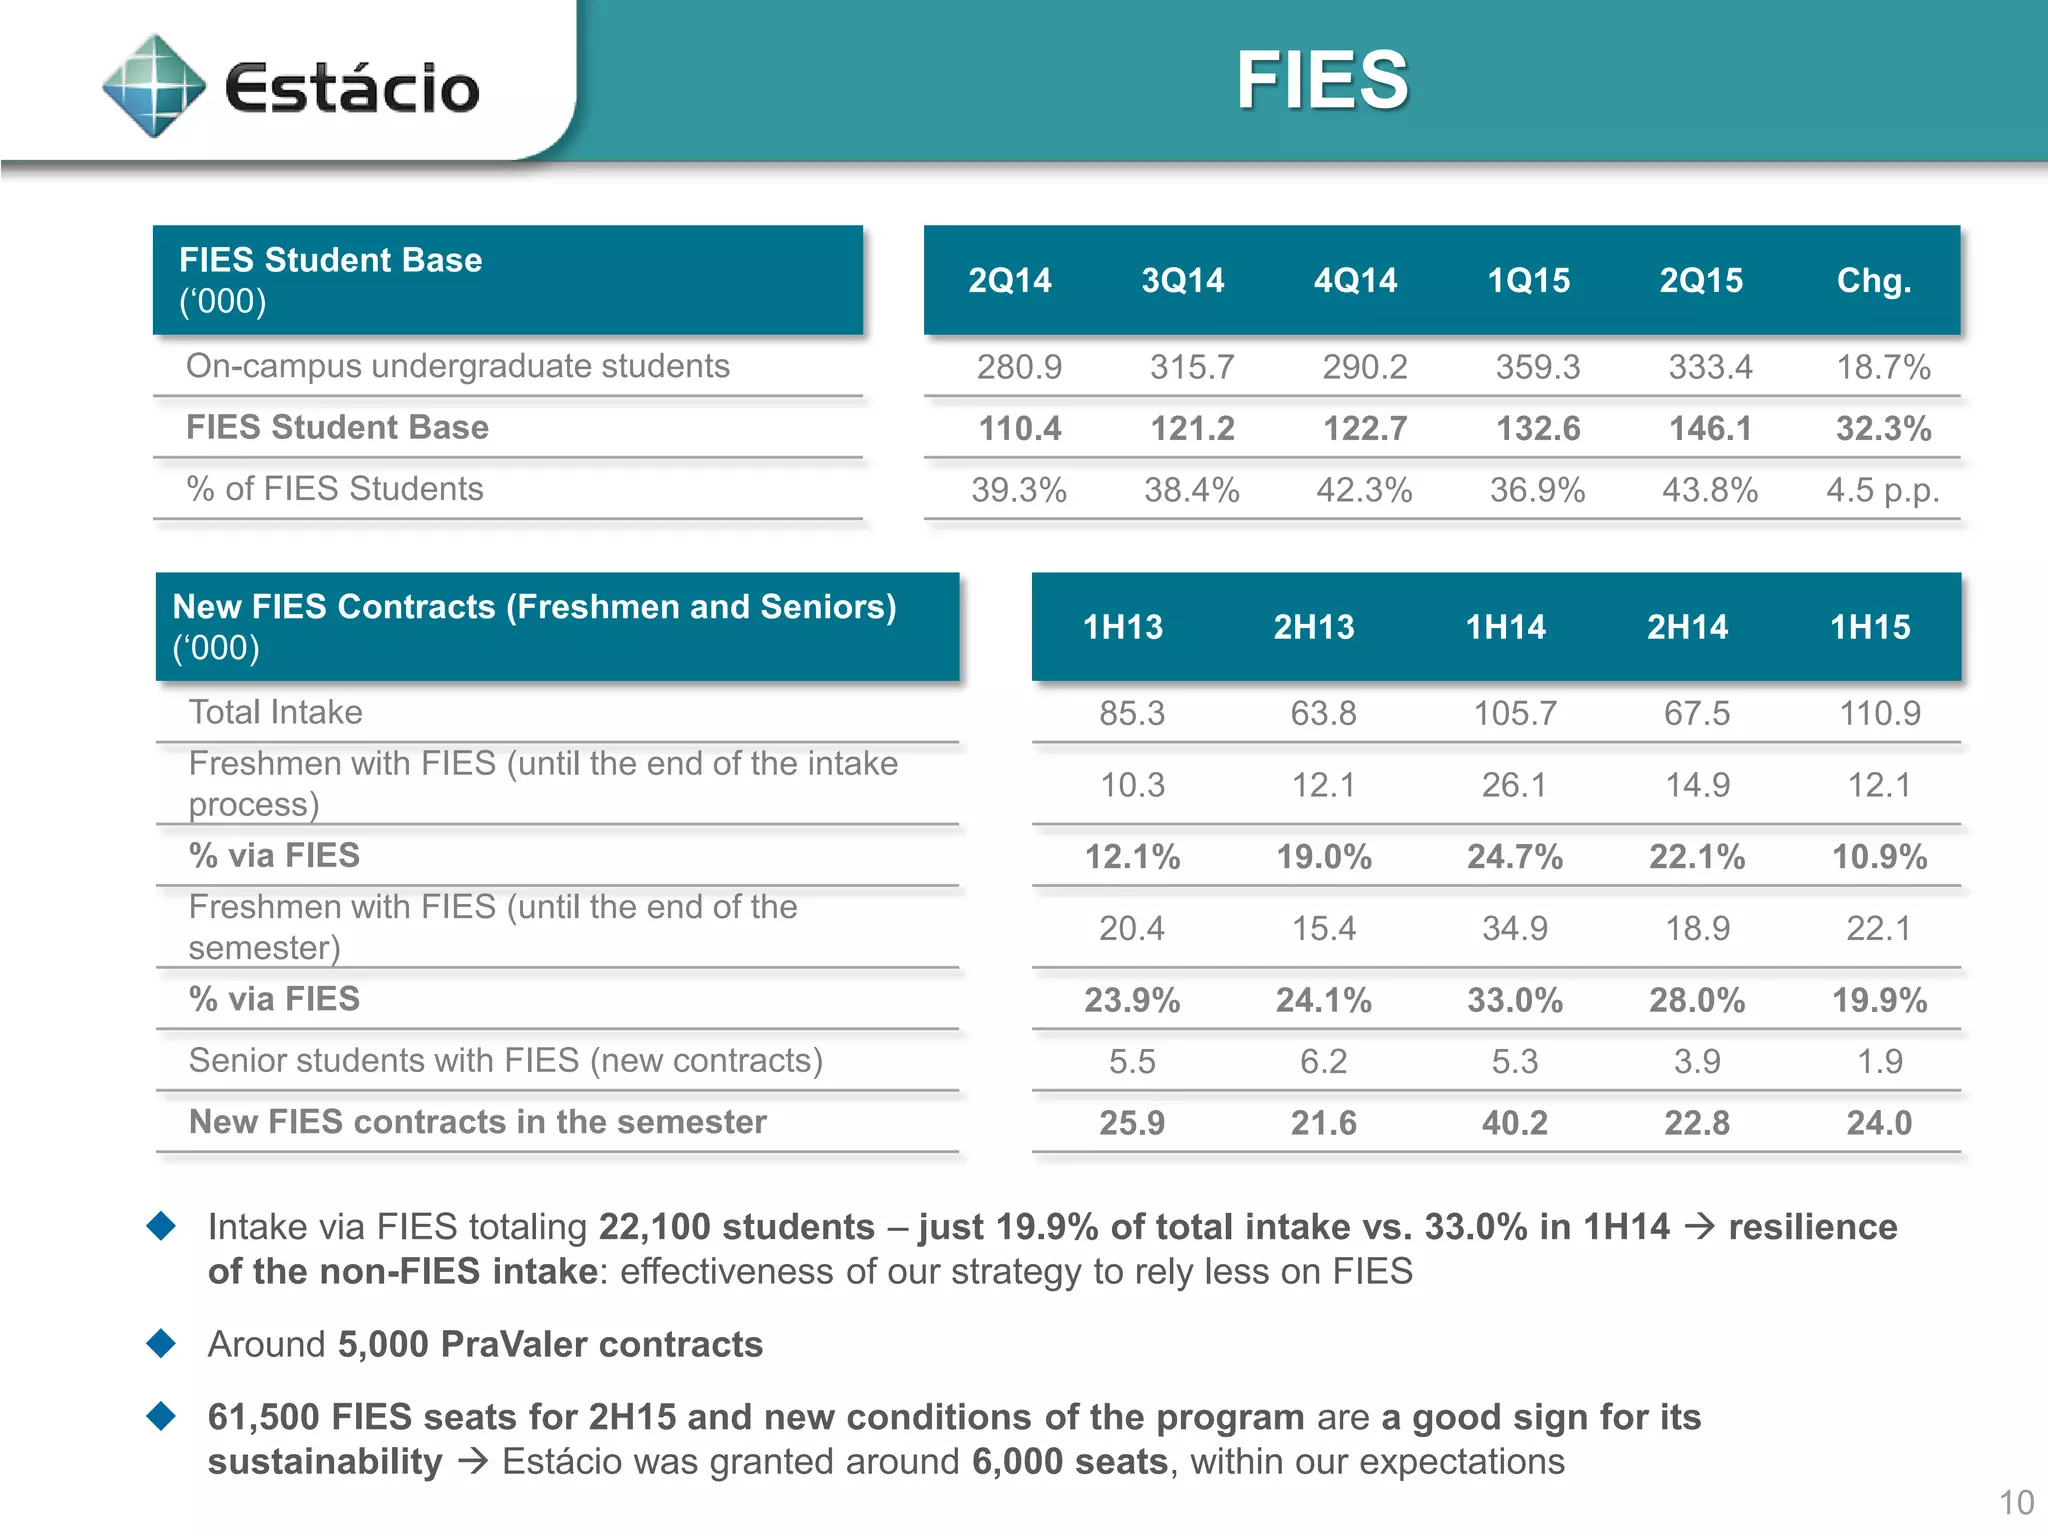
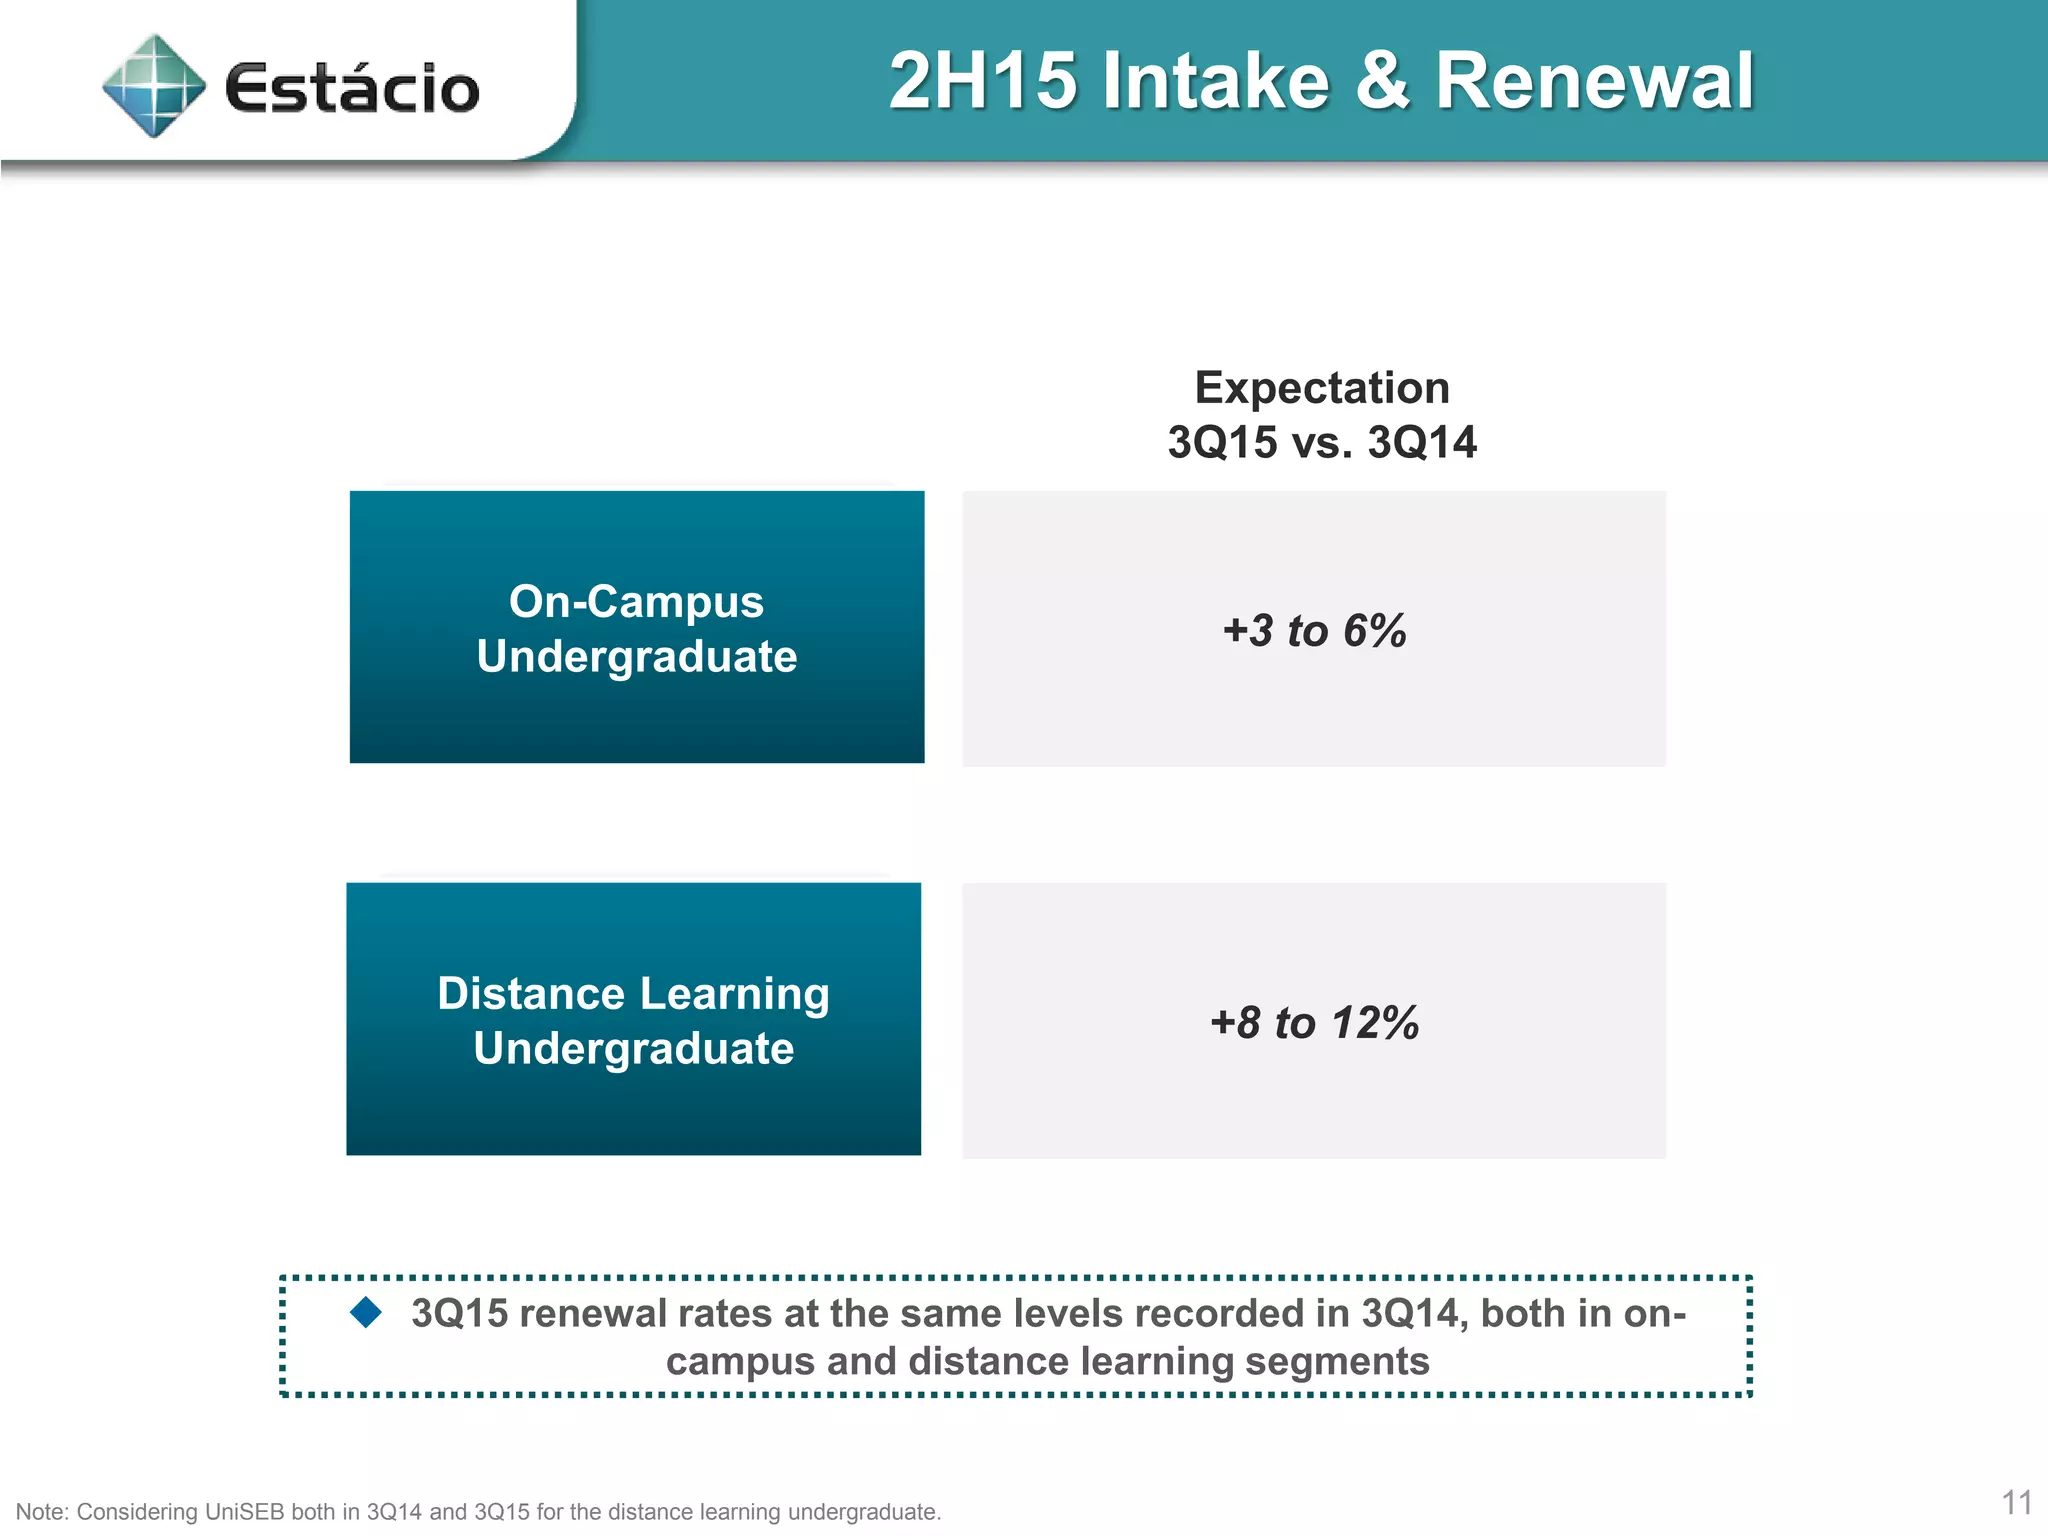
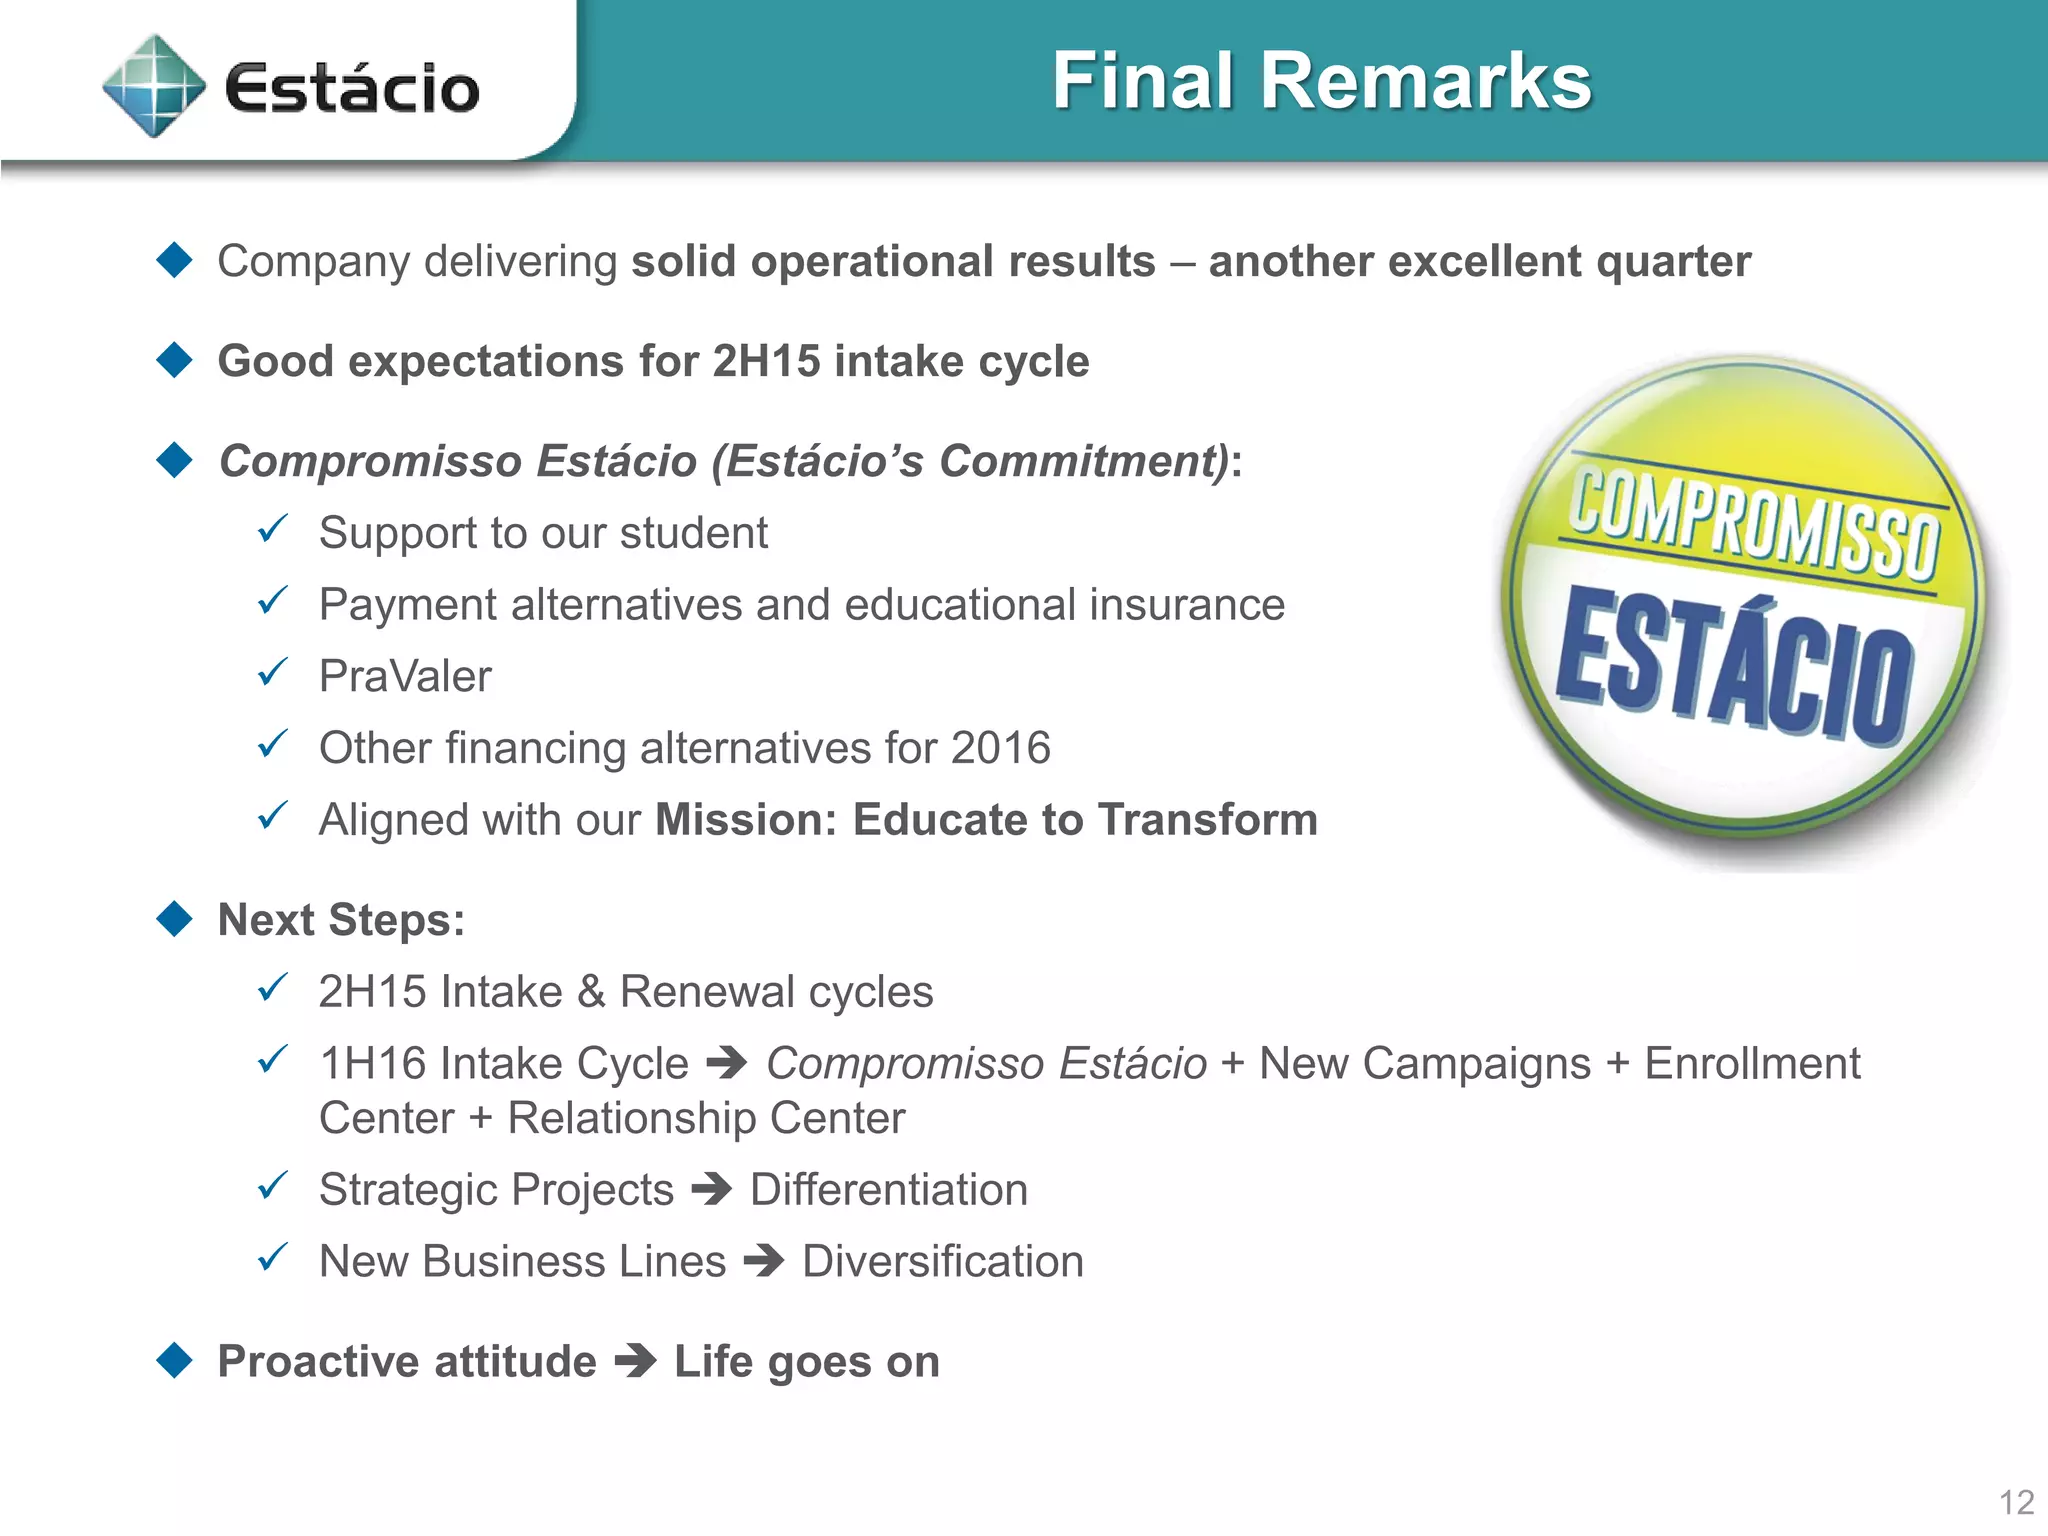

This document summarizes Estácio Participações' 2Q15 results. It reported solid organic and inorganic growth with a 31% increase in student base and net revenue. EBITDA grew 57% and margins expanded. Another strategic acquisition was completed. Preliminary results for medical residency seats were excellent. Receivables increased due to delays in FIES transfers but cash generation is expected to improve in 2H15. Integration of the UniSEB acquisition is on track. Renewal rates remained stable and outlook for 2H15 intake is positive. The company is focused on supporting students through initiatives like Compromisso Estácio during a period of lower FIES availability.


